Whitehouse: Fire Incidents, Texas (TX)
Where are fire incidents reported in Whitehouse, TX
Something went wrong! Please refresh the page.
|
| |||||||||||||||||||||||||||||||||||||||||||||||||||||||||||||||||||||||||||||||||||||||||||||||||||||||||||||
2004 - 2018 National Fire Incident Reporting System (NFIRS) incidents
- Incident types reported to NFIRS in Whitehouse, TX
- 1,55350.4%Rescue & EMS
- 50816.5%Good Intent Call
- 40913.3%Fire
- 2347.6%Hazardous Condition
- 2126.9%Service Call
- 1234.0%False Alarm
- 240.8%Special Incident
- 150.5%Severe Weather
- Fire incident types reported to NFIRS in Whitehouse, TX
- 19547.7%Outside Fires
- 15537.9%Structure Fires
- 368.8%Mobile Property/Vehicle Fires
- 235.6%Other
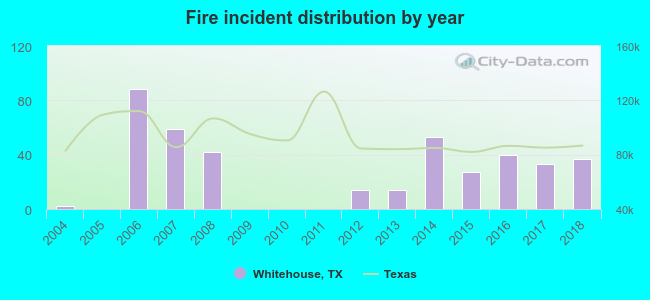 According to the data from the years 2004 - 2018 the average number of fires per year is 27. The highest number of fires - 88 took place in 2006, and the least - 0 in 2005. The data has a growing trend.
The average number of yearly fire incidents per 10k residents in Whitehouse, TX compared to nearest cities:
(Note: Based on data for the last 3 years, including only cities with population 5,000 and above)
| Whitehouse: | 45.6 |
| Tyler: | 29.8 |
| Jacksonville: | 25.2 |
| Lindale: | 274.4 |
| Kilgore: | 113.1 |
| Henderson: | 177.9 |
| Gladewater: | 86.0 |
| Rusk: | 1.8 |
| White Oak: | 55.9 |
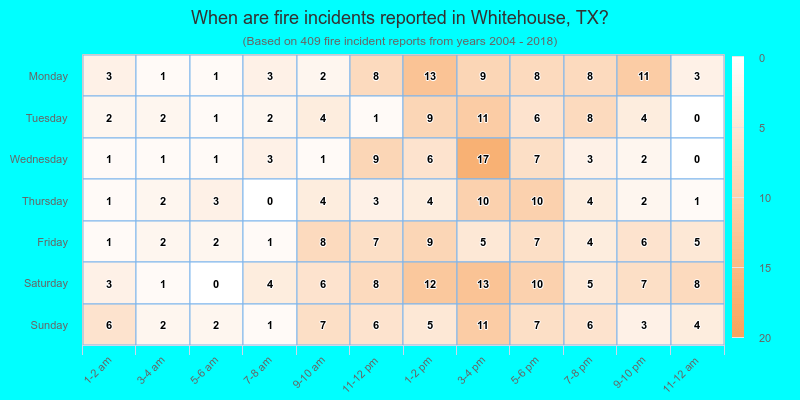
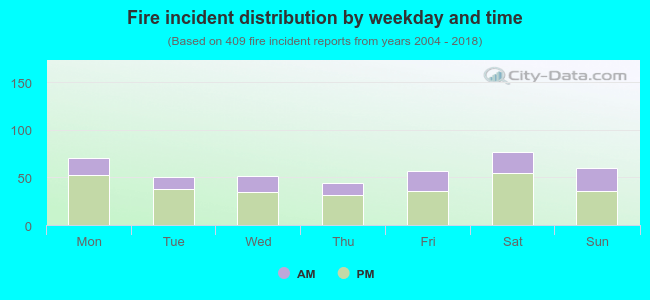 30.8% incidents where reported in the morning and 69.2% in the evening. The most fires (18.8%) took place on Saturday, and the least (10.8%) on Thursday.
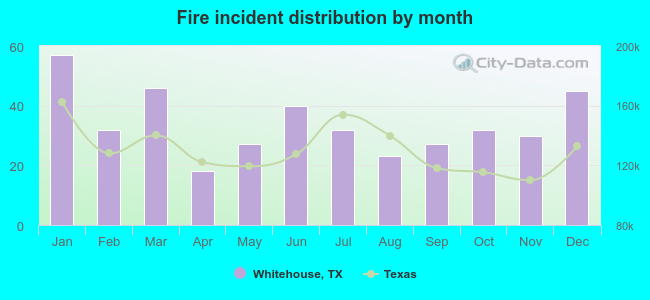 Based on the 409 fire incident reports from years 2004 - 2018 most fires (13.9%) took place during January, and the least (4.4%) in April.
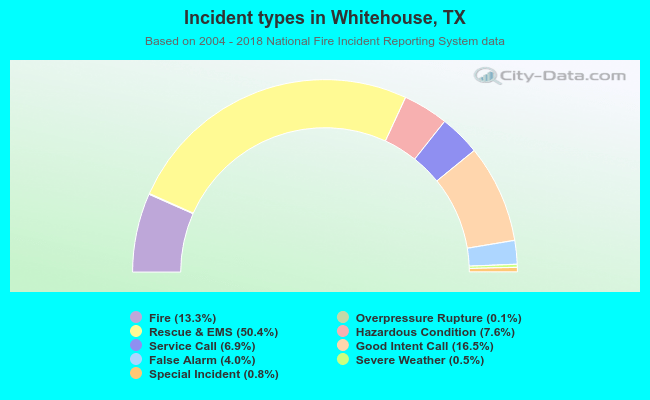 Out of all 3,081 cases reported during the years 2004 - 2018, the most belonged to the categories: Rescue & EMS (50.4%), Good Intent Call (16.5%), and Fire (13.3%).
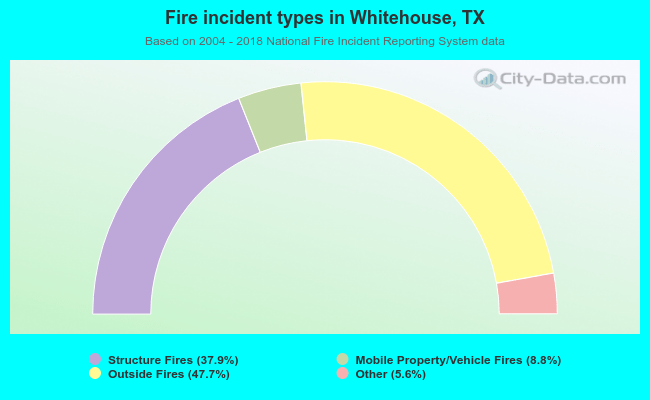 When looking into fire subcategories, the most reports belonged to: Outside Fires (47.7%), and Structure Fires (37.9%).