Kilgore: Fire Incidents, Texas (TX)
Where are fire incidents reported in Kilgore, TX
Something went wrong! Please refresh the page.
| Fire incidents reported | |
|---|---|
| Sreet name | Count |
| INTERSTATE 20 | 266 |
| GOFORTH RD | 136 |
| HENDERSON BLVD | 132 |
| FM 1252 | 110 |
| DANVILLE RD | 100 |
| HIGHWAY 259 | 84 |
| 31 HWY | 82 |
| 42 HWY | 78 |
| STONE RD | 70 |
| HIGHWAY 31 | 66 |
| LONGVIEW ST | 62 |
| 135 HWY | 56 |
| FM 1249 | 54 |
| FRITZ-SWANSON RD | 52 |
| 259 BUS | 50 |
| PEAVINE RD | 50 |
| 259 HWY | 48 |
| FM 2276 | 48 |
| HOUSTON ST | 48 |
| INDUSTRIAL DR | 46 |
| KILGORE ST | 46 |
| INDUSTRIAL BLVD | 44 |
| HWY 31 | 42 |
| OLD GLADEWATER HWY | 42 |
| 1252 FM | 40 |
| 20 | 40 |
| RIVER RD | 40 |
| BROADWAY BLVD | 38 |
| POST OAK RD | 38 |
| CR 294 | 34 |
| Other | 2,057 |
2002 - 2018 National Fire Incident Reporting System (NFIRS) incidents
- Incident types reported to NFIRS in Kilgore, TX
- 5,39636.1%Rescue & EMS
- 4,09927.4%Fire
- 1,93913.0%Hazardous Condition
- 1,51310.1%Good Intent Call
- 1,2428.3%Service Call
- 5924.0%False Alarm
- 890.6%Severe Weather
- 420.3%Special Incident
- 360.2%Overpressure Rupture
- Fire incident types reported to NFIRS in Kilgore, TX
- 2,33356.9%Outside Fires
- 1,04225.4%Structure Fires
- 60014.6%Mobile Property/Vehicle Fires
- 1243.0%Other
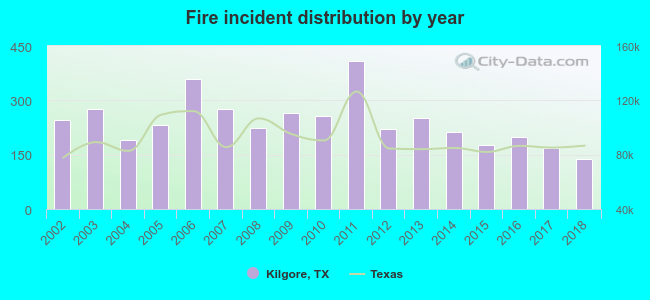 Based on the data from the years 2002 - 2018 the average number of fire incidents per year is 241. The highest number of fire incidents - 408 took place in 2011, and the least - 139 in 2018. The data has a declining trend.
The average number of yearly fire incidents per 10k residents in Kilgore, TX compared to nearest cities:
(Note: Based on data for the last 3 years, including only cities with population 5,000 and above)
| Kilgore: | 113.1 |
| White Oak: | 55.9 |
| Longview: | 57.1 |
| Gladewater: | 86.0 |
| Henderson: | 177.9 |
| Whitehouse: | 45.6 |
| Gilmer: | 449.8 |
| Tyler: | 29.8 |
| Harleton: | 1.6 |
 The median response time based on all reported fire incidents is 8 minutes. This is higher than the Texas median value.
The median response time in Kilgore, TX compared to nearest cities:
(Note: Based on data for all years, including only cities with at least 500 fire incidents)
| Kilgore: | 8 minutes |
| Overton: | 6 minutes |
| White Oak: | 6 minutes |
| Longview: | 6 minutes |
| Gladewater: | 7 minutes |
| Arp: | 8 minutes |
| Henderson: | 7 minutes |
| Hallsville: | 9 minutes |
| Winona: | 15 minutes |
 According to the reports from the years 2002 - 2018 the average number of fire-related yearly deaths is 1. The highest number of deaths - 5 took place in 2007, and the lowest - 0 in 2004. The data has a rising trend.
The average number of fatalities per 1,000 fire incidents is 5. This indicator was the highest - 18 in 2007, and the lowest 0 in 2004. The trend for fatalities per 1,000 fire incidents is rising. Compared to the state value the number of deaths per 1,000 incidents is much higher.
According to the reports from the years 2002 - 2018 the average number of fire-related yearly deaths is 1. The highest number of deaths - 5 took place in 2007, and the lowest - 0 in 2004. The data has a rising trend.
The average number of fatalities per 1,000 fire incidents is 5. This indicator was the highest - 18 in 2007, and the lowest 0 in 2004. The trend for fatalities per 1,000 fire incidents is rising. Compared to the state value the number of deaths per 1,000 incidents is much higher.
 According to the data from the years 2002 - 2018 the average number of fire-related yearly casualties is 2. The highest number of reported casualties - 8 took place in 2006, and the lowest - 0 in 2008. The data has a decreasing trend.
The average number of injuries per 1,000 fires is 8. This indicator was the highest - 22 in 2006, and the lowest 0 in 2008. The trend for injuries per 1,000 fires is dropping. Compared to the state value the number of casualties per 1,000 incidents is similar.
According to the data from the years 2002 - 2018 the average number of fire-related yearly casualties is 2. The highest number of reported casualties - 8 took place in 2006, and the lowest - 0 in 2008. The data has a decreasing trend.
The average number of injuries per 1,000 fires is 8. This indicator was the highest - 22 in 2006, and the lowest 0 in 2008. The trend for injuries per 1,000 fires is dropping. Compared to the state value the number of casualties per 1,000 incidents is similar.Casualties per 1,000 incidents in Kilgore, TX compared to nearest cities:
(Note: Based on data for all years, including only cities with at least 500 fire incidents)
| Kilgore: | 7.8 |
| Overton: | 0.0 |
| White Oak: | 3.1 |
| Longview: | 17.1 |
| Gladewater: | 8.7 |
| Arp: | 0.0 |
| Henderson: | 0.8 |
| Hallsville: | 3.8 |
| Winona: | 3.2 |
 29.3% incidents where reported in the morning and 70.7% in the evening. The most fires (15.9%) took place on Saturday, and the least (12.8%) on Tuesday.
 According to the 4,099 incident reports from years 2002 - 2018 most fires (10.5%) took place during August, and the least (6.1%) in November.
 Out of all 14,948 cases reported during the years 2002 - 2018, the most belonged to the categories: Rescue & EMS (36.1%), Fire (27.4%), and Hazardous Condition (13.0%).
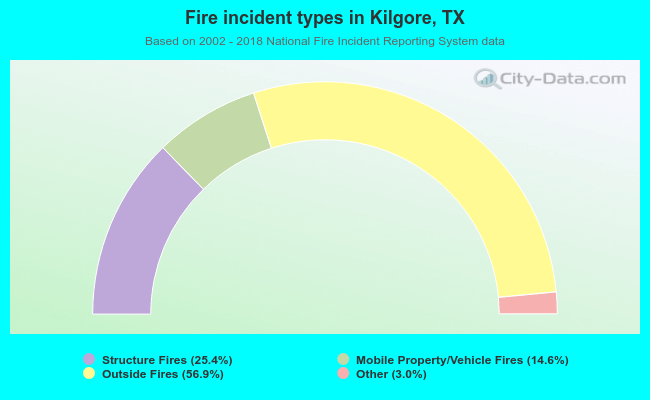 When looking into fire subcategories, the most incidents belonged to: Outside Fires (56.9%), and Structure Fires (25.4%).