West Linn: Fire Incidents, Oregon (OR)
Where are fire incidents reported in West Linn, OR
Something went wrong! Please refresh the page.
| Fire incidents reported | |
|---|---|
| Sreet name | Count |
| WILLAMETTE DR | 66 |
| WEST A ST | 40 |
| PETES MOUNTAIN RD | 34 |
| UNREPORTED | 34 |
| ROSEMONT RD | 26 |
| BLANKENSHIP RD | 24 |
| SALAMO | 24 |
| WILLAMETTE | 24 |
| WILLAMETTE FALLS DR | 24 |
| JOHNSON RD | 22 |
| SALAMO RD | 20 |
| SUNSET AVE | 20 |
| 8TH | 18 |
| BLANKENSHIP | 18 |
| 5TH AVE | 16 |
| 8TH AVE | 16 |
| A ST | 16 |
| 16TH ST | 14 |
| DOLLAR ST | 14 |
| MAPLETON DR | 14 |
| ROSEMONT | 14 |
| BORLAND RD | 12 |
| IMPERIAL DR | 12 |
| JOHNSON | 12 |
| MOUNTAIN RD | 12 |
| BARRINGTON | 10 |
| CRESTVIEW DR | 10 |
| HOOD ST | 10 |
| HORIZON DR | 10 |
| PARKER RD | 10 |
| Other | 415 |
2002 - 2018 National Fire Incident Reporting System (NFIRS) incidents
- Incident types reported to NFIRS in West Linn, OR
- 2,47448.5%Rescue & EMS
- 1,01119.8%Fire
- 52210.2%Good Intent Call
- 4829.4%Hazardous Condition
- 3326.5%Service Call
- 2735.3%False Alarm
- 80.2%Overpressure Rupture
- Fire incident types reported to NFIRS in West Linn, OR
- 48848.3%Structure Fires
- 36135.7%Outside Fires
- 13012.9%Mobile Property/Vehicle Fires
- 323.2%Other
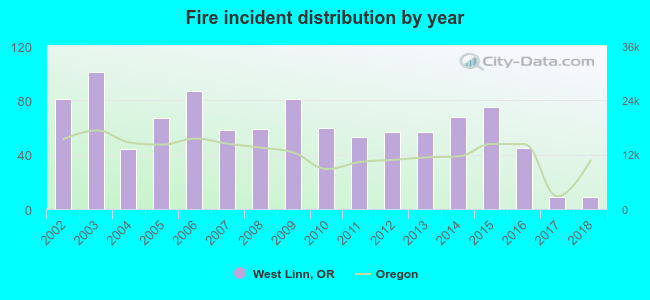 Based on the data from the years 2002 - 2018 the average number of fire incidents per year is 59. The highest number of reported fire incidents - 101 took place in 2003, and the least - 9 in 2017. The data has a declining trend.
The average number of yearly fire incidents per 10k residents in West Linn, OR compared to nearest cities:
(Note: Based on data for the last 3 years, including only cities with population 5,000 and above)
| West Linn: | 8.0 |
| Oregon City: | 20.3 |
| Gladstone: | 27.8 |
| Oak Grove: | 1.6 |
| Lake Oswego: | 12.6 |
| Clackamas: | 79.2 |
| Milwaukie: | 31.5 |
| Tualatin: | 14.5 |
| Beaver Creek: | 6.4 |
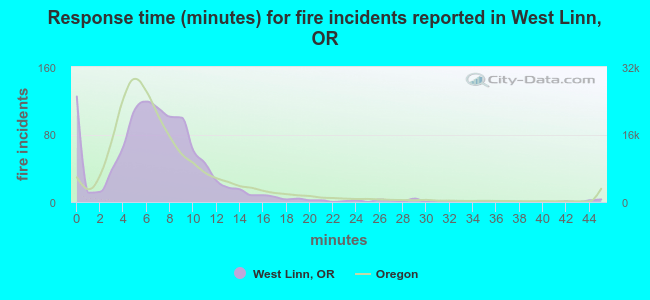 The median response time based on all reported fire incidents is 7 minutes. This is close to the state median value.
The median response time in West Linn, OR compared to nearest cities:
(Note: Based on data for all years, including only cities with at least 500 fire incidents)
| West Linn: | 7 minutes |
| Oregon City: | 6 minutes |
| Gladstone: | 5 minutes |
| Lake Oswego: | 6 minutes |
| Clackamas: | 6 minutes |
| Milwaukie: | 5 minutes |
| Tualatin: | 6 minutes |
| Canby: | 7 minutes |
| Wilsonville: | 6 minutes |
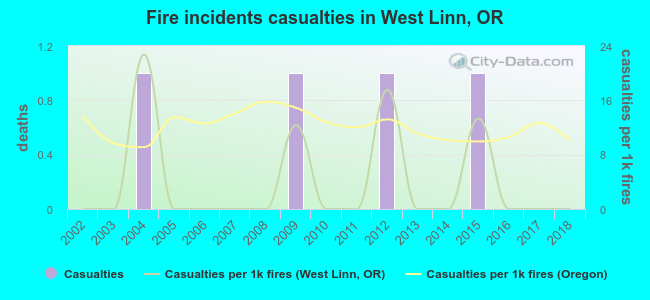 According to the reports from the years 2002 - 2018 the average number of fire-related yearly casualties is 0. The highest number of injuries - 1 took place in 2004, and the lowest - 0 in 2002. The data has a constant trend.
The average number of casualties per 1,000 fires is 4. This indicator was the highest - 23 in 2004, and the lowest 0 in 2002. The trend for casualties per 1,000 incidents is constant. Compared to the state value the number of injuries per 1,000 incidents is much lower.
According to the reports from the years 2002 - 2018 the average number of fire-related yearly casualties is 0. The highest number of injuries - 1 took place in 2004, and the lowest - 0 in 2002. The data has a constant trend.
The average number of casualties per 1,000 fires is 4. This indicator was the highest - 23 in 2004, and the lowest 0 in 2002. The trend for casualties per 1,000 incidents is constant. Compared to the state value the number of injuries per 1,000 incidents is much lower.Casualties per 1,000 incidents in West Linn, OR compared to nearest cities:
(Note: Based on data for all years, including only cities with at least 500 fire incidents)
| West Linn: | 4.0 |
| Oregon City: | 9.7 |
| Gladstone: | 5.0 |
| Lake Oswego: | 13.1 |
| Clackamas: | 14.0 |
| Milwaukie: | 24.0 |
| Tualatin: | 10.8 |
| Canby: | 10.8 |
| Wilsonville: | 11.0 |
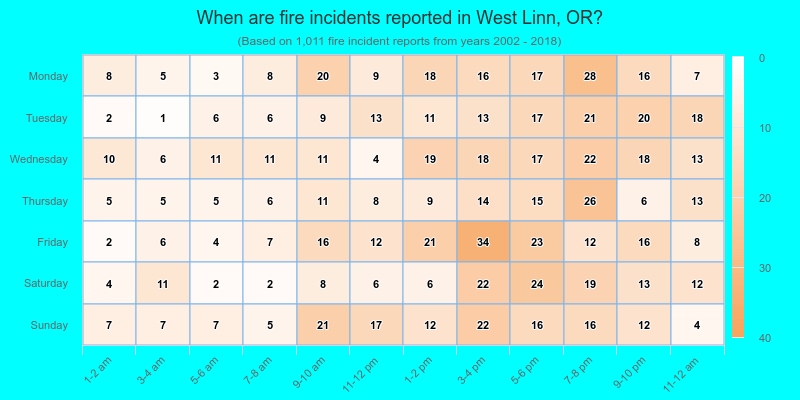
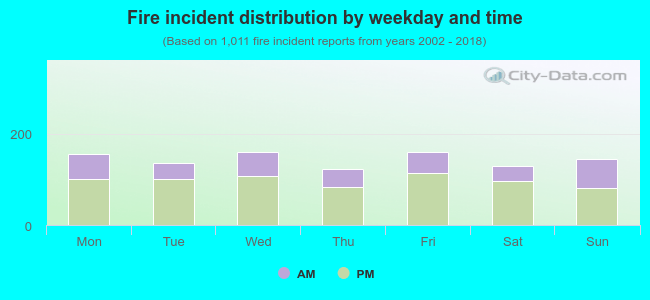 32.3% incidents where reported in the morning and 67.7% in the evening. The most fires (15.9%) took place on Friday, and the least (12.2%) on Thursday.
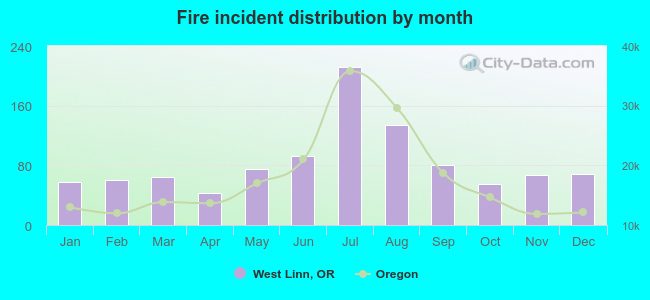 Based on the 1,011 fire incident reports from years 2002 - 2018 most fires (21.0%) took place during July, and the least (4.3%) in April.
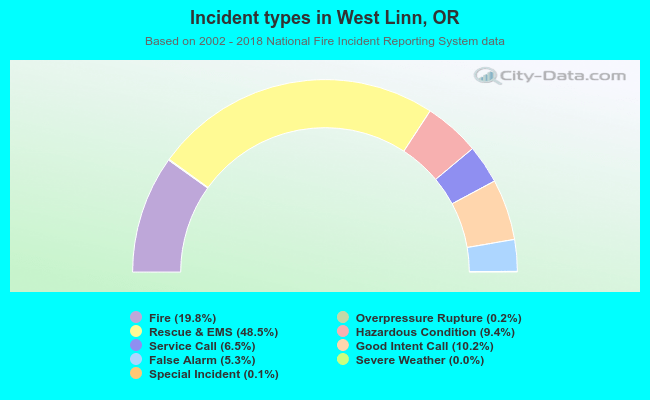 Out of all 5,106 cases reported during the years 2002 - 2018, the most belonged to the categories: Rescue & EMS (48.5%), Fire (19.8%), and Good Intent Call (10.2%).
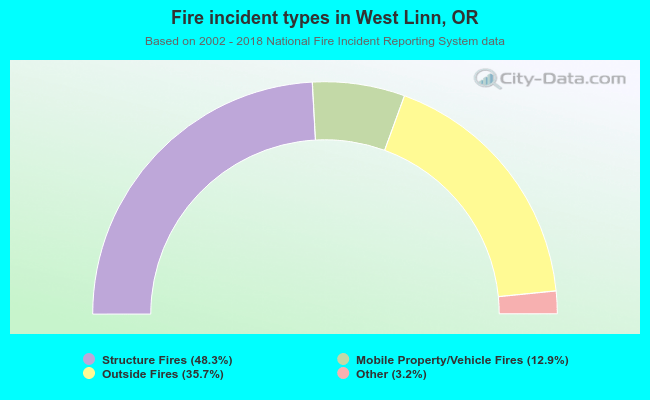 When looking into fire subcategories, the most incidents belonged to: Structure Fires (48.3%), and Outside Fires (35.7%).