Oregon City: Fire Incidents, Oregon (OR)
Where are fire incidents reported in Oregon City, OR
Something went wrong! Please refresh the page.
| Fire incidents reported | |
|---|---|
| Sreet name | Count |
| MOLALLA AVE | 266 |
| BEAVERCREEK RD | 232 |
| MAIN ST | 140 |
| REDLAND RD | 116 |
| HWY 213 | 114 |
| MCLOUGHLIN BLVD | 92 |
| WASHINGTON ST | 78 |
| LELAND RD | 68 |
| CLACKAMAS RIVER DR | 62 |
| CLACKAMETTE DR | 62 |
| HENRICI RD | 56 |
| LINN AVE | 52 |
| UNREPORTED | 52 |
| 213 HWY | 50 |
| SPRINGWATER RD | 50 |
| CLAIRMONT WAY | 48 |
| HOLCOMB BLVD | 48 |
| RIDGE RD | 46 |
| SOUTH END RD | 44 |
| MEYERS RD | 34 |
| SPANGLER RD | 34 |
| WARNER MILNE RD | 34 |
| DIVISION ST | 32 |
| HIGH ST | 32 |
| KAEN RD | 32 |
| MAY ST | 30 |
| MOLALLA | 30 |
| 12TH ST | 28 |
| CENTER ST | 28 |
| BAKERS FERRY RD | 26 |
| Other | 256 |
2002 - 2018 National Fire Incident Reporting System (NFIRS) incidents
- Incident types reported to NFIRS in Oregon City, OR
- 10,60652.3%Rescue & EMS
- 3,13915.5%Hazardous Condition
- 2,28411.3%Service Call
- 2,27211.2%Fire
- 1,5197.5%Good Intent Call
- 4642.3%False Alarm
- Fire incident types reported to NFIRS in Oregon City, OR
- 92540.7%Structure Fires
- 90139.7%Outside Fires
- 39517.4%Mobile Property/Vehicle Fires
- 512.2%Other
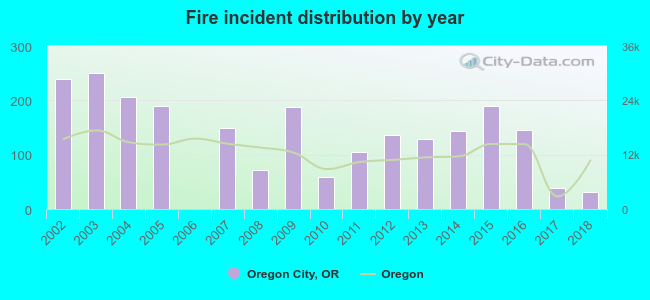 According to the data from the years 2002 - 2018 the average number of fires per year is 134. The highest number of fire incidents - 250 took place in 2003, and the least - 0 in 2006. The data has a decreasing trend.
The average number of yearly fire incidents per 10k residents in Oregon City, OR compared to nearest cities:
(Note: Based on data for the last 3 years, including only cities with population 5,000 and above)
| Oregon City: | 20.3 |
| West Linn: | 8.0 |
| Gladstone: | 27.8 |
| Beaver Creek: | 6.4 |
| Clackamas: | 79.2 |
| Oak Grove: | 1.6 |
| Lake Oswego: | 12.6 |
| Milwaukie: | 31.5 |
| Canby: | 30.4 |
 The median response time based on all reported fire incidents is 6 minutes. This is comparable to the state median value.
The median response time in Oregon City, OR compared to nearest cities:
(Note: Based on data for all years, including only cities with at least 500 fire incidents)
| Oregon City: | 6 minutes |
| West Linn: | 7 minutes |
| Gladstone: | 5 minutes |
| Clackamas: | 6 minutes |
| Lake Oswego: | 6 minutes |
| Milwaukie: | 5 minutes |
| Canby: | 7 minutes |
| Happy Valley: | 5 minutes |
| Tualatin: | 6 minutes |
 According to the data from the years 2002 - 2018 the average number of fire-related yearly deaths is 0. The highest number of deaths - 3 took place in 2002, and the lowest - 0 in 2003. The data has a dropping trend.
 Based on the data from the years 2002 - 2018 the average number of fire-related casualties per year is 1. The highest number of casualties - 7 took place in 2012, and the lowest - 0 in 2006. The data has a decreasing trend.
The average number of injuries per 1,000 fires is 9. This indicator was the highest - 51 in 2012, and the lowest 0 in 2006. The trend for injuries per 1,000 incidents is declining. Compared to the Oregon value the number of injuries per 1,000 fire incidents is lower.
Based on the data from the years 2002 - 2018 the average number of fire-related casualties per year is 1. The highest number of casualties - 7 took place in 2012, and the lowest - 0 in 2006. The data has a decreasing trend.
The average number of injuries per 1,000 fires is 9. This indicator was the highest - 51 in 2012, and the lowest 0 in 2006. The trend for injuries per 1,000 incidents is declining. Compared to the Oregon value the number of injuries per 1,000 fire incidents is lower.Casualties per 1,000 incidents in Oregon City, OR compared to nearest cities:
(Note: Based on data for all years, including only cities with at least 500 fire incidents)
| Oregon City: | 9.7 |
| West Linn: | 4.0 |
| Gladstone: | 5.0 |
| Clackamas: | 14.0 |
| Lake Oswego: | 13.1 |
| Milwaukie: | 24.0 |
| Canby: | 10.8 |
| Happy Valley: | 7.5 |
| Tualatin: | 10.8 |
 32.9% incidents where reported in the morning and 67.1% in the evening. The most fires (15.4%) took place on Thursday, and the least (13.4%) on Tuesday.
 Based on the 2,272 reports from years 2002 - 2018 most fires (15.0%) took place during August, and the least (5.8%) in October.
 Out of all 20,290 cases reported during the years 2002 - 2018, the most belonged to the categories: Rescue & EMS (52.3%), Hazardous Condition (15.5%), and Service Call (11.3%).
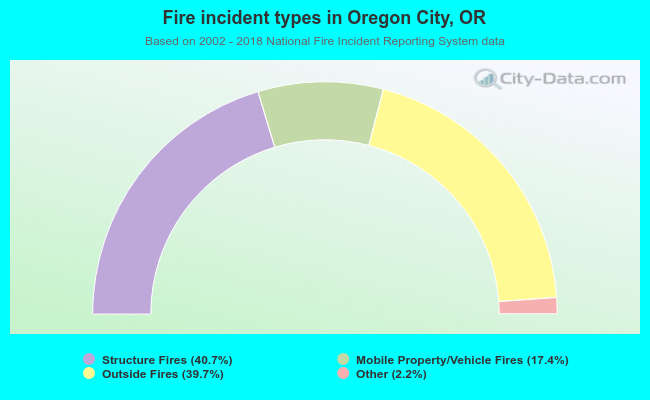 When looking into fire subcategories, the most incidents belonged to: Structure Fires (40.7%), and Outside Fires (39.7%).