Manor: Fire Incidents, Texas (TX)
Where are fire incidents reported in Manor, TX
Something went wrong! Please refresh the page.
|
| |||||||||||||||||||||||||||||||||||||||||||||||||||||||||||||||||||||||||||||||||||||||||||||||||||||||||||||
2002 - 2018 National Fire Incident Reporting System (NFIRS) incidents
- Incident types reported to NFIRS in Manor, TX
- 3,71352.8%Rescue & EMS
- 93613.3%Good Intent Call
- 80911.5%Fire
- 6719.5%Service Call
- 3975.6%Hazardous Condition
- 3224.6%False Alarm
- 1842.6%Special Incident
- Fire incident types reported to NFIRS in Manor, TX
- 47759.0%Outside Fires
- 18623.0%Structure Fires
- 10813.3%Mobile Property/Vehicle Fires
- 384.7%Other
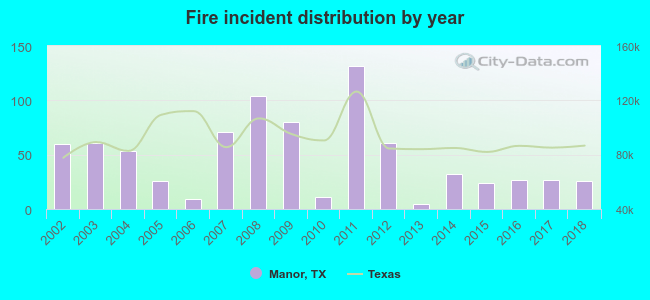 According to the data from the years 2002 - 2018 the average number of fire incidents per year is 48. The highest number of reported fires - 132 took place in 2011, and the least - 5 in 2013. The data has a decreasing trend.
The average number of yearly fire incidents per 10k residents in Manor, TX compared to nearest cities:
(Note: Based on data for the last 3 years, including only cities with population 5,000 and above)
| Manor: | 38.5 |
| Pflugerville: | 20.1 |
| Elgin: | 13.1 |
| Austin: | 17.6 |
| Round Rock: | 17.3 |
| Hutto: | 42.8 |
| Jollyville: | 0.6 |
| Taylor: | 46.1 |
| Cedar Park: | 18.8 |
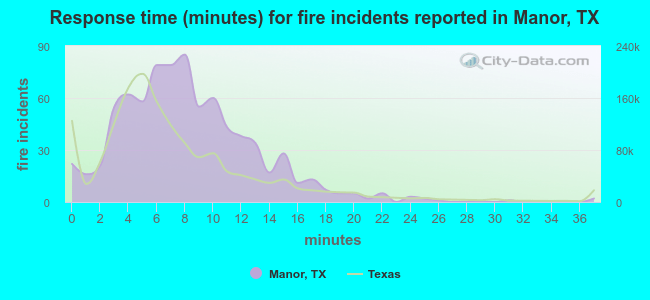 The median response time based on all reported fire incidents is 8 minutes. This is higher than the Texas median value.
The median response time in Manor, TX compared to nearest cities:
(Note: Based on data for all years, including only cities with at least 500 fire incidents)
| Manor: | 8 minutes |
| Pflugerville: | 7 minutes |
| Austin: | 5 minutes |
| Round Rock: | 5 minutes |
| Hutto: | 8 minutes |
| Taylor: | 7 minutes |
| Cedar Park: | 6 minutes |
| Bastrop: | 7 minutes |
| Georgetown: | 7 minutes |
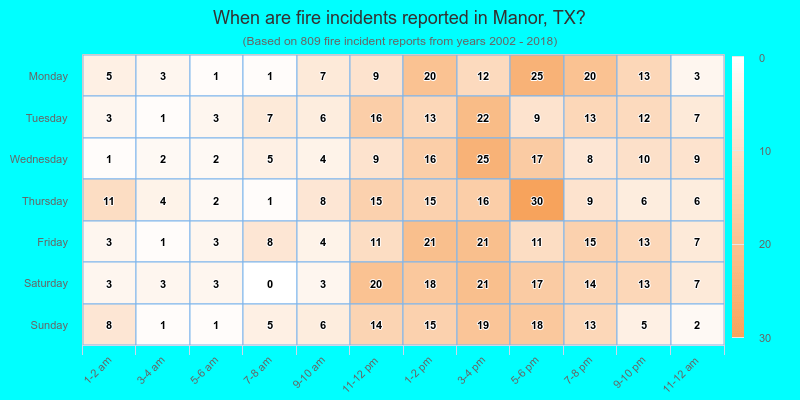
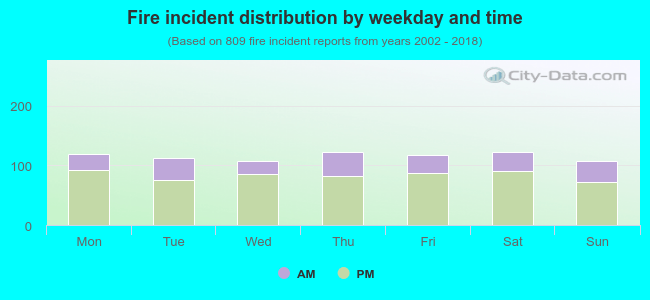 27.6% incidents where reported in the morning and 72.4% in the evening. The most fires (15.2%) took place on Thursday, and the least (13.2%) on Sunday.
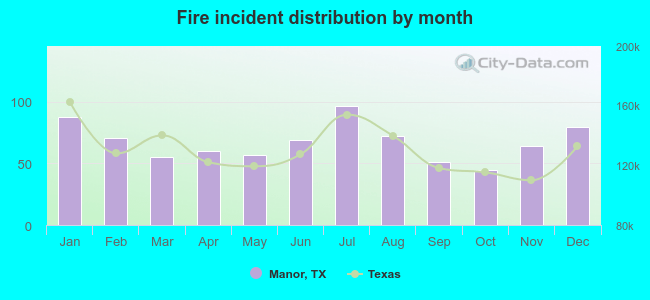 According to the 809 reports from years 2002 - 2018 most fires (12.0%) took place during July, and the least (5.6%) in October.
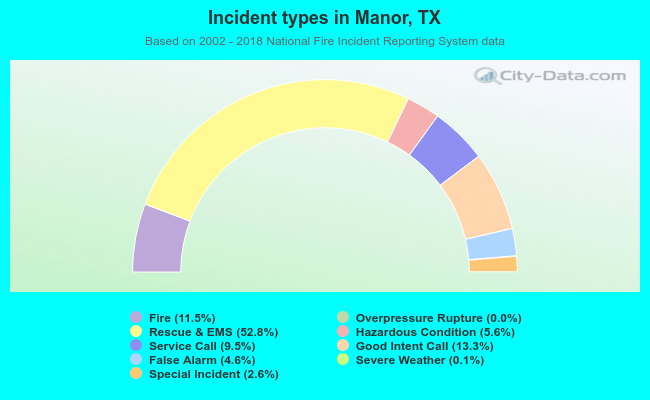 Out of all 7,038 cases reported during the years 2002 - 2018, the most belonged to the categories: Rescue & EMS (52.8%), Good Intent Call (13.3%), and Fire (11.5%).
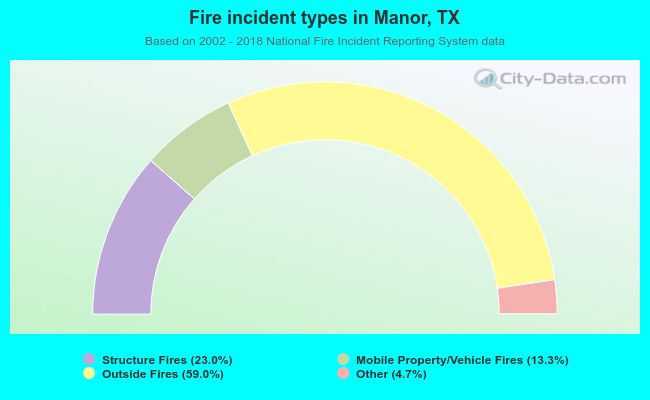 When looking into fire subcategories, the most incidents belonged to: Outside Fires (59.0%), and Structure Fires (23.0%).