Bastrop: Fire Incidents, Texas (TX)
Where are fire incidents reported in Bastrop, TX
Something went wrong! Please refresh the page.
| Fire incidents reported | |
|---|---|
| Sreet name | Count |
| 71 HWY | 176 |
| HWY 71 | 76 |
| HWY 95 | 58 |
| SH 71 HWY | 58 |
| 95 HWY | 50 |
| 21 HWY | 48 |
| SH 95 | 38 |
| CHESTNUT ST | 32 |
| HWY 21 | 32 |
| SH 71 | 32 |
| MAIN ST | 30 |
| SH 71 WEST | 30 |
| 71 | 28 |
| SHILOH RD | 28 |
| CHAMBERS | 26 |
| FM 969 | 26 |
| PINE TREE LOOP | 26 |
| WAUGH WAY | 26 |
| CHILDERS DR | 24 |
| FM 2336 | 24 |
| LOWER RED ROCK RD | 24 |
| FM 20 | 22 |
| HWY 21 EAST | 22 |
| PECAN ST | 22 |
| PORTER RD | 22 |
| CYNTHIA DR | 20 |
| LAURA LN | 20 |
| SAYERS RD | 20 |
| COOLWATER DR | 18 |
| FM 1441 | 18 |
| Other | 1,195 |
2002 - 2018 National Fire Incident Reporting System (NFIRS) incidents
- Incident types reported to NFIRS in Bastrop, TX
- 2,39422.9%Hazardous Condition
- 2,38422.8%Good Intent Call
- 2,27121.7%Fire
- 1,51514.5%Service Call
- 1,31312.6%Rescue & EMS
- 5205.0%False Alarm
- 260.2%Special Incident
- 120.1%Severe Weather
- Fire incident types reported to NFIRS in Bastrop, TX
- 1,27156.0%Outside Fires
- 59926.4%Structure Fires
- 35315.5%Mobile Property/Vehicle Fires
- 482.1%Other
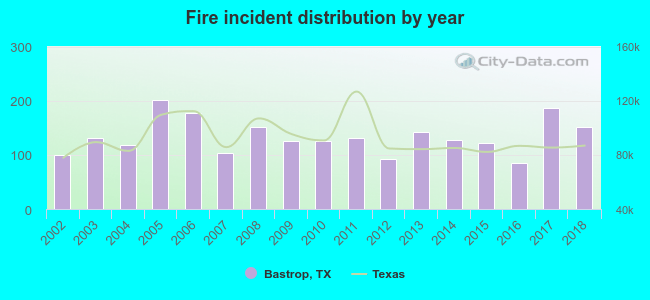 Based on the data from the years 2002 - 2018 the average number of fires per year is 134. The highest number of reported fire incidents - 201 took place in 2005, and the least - 86 in 2016. The data has a rising trend.
The average number of yearly fire incidents per 10k residents in Bastrop, TX compared to nearest cities:
(Note: Based on data for the last 3 years, including only cities with population 5,000 and above)
| Bastrop: | 180.3 |
| Elgin: | 13.1 |
| Manor: | 38.5 |
| Giddings: | 130.9 |
| Lockhart: | 41.1 |
| Austin: | 17.6 |
| Pflugerville: | 20.1 |
| Buda: | 87.3 |
| Taylor: | 46.1 |
 The median response time based on all reported fire incidents is 7 minutes. This is comparable to the Texas median value.
The median response time in Bastrop, TX compared to nearest cities:
(Note: Based on data for all years, including only cities with at least 500 fire incidents)
| Bastrop: | 7 minutes |
| Smithville: | 10 minutes |
| Manor: | 8 minutes |
| Giddings: | 5 minutes |
| Lockhart: | 5 minutes |
| Austin: | 5 minutes |
| Pflugerville: | 7 minutes |
| La Grange: | 10 minutes |
| Buda: | 6 minutes |
 According to the data from the years 2002 - 2018 the average number of fire-related yearly deaths is 0. The highest number of deaths - 2 took place in 2011, and the lowest - 0 in 2002. The data has an increasing trend.
 According to the reports from the years 2002 - 2018 the average number of fire-related yearly casualties is 1. The highest number of injuries - 5 took place in 2005, and the lowest - 0 in 2002. The data has a constant trend.
The average number of injuries per 1,000 fires is 7. This indicator was the highest - 26 in 2008, and the lowest 0 in 2002. The trend for casualties per 1,000 incidents is constant. Compared to the Texas value the number of casualties per 1,000 fires is similar.
According to the reports from the years 2002 - 2018 the average number of fire-related yearly casualties is 1. The highest number of injuries - 5 took place in 2005, and the lowest - 0 in 2002. The data has a constant trend.
The average number of injuries per 1,000 fires is 7. This indicator was the highest - 26 in 2008, and the lowest 0 in 2002. The trend for casualties per 1,000 incidents is constant. Compared to the Texas value the number of casualties per 1,000 fires is similar.Casualties per 1,000 incidents in Bastrop, TX compared to nearest cities:
(Note: Based on data for all years, including only cities with at least 500 fire incidents)
| Bastrop: | 8.8 |
| Smithville: | 6.0 |
| Manor: | 2.5 |
| Giddings: | 1.1 |
| Lockhart: | 19.9 |
| Austin: | 15.1 |
| Pflugerville: | 2.1 |
| La Grange: | 0.0 |
| Buda: | 1.6 |
 26.8% incidents where reported in the morning and 73.2% in the evening. The most fires (15.0%) took place on Thursday, and the least (12.9%) on Wednesday.
 Based on the 2,271 incident reports from years 2002 - 2018 most fires (11.5%) took place during July, and the least (5.8%) in November.
 Out of all 10,445 cases reported during the years 2002 - 2018, the most belonged to the categories: Hazardous Condition (22.9%), Good Intent Call (22.8%), and Fire (21.7%).
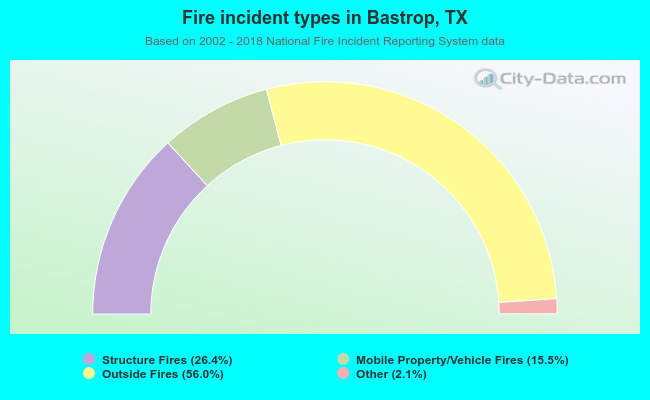 When looking into fire subcategories, the most reports belonged to: Outside Fires (56.0%), and Structure Fires (26.4%).