Ellettsville: Fire Incidents, Indiana (IN)
Where are fire incidents reported in Ellettsville, IN
Something went wrong! Please refresh the page.
|
| |||||||||||||||||||||||||||||||||||||||||||||||||||||||||||||||||||||||||||||||||||||||||||||||||||||||||||||
2002 - 2018 National Fire Incident Reporting System (NFIRS) incidents
- Incident types reported to NFIRS in Ellettsville, IN
- 1,17556.6%Rescue & EMS
- 51024.6%Fire
- 24511.8%Hazardous Condition
- 723.5%False Alarm
- 442.1%Service Call
- 211.0%Good Intent Call
- 40.2%Overpressure Rupture
- 30.1%Special Incident
- Fire incident types reported to NFIRS in Ellettsville, IN
- 26752.4%Outside Fires
- 16632.5%Structure Fires
- 479.2%Mobile Property/Vehicle Fires
- 305.9%Other
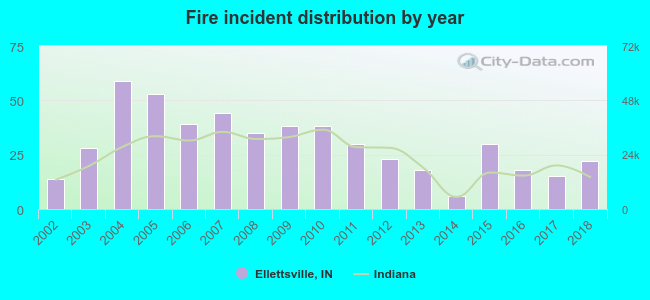 Based on the data from the years 2002 - 2018 the average number of fires per year is 30. The highest number of fire incidents - 59 took place in 2004, and the least - 6 in 2014. The data has a rising trend.
The average number of yearly fire incidents per 10k residents in Ellettsville, IN compared to nearest cities:
(Note: Based on data for the last 3 years, including only cities with population 5,000 and above)
| Ellettsville: | 28.3 |
| Bloomington: | 23.2 |
| Martinsville: | 76.9 |
| Bedford: | 44.7 |
| Mooresville: | 102.3 |
| Greencastle: | 44.4 |
| Bargersville: | 39.2 |
| Linton: | 11.3 |
| Brazil: | 33.3 |
 The median response time based on all reported fire incidents is 6 minutes. This is close to the state median value.
The median response time in Ellettsville, IN compared to nearest cities:
(Note: Based on data for all years, including only cities with at least 500 fire incidents)
| Ellettsville: | 6 minutes |
| Bloomington: | 5 minutes |
| Spencer: | 10 minutes |
| Martinsville: | 8 minutes |
| Nashville: | 12 minutes |
| Cloverdale: | 11 minutes |
| Bloomfield: | 10 minutes |
| Bedford: | 7 minutes |
| Mooresville: | 6 minutes |
 25.7% incidents where reported in the morning and 74.3% in the evening. The most fires (17.8%) took place on Saturday, and the least (10.6%) on Thursday.
 Based on the 510 fire incident reports from years 2002 - 2018 most fires (15.1%) took place during March, and the least (4.3%) in June.
 Out of all 2,075 cases reported during the years 2002 - 2018, the most belonged to the categories: Rescue & EMS (56.6%), Fire (24.6%), and Hazardous Condition (11.8%).
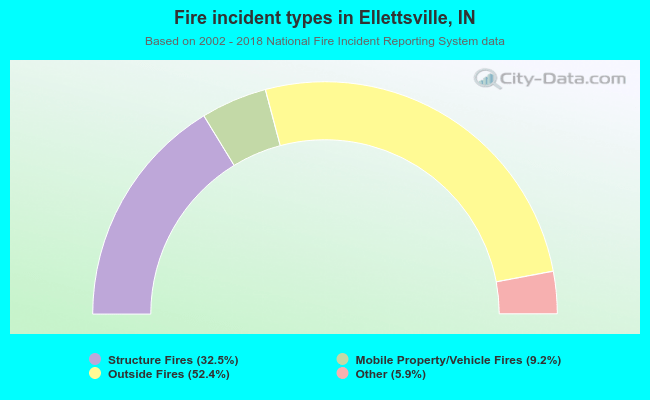 When looking into fire subcategories, the most incidents belonged to: Outside Fires (52.4%), and Structure Fires (32.5%).