Bedford: Fire Incidents, Indiana (IN)
Where are fire incidents reported in Bedford, IN
Something went wrong! Please refresh the page.
| Fire incidents reported | |
|---|---|
| Sreet name | Count |
| 16TH ST | 90 |
| STATE ROAD 158 | 68 |
| US 50 EAST HWY | 52 |
| TUNNELTON RD. | 50 |
| I ST | 38 |
| TUNNELTON RD | 38 |
| J ST | 36 |
| KNOB CREEK ROAD | 32 |
| OLD BUDDHA RD | 30 |
| OLD FARM ROAD | 28 |
| WASHINGTON AVENUE AVE | 28 |
| K ST | 26 |
| LEATHERWOOD RD | 26 |
| LEATHERWOOD RD. | 26 |
| O ST | 26 |
| Q ST | 26 |
| TRINTON CIRCLE | 26 |
| 15TH ST | 24 |
| 17TH ST | 24 |
| COXTON ROAD | 24 |
| H ST | 24 |
| PATTON HILL ROAD | 22 |
| SUNNY ACRES DRIVE. | 22 |
| WILLIAMS ROAD | 22 |
| 18TH ST | 20 |
| PEERLESS ROAD | 20 |
| PEERLESS ROAD RD | 20 |
| VINEGAR HILL RD. | 20 |
| 30TH ST | 18 |
| EAST OOLITIC ROAD. | 18 |
| Other | 1,157 |
2002 - 2017 National Fire Incident Reporting System (NFIRS) incidents
- Incident types reported to NFIRS in Bedford, IN
- 2,08130.3%Fire
- 1,68724.6%Rescue & EMS
- 1,49421.8%Hazardous Condition
- 87012.7%Good Intent Call
- 3635.3%Service Call
- 2954.3%False Alarm
- 280.4%Special Incident
- 270.4%Severe Weather
- 220.3%Overpressure Rupture
- Fire incident types reported to NFIRS in Bedford, IN
- 86441.5%Structure Fires
- 76636.8%Outside Fires
- 29214.0%Mobile Property/Vehicle Fires
- 1597.6%Other
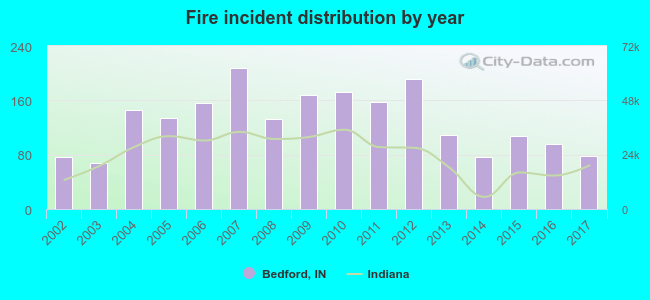 Based on the data from the years 2002 - 2017 the average number of fires per year is 130. The highest number of reported fires - 208 took place in 2007, and the least - 67 in 2003. The data has a rising trend.
The average number of yearly fire incidents per 10k residents in Bedford, IN compared to nearest cities:
(Note: Based on data for the last 3 years, including only cities with population 5,000 and above)
| Bedford: | 44.7 |
| Bloomington: | 23.2 |
| Ellettsville: | 28.3 |
| Salem: | 48.1 |
| Seymour: | 27.2 |
| Linton: | 11.3 |
| Martinsville: | 76.9 |
| Washington: | 48.3 |
| Columbus: | 37.4 |
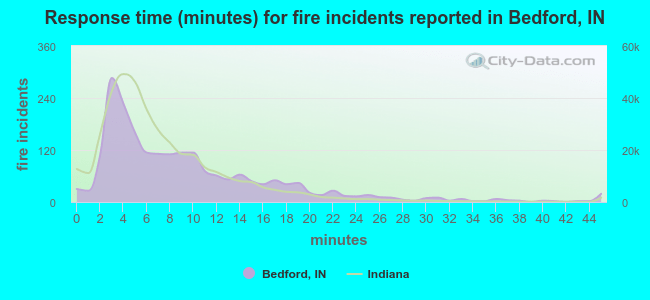 The median response time based on all reported fire incidents is 7 minutes. This is close to the state median value.
The median response time in Bedford, IN compared to nearest cities:
(Note: Based on data for all years, including only cities with at least 500 fire incidents)
| Bedford: | 7 minutes |
| Mitchell: | 10 minutes |
| Bloomington: | 5 minutes |
| Ellettsville: | 6 minutes |
| Bloomfield: | 10 minutes |
| Nashville: | 12 minutes |
| Salem: | 7 minutes |
| Spencer: | 10 minutes |
| Seymour: | 4 minutes |
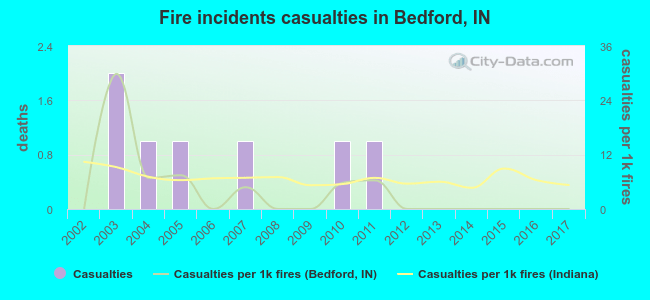 Based on the data from the years 2002 - 2017 the average number of fire-related yearly casualties is 0. The highest number of casualties - 2 took place in 2003, and the lowest - 0 in 2002. The data has a constant trend.
The average number of casualties per 1,000 fires is 4. This indicator was the highest - 30 in 2003, and the lowest 0 in 2002. The trend for injuries per 1,000 incidents is constant. Compared to the state value the number of casualties per 1,000 incidents is lower.
Based on the data from the years 2002 - 2017 the average number of fire-related yearly casualties is 0. The highest number of casualties - 2 took place in 2003, and the lowest - 0 in 2002. The data has a constant trend.
The average number of casualties per 1,000 fires is 4. This indicator was the highest - 30 in 2003, and the lowest 0 in 2002. The trend for injuries per 1,000 incidents is constant. Compared to the state value the number of casualties per 1,000 incidents is lower.Casualties per 1,000 incidents in Bedford, IN compared to nearest cities:
(Note: Based on data for all years, including only cities with at least 500 fire incidents)
| Bedford: | 3.4 |
| Mitchell: | 0.0 |
| Bloomington: | 4.7 |
| Ellettsville: | 2.0 |
| Bloomfield: | 1.7 |
| Nashville: | 4.3 |
| Salem: | 0.0 |
| Spencer: | 2.5 |
| Seymour: | 0.6 |
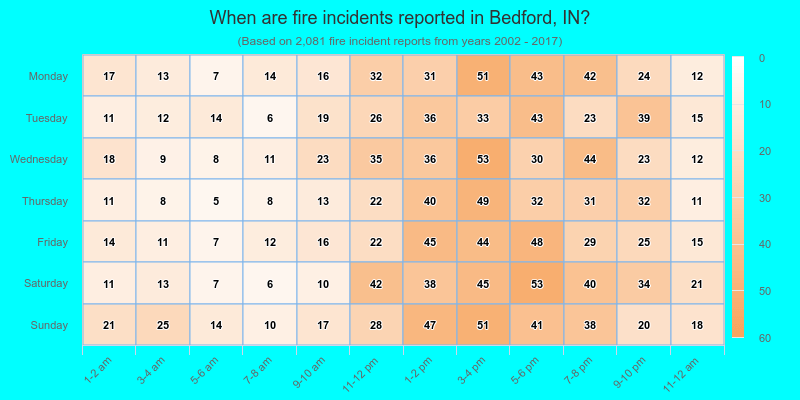
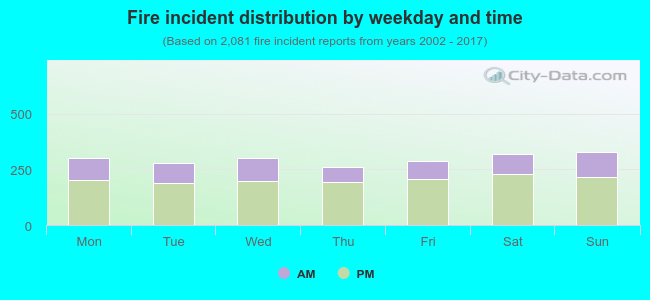 30.9% incidents where reported in the morning and 69.1% in the evening. The most fires (15.9%) took place on Sunday, and the least (12.6%) on Thursday.
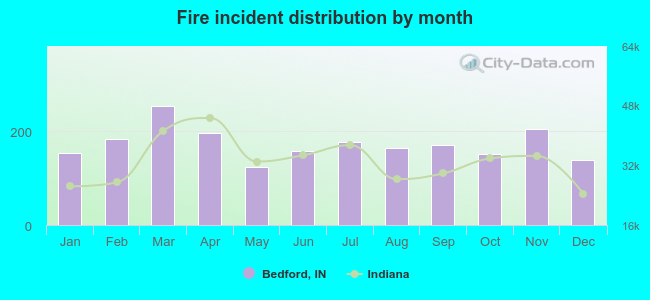 According to the 2,081 fire incidents from years 2002 - 2017 most fires (12.3%) took place during March, and the least (5.9%) in May.
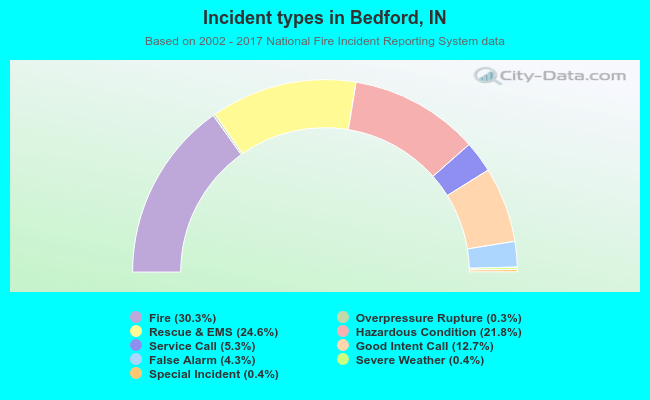 Out of all 6,867 cases reported during the years 2002 - 2017, the most belonged to the categories: Fire (30.3%), Rescue & EMS (24.6%), and Hazardous Condition (21.8%).
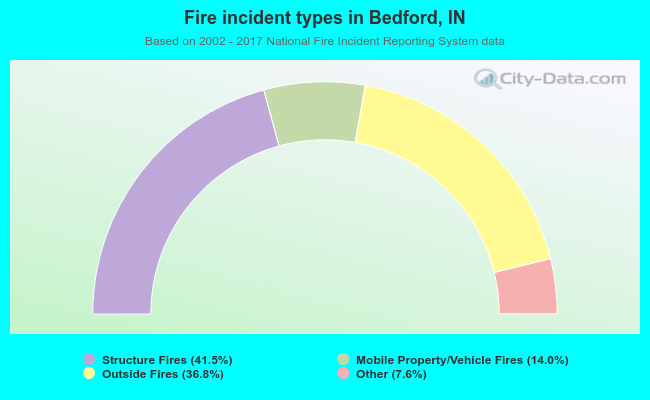 When looking into fire subcategories, the most incidents belonged to: Structure Fires (41.5%), and Outside Fires (36.8%).