Cottonwood: Fire Incidents, Arizona (AZ)
Where are fire incidents reported in Cottonwood, AZ
Something went wrong! Please refresh the page.
| Fire incidents reported | |
|---|---|
| Sreet name | Count |
| MAIN ST | 170 |
| MINGUS AVE | 126 |
| 6TH ST | 62 |
| 12TH ST | 54 |
| SR 89A | 52 |
| FIR ST | 48 |
| RODEO DR | 46 |
| COTTONWOOD ST | 42 |
| HWY 89A | 40 |
| CANDY LN | 28 |
| CAMINO REAL | 26 |
| SR 260 | 26 |
| 10TH ST | 24 |
| 11TH ST | 24 |
| 7TH ST | 22 |
| 89A HWY | 22 |
| BRIDLE PATH RD | 22 |
| HWY 260 | 22 |
| WILLARD ST | 22 |
| 16TH ST | 20 |
| THOUSAND TRAILS RD | 20 |
| VERDE HEIGHTS DR | 20 |
| 4TH ST | 18 |
| COMANCHE DR | 18 |
| GILA ST | 18 |
| MISSION LN | 18 |
| RIO MESA TRL | 18 |
| RIVERFRONT RD | 18 |
| BUTTE DR | 16 |
| CHERRY ST | 16 |
| Other | 156 |
2003 - 2018 National Fire Incident Reporting System (NFIRS) incidents
- Incident types reported to NFIRS in Cottonwood, AZ
- 12,39264.1%Rescue & EMS
- 2,60413.5%Service Call
- 1,4957.7%Good Intent Call
- 1,2346.4%Fire
- 8014.1%Hazardous Condition
- 7483.9%False Alarm
- 300.2%Special Incident
- Fire incident types reported to NFIRS in Cottonwood, AZ
- 51842.0%Outside Fires
- 50340.8%Structure Fires
- 17314.0%Mobile Property/Vehicle Fires
- 403.2%Other
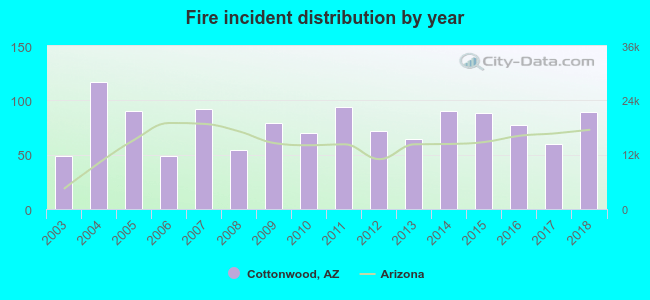 According to the data from the years 2003 - 2018 the average number of fire incidents per year is 77. The highest number of fire incidents - 117 took place in 2004, and the least - 49 in 2003. The data has a rising trend.
The average number of yearly fire incidents per 10k residents in Cottonwood, AZ compared to nearest cities:
(Note: Based on data for the last 3 years, including only cities with population 5,000 and above)
| Cottonwood: | 65.0 |
| Camp Verde: | 21.0 |
| Sedona: | 64.8 |
| Prescott Valley: | 27.4 |
| Chino Valley: | 15.4 |
| Prescott: | 20.8 |
| Paulden: | 3.8 |
| Flagstaff: | 34.7 |
| Coconino: | 0.1 |
 The median response time based on all reported fire incidents is 6 minutes. This is comparable to the Arizona median value.
The median response time in Cottonwood, AZ compared to nearest cities:
(Note: Based on data for all years, including only cities with at least 500 fire incidents)
| Cottonwood: | 6 minutes |
| Sedona: | 6 minutes |
| Prescott Valley: | 8 minutes |
| Prescott: | 6 minutes |
| Flagstaff: | 7 minutes |
| Payson: | 5 minutes |
 Based on the reports from the years 2003 - 2018 the average number of fire-related casualties per year is 1. The highest number of casualties - 2 took place in 2007, and the lowest - 0 in 2006. The data has a dropping trend.
The average number of casualties per 1,000 fire incidents is 6. This indicator was the highest - 23 in 2015, and the lowest 0 in 2006. The trend for injuries per 1,000 fire incidents is declining. Compared to the Arizona value the number of injuries per 1,000 incidents is higher.
Based on the reports from the years 2003 - 2018 the average number of fire-related casualties per year is 1. The highest number of casualties - 2 took place in 2007, and the lowest - 0 in 2006. The data has a dropping trend.
The average number of casualties per 1,000 fire incidents is 6. This indicator was the highest - 23 in 2015, and the lowest 0 in 2006. The trend for injuries per 1,000 fire incidents is declining. Compared to the Arizona value the number of injuries per 1,000 incidents is higher.Casualties per 1,000 incidents in Cottonwood, AZ compared to nearest cities:
(Note: Based on data for all years, including only cities with at least 500 fire incidents)
| Cottonwood: | 6.5 |
| Sedona: | 3.9 |
| Prescott Valley: | 0.9 |
| Prescott: | 0.0 |
| Flagstaff: | 9.0 |
| Payson: | 5.6 |
 34.0% incidents where reported in the morning and 66.0% in the evening. The most fires (15.9%) took place on Saturday, and the least (12.2%) on Wednesday.
 According to the 1,234 reports from years 2003 - 2018 most fires (12.6%) took place during May, and the least (4.3%) in September.
 Out of all 19,324 cases reported during the years 2003 - 2018, the most belonged to the categories: Rescue & EMS (64.1%), Service Call (13.5%), and Good Intent Call (7.7%).
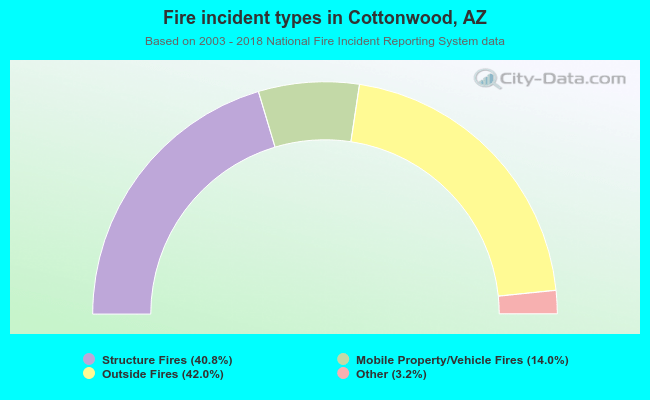 When looking into fire subcategories, the most incidents belonged to: Outside Fires (42.0%), and Structure Fires (40.8%).