Chino Valley: Fire Incidents, Arizona (AZ)
Where are fire incidents reported in Chino Valley, AZ
Something went wrong! Please refresh the page.
|
| |||||||||||||||||||||||||||||||||||||||||||||||||||||||||||||||||||||||||||||||||||||||||||||||||||||||||||||
2003 - 2018 National Fire Incident Reporting System (NFIRS) incidents
- Incident types reported to NFIRS in Chino Valley, AZ
- 4,40763.2%Rescue & EMS
- 1,14416.4%Service Call
- 5828.3%Good Intent Call
- 3465.0%Fire
- 2473.5%Hazardous Condition
- 2343.4%False Alarm
- Fire incident types reported to NFIRS in Chino Valley, AZ
- 13539.0%Outside Fires
- 12235.3%Structure Fires
- 6318.2%Mobile Property/Vehicle Fires
- 267.5%Other
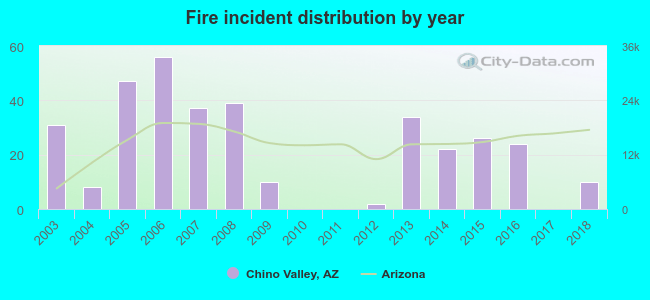 According to the data from the years 2003 - 2018 the average number of fire incidents per year is 22. The highest number of fire incidents - 56 took place in 2006, and the least - 0 in 2010. The data has a declining trend.
The average number of yearly fire incidents per 10k residents in Chino Valley, AZ compared to nearest cities:
(Note: Based on data for the last 3 years, including only cities with population 5,000 and above)
| Chino Valley: | 15.4 |
| Paulden: | 3.8 |
| Prescott Valley: | 27.4 |
| Prescott: | 20.8 |
| Cottonwood: | 65.0 |
| Camp Verde: | 21.0 |
| Sedona: | 64.8 |
| Flagstaff: | 34.7 |
| Wickenburg: | 41.4 |
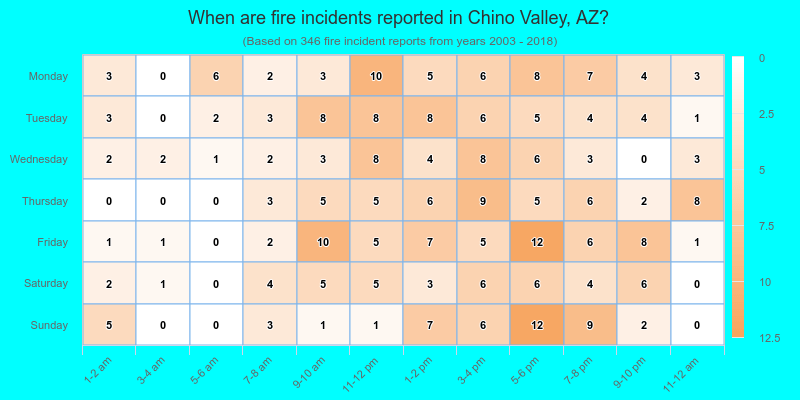
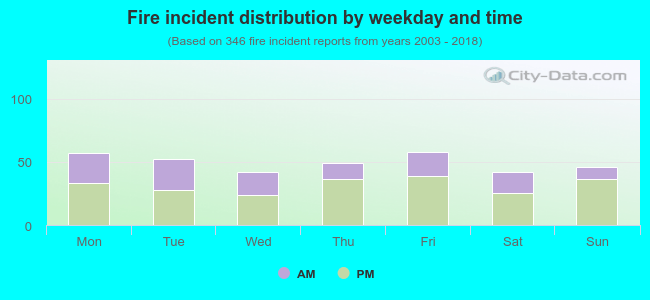 36.1% incidents where reported in the morning and 63.9% in the evening. The most fires (16.8%) took place on Friday, and the least (12.1%) on Wednesday.
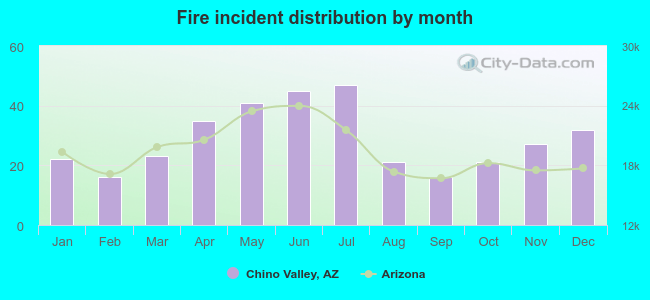 According to the 346 fire incidents from years 2003 - 2018 most fires (13.6%) took place during July, and the least (4.6%) in February.
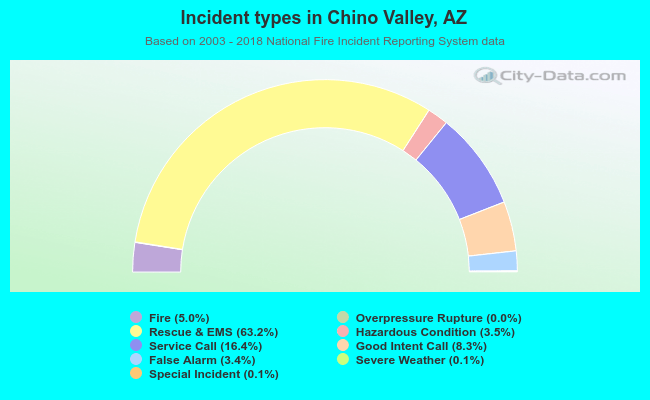 Out of all 6,973 cases reported during the years 2003 - 2018, the most belonged to the categories: Rescue & EMS (63.2%), Service Call (16.4%), and Good Intent Call (8.3%).
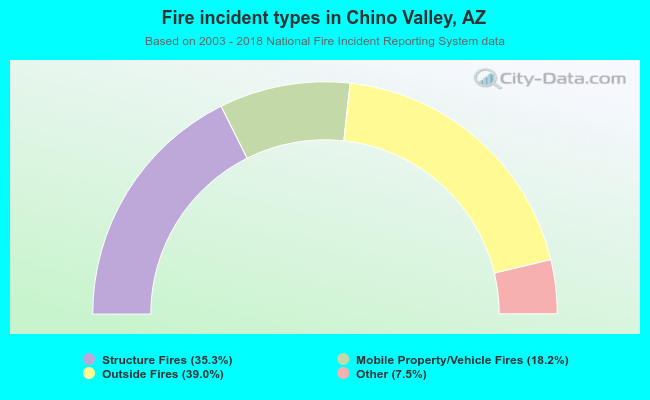 When looking into fire subcategories, the most incidents belonged to: Outside Fires (39.0%), and Structure Fires (35.3%).