Bel Air: Fire Incidents, Maryland (MD)
Where are fire incidents reported in Bel Air, MD
Something went wrong! Please refresh the page.
| Fire incidents reported | |
|---|---|
| Sreet name | Count |
| BEL AIR ROAD | 180 |
| CHURCHVILLE ROAD (RT.22) | 122 |
| CONOWINGO ROAD | 106 |
| BEL AIR SOUTH PKY | 64 |
| EMMORTON ROAD | 64 |
| SOUTH MAIN STREET | 64 |
| BEL AIR SOUTH PARKWAY | 60 |
| BEL AIR RD | 56 |
| CHURCHVILLE RD | 52 |
| SOUTH FOUNTAIN GREEN ROAD | 46 |
| ROCK SPRING ROAD | 40 |
| CONOWINGO RD | 38 |
| BEL AIR BYPASS | 36 |
| CALVARY RD | 36 |
| BOULTON STREET | 32 |
| MARKETPLACE DRIVE | 32 |
| NORTH FOUNTAIN GREEN ROAD | 32 |
| S MAIN ST | 30 |
| THOMAS RUN ROAD | 30 |
| WEST MACPHAIL ROAD | 30 |
| KALMIA RD | 28 |
| MOORES MILL ROAD | 28 |
| REDFIELD RD | 28 |
| VANGUARD WAY | 28 |
| PROSPECT MILL ROAD | 26 |
| RED PUMP ROAD | 26 |
| REDFIELD ROAD | 26 |
| S FOUNTAIN GREEN RD | 26 |
| BALTIMORE PIKE | 24 |
| LAUREL BUSH ROAD | 24 |
| Other | 1,672 |
2002 - 2018 National Fire Incident Reporting System (NFIRS) incidents
- Incident types reported to NFIRS in Bel Air, MD
- 24,54264.0%Rescue & EMS
- 4,50611.7%Good Intent Call
- 4,01910.5%Hazardous Condition
- 3,0868.0%Fire
- 1,5744.1%False Alarm
- 5061.3%Service Call
- 560.1%Overpressure Rupture
- 420.1%Severe Weather
- Fire incident types reported to NFIRS in Bel Air, MD
- 1,48748.2%Structure Fires
- 1,16637.8%Outside Fires
- 33310.8%Mobile Property/Vehicle Fires
- 1003.2%Other
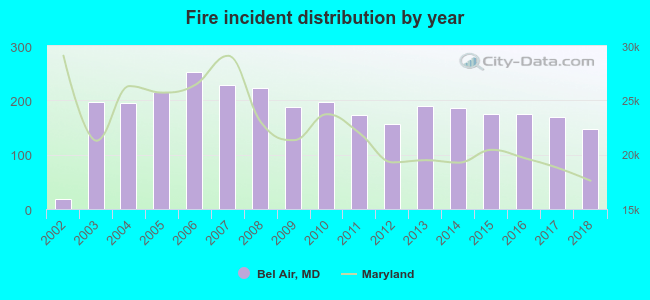 According to the data from the years 2002 - 2018 the average number of fire incidents per year is 182. The highest number of reported fires - 253 took place in 2006, and the least - 18 in 2002. The data has an increasing trend.
The average number of yearly fire incidents per 10k residents in Bel Air, MD compared to nearest cities:
(Note: Based on data for the last 3 years, including only cities with population 5,000 and above)
| Bel Air: | 159.8 |
| Fallston: | 44.7 |
| Edgewood: | 55.4 |
| Aberdeen: | 77.1 |
| Perry Hall: | 2.6 |
| White Marsh: | 31.9 |
| Havre de Grace: | 40.0 |
| Middle River: | 43.3 |
| Parkville: | 23.6 |
 The median response time based on all reported fire incidents is 7 minutes. This is about the same as the state median value.
The median response time in Bel Air, MD compared to nearest cities:
(Note: Based on data for all years, including only cities with at least 500 fire incidents)
| Bel Air: | 7 minutes |
| Fallston: | 8 minutes |
| Edgewood: | 6 minutes |
| Jarrettsville: | 9 minutes |
| Aberdeen: | 7 minutes |
| Darlington: | 10 minutes |
| Havre de Grace: | 1 minutes |
| Port Deposit: | 11 minutes |
| Middle River: | 5 minutes |
 Based on the reports from the years 2002 - 2018 the average number of fire-related yearly deaths is 0. The highest number of deaths - 2 took place in 2003, and the lowest - 0 in 2002. The data has a constant trend.
The average number of fatalities per 1,000 fire incidents is 2. This indicator was the highest - 11 in 2016, and the lowest 0 in 2002. The trend for fatalities per 1,000 fires is growing. Compared to the Maryland value the number of fatalities per 1,000 incidents is about the same.
Based on the reports from the years 2002 - 2018 the average number of fire-related yearly deaths is 0. The highest number of deaths - 2 took place in 2003, and the lowest - 0 in 2002. The data has a constant trend.
The average number of fatalities per 1,000 fire incidents is 2. This indicator was the highest - 11 in 2016, and the lowest 0 in 2002. The trend for fatalities per 1,000 fires is growing. Compared to the Maryland value the number of fatalities per 1,000 incidents is about the same.Deaths per 1,000 incidents in Bel Air, MD compared to nearest cities:
(Note: Based on data for all years, including only cities with at least 2,500 fire incidents)
| Bel Air: | 1.9 |
| Baltimore: | 4.2 |
| North East: | 0.4 |
 Based on the reports from the years 2002 - 2018 the average number of fire-related yearly casualties is 2. The highest number of reported injuries - 6 took place in 2017, and the lowest - 0 in 2002. The data has a constant trend.
The average number of casualties per 1,000 fires is 8. This indicator was the highest - 35 in 2017, and the lowest 0 in 2002. The trend for injuries per 1,000 incidents is constant. Compared to the state value the number of casualties per 1,000 fires is about the same.
Based on the reports from the years 2002 - 2018 the average number of fire-related yearly casualties is 2. The highest number of reported injuries - 6 took place in 2017, and the lowest - 0 in 2002. The data has a constant trend.
The average number of casualties per 1,000 fires is 8. This indicator was the highest - 35 in 2017, and the lowest 0 in 2002. The trend for injuries per 1,000 incidents is constant. Compared to the state value the number of casualties per 1,000 fires is about the same.Casualties per 1,000 incidents in Bel Air, MD compared to nearest cities:
(Note: Based on data for all years, including only cities with at least 500 fire incidents)
| Bel Air: | 8.4 |
| Fallston: | 1.1 |
| Edgewood: | 5.8 |
| Jarrettsville: | 3.2 |
| Aberdeen: | 8.3 |
| Darlington: | 0.0 |
| Havre de Grace: | 1.5 |
| Port Deposit: | 1.5 |
| Middle River: | 2.7 |
 27.9% incidents where reported in the morning and 72.1% in the evening. The most fires (15.5%) took place on Sunday, and the least (12.8%) on Tuesday.
 Based on the 3,086 fire incidents from years 2002 - 2018 most fires (11.9%) took place during April, and the least (5.4%) in September.
 Out of all 38,353 cases reported during the years 2002 - 2018, the most belonged to the categories: Rescue & EMS (64.0%), Good Intent Call (11.7%), and Hazardous Condition (10.5%).
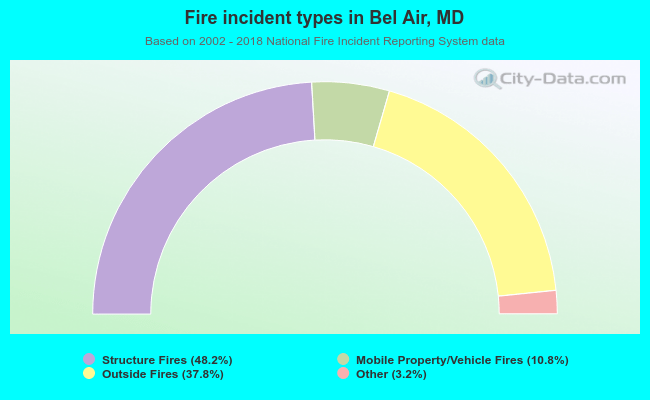 When looking into fire subcategories, the most reports belonged to: Structure Fires (48.2%), and Outside Fires (37.8%).