Baltimore: Fire Incidents, Maryland (MD)
Where are fire incidents reported in Baltimore, MD
Something went wrong! Please refresh the page.
| Fire incidents reported | |
|---|---|
| Sreet name | Count |
| CHARLES ST | 762 |
| NORTH AVE | 692 |
| BALTIMORE ST | 636 |
| PRATT ST | 494 |
| REISTERSTOWN RD | 484 |
| FAYETTE ST | 482 |
| EDMONDSON AVE | 454 |
| PARK HEIGHTS AVE | 452 |
| BELVEDERE AVE | 448 |
| PULASKI HWY | 438 |
| BELAIR RD | 436 |
| PATAPSCO AVE | 432 |
| EASTERN AVE | 410 |
| LOMBARD ST | 400 |
| HARFORD RD | 382 |
| FULTON AVE | 372 |
| COLD SPRING LN | 370 |
| DRUID HILL AVE | 364 |
| FREDERICK AVE | 348 |
| WASHINGTON BLVD | 342 |
| LANVALE ST | 340 |
| PENNSYLVANIA AVE | 336 |
| FRANKLIN ST | 318 |
| YORK RD | 318 |
| SINCLAIR LN | 308 |
| PRESTON ST | 300 |
| BROADWAY | 294 |
| LAFAYETTE AVE | 286 |
| LEXINGTON ST | 286 |
| MERRITT BLVD | 286 |
| Other | 25,114 |
2004 - 2018 National Fire Incident Reporting System (NFIRS) incidents
- Incident types reported to NFIRS in Baltimore, MD
- 351,42360.6%Rescue & EMS
- 61,27210.6%Good Intent Call
- 54,1149.3%Hazardous Condition
- 37,6516.5%False Alarm
- 37,3846.5%Fire
- 35,2316.1%Service Call
- 1,6000.3%Special Incident
- Fire incident types reported to NFIRS in Baltimore, MD
- 19,53952.3%Structure Fires
- 9,92726.6%Outside Fires
- 6,34117.0%Mobile Property/Vehicle Fires
- 1,5774.2%Other
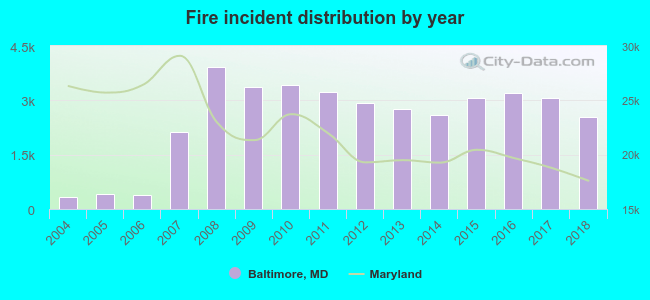 Based on the data from the years 2004 - 2018 the average number of fires per year is 2,492. The highest number of fire incidents - 3,927 took place in 2008, and the least - 341 in 2004. The data has a growing trend.
The average number of yearly fire incidents per 10k residents in Baltimore, MD compared to nearest cities:
(Note: Based on data for the last 3 years, including only cities with population 5,000 and above)
| Baltimore: | 47.1 |
| Lansdowne: | 2.4 |
| Brooklyn Park: | 5.3 |
| Rosedale: | 19.7 |
| Towson: | 13.6 |
| Arbutus: | 19.4 |
| Parkville: | 23.6 |
| Dundalk: | 13.6 |
| Pikesville: | 21.3 |
 The median response time based on all reported fire incidents is 6 minutes. This is close to the state median value.
The median response time in Baltimore, MD compared to nearest cities:
(Note: Based on data for all years, including only cities with at least 500 fire incidents)
| Baltimore: | 6 minutes |
| Towson: | 5 minutes |
| Arbutus: | 5 minutes |
| Parkville: | 5 minutes |
| Dundalk: | 5 minutes |
| Pikesville: | 5 minutes |
| Catonsville: | 5 minutes |
| Essex: | 5 minutes |
| Middle River: | 5 minutes |
 Based on the reports from the years 2004 - 2018 the average number of fire-related yearly deaths is 11. The highest number of reported deaths - 26 took place in 2009, and the lowest - 0 in 2004. The data has a rising trend.
The average number of deaths per 1,000 fire incidents is 3. This indicator was the highest - 8 in 2009, and the lowest 0 in 2004. The trend for deaths per 1,000 fires is growing. Compared to the Maryland value the number of deaths per 1,000 fire incidents is much higher.
Based on the reports from the years 2004 - 2018 the average number of fire-related yearly deaths is 11. The highest number of reported deaths - 26 took place in 2009, and the lowest - 0 in 2004. The data has a rising trend.
The average number of deaths per 1,000 fire incidents is 3. This indicator was the highest - 8 in 2009, and the lowest 0 in 2004. The trend for deaths per 1,000 fires is growing. Compared to the Maryland value the number of deaths per 1,000 fire incidents is much higher.Deaths per 1,000 incidents in Baltimore, MD compared to nearest cities:
(Note: Based on data for all years, including only cities with at least 2,500 fire incidents)
| Baltimore: | 4.2 |
| Glen Burnie: | 1.5 |
| Columbia: | 0.5 |
| Laurel: | 1.8 |
 Based on the reports from the years 2004 - 2018 the average number of fire-related yearly casualties is 29. The highest number of reported casualties - 66 took place in 2008, and the lowest - 2 in 2005. The data has a rising trend.
The average number of injuries per 1,000 fire incidents is 11. This indicator was the highest - 21 in 2004, and the lowest 4 in 2018. The trend for injuries per 1,000 incidents is dropping. Compared to the Maryland value the number of injuries per 1,000 fire incidents is higher.
Based on the reports from the years 2004 - 2018 the average number of fire-related yearly casualties is 29. The highest number of reported casualties - 66 took place in 2008, and the lowest - 2 in 2005. The data has a rising trend.
The average number of injuries per 1,000 fire incidents is 11. This indicator was the highest - 21 in 2004, and the lowest 4 in 2018. The trend for injuries per 1,000 incidents is dropping. Compared to the Maryland value the number of injuries per 1,000 fire incidents is higher.Casualties per 1,000 incidents in Baltimore, MD compared to nearest cities:
(Note: Based on data for all years, including only cities with at least 500 fire incidents)
| Baltimore: | 11.4 |
| Towson: | 2.9 |
| Arbutus: | 1.5 |
| Parkville: | 6.2 |
| Dundalk: | 6.0 |
| Pikesville: | 4.2 |
| Catonsville: | 3.5 |
| Essex: | 4.9 |
| Middle River: | 2.7 |
 33.9% incidents where reported in the morning and 66.1% in the evening. The most fires (15.2%) took place on Sunday, and the least (13.6%) on Tuesday.
 According to the 37,384 incident reports from years 2004 - 2018 most fires (9.4%) took place during April, and the least (6.6%) in February.
 Out of all 579,541 cases reported during the years 2004 - 2018, the most belonged to the categories: Rescue & EMS (60.6%), Good Intent Call (10.6%), and Hazardous Condition (9.3%).
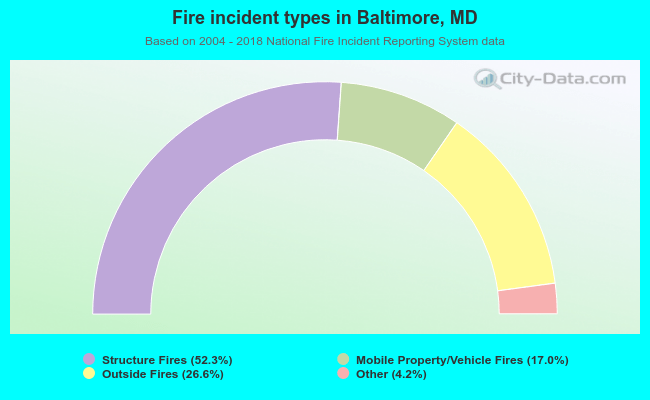 When looking into fire subcategories, the most reports belonged to: Structure Fires (52.3%), and Outside Fires (26.6%).