Estimated zip code population in 2022: 15,894 Zip code population in 2010: 15,740 Zip code population in 2000: 16,846
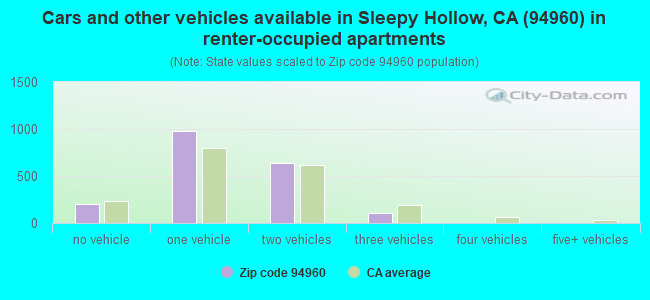
Houses and condos: 6,613 Renter-occupied apartments: 1,926
% of renters here:
31%
State:
44%
March 2022 cost of living index in zip code 94960: 131.1 (high, U.S. average is 100)
Land area: 5.9 sq. mi. Water area: 0.0 sq. mi.
Population density: 2,679 people per square mile
(average).
OSM Map
General Map
Google Map
MSN Map
OSM Map
General Map
Google Map
MSN Map
OSM Map
General Map
Google Map
MSN Map
OSM Map
General Map
Google Map
MSN Map
Please wait while loading the map...
Real estate property taxes paid for housing units in 2022:
This zip code:
0.6% ($10,292)
California:
0.7% ($4,831)
Median real estate property taxes paid for housing units with mortgages in 2022: $10,330 (0.6%) Median real estate property taxes paid for housing units with no mortgage in 2022: $8,478 (0.5%)
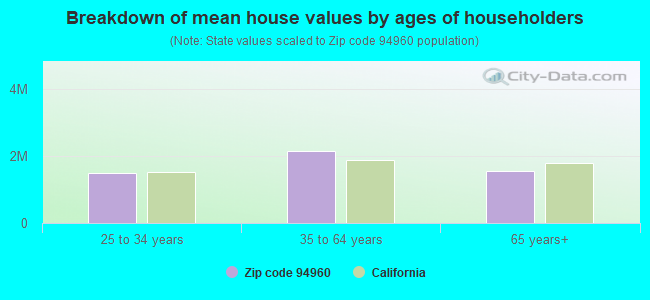
Estimated median house/condo value in 2022: $1,703,045
94960:
$1,703,045
California:
$715,900
According to our research of California and other state lists, there were 4 registered sex offenders living in 94960 zip code as of June 07, 2024. The ratio of all residents to sex offenders in zip code 94960 is 4,004 to 1. The ratio of registered sex offenders to all residents in this zip code is much lower than the state average.
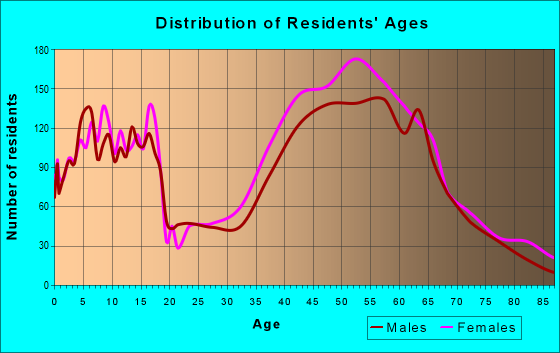
Median resident age:
This zip code:
46.8 years
California median age:
37.9 years
Average household size:
This zip code:
2.5 people
California:
2.8 people
Averages for the 2020 tax year for zip code 94960, filed in 2021:
Average Adjusted Gross Income (AGI) in 2020: $254,565 (Individual Income Tax Returns)
Here:
$254,565
State:
$95,910
Salary/wage: $180,672 (reported on 70.0% of returns)
Here:
$180,672
State:
$77,331
(% of AGI for various income ranges: 1186.8% for AGIs below $25k, 3756.0% for AGIs $25k-50k, 7037.9% for AGIs $50k-75k, 11966.8% for AGIs $75k-100k, 21232.5% for AGIs $100k-200k, 136811.3% for AGIs over 200k)
Taxable interest for individuals: $4,044 (reported on 58.3% of returns)
This zip code:
$4,044
California:
$2,294
(% of AGI for various income ranges: 57.7% for AGIs below $25k, 139.3% for AGIs $25k-50k, 190.0% for AGIs $50k-75k, 312.7% for AGIs $75k-100k, 458.4% for AGIs $100k-200k, 2309.1% for AGIs over 200k)
Ordinary dividends: $16,395 (reported on 51.9% of returns)
Here:
$16,395
State:
$10,949
(% of AGI for various income ranges: 210.0% for AGIs below $25k, 387.1% for AGIs $25k-50k, 675.2% for AGIs $50k-75k, 965.9% for AGIs $75k-100k, 1995.9% for AGIs $100k-200k, 8157.9% for AGIs over 200k)
Net capital gain/loss in AGI: +$117,260 (reported on 48.5% of returns)
Here:
+$117,260
State:
+$49,306
(% of AGI for various income ranges: 77.1% for AGIs below $25k, 303.8% for AGIs $25k-50k, 597.3% for AGIs $50k-75k, 1240.5% for AGIs $75k-100k, 1853.6% for AGIs $100k-200k, 74684.9% for AGIs over 200k)
Profit/loss from business: +$44,074 (reported on 28.5% of returns)
Here:
+$44,074
State:
+$15,671
(% of AGI for various income ranges: 445.2% for AGIs below $25k, 988.4% for AGIs $25k-50k, 1168.5% for AGIs $50k-75k, 1555.9% for AGIs $75k-100k, 3833.6% for AGIs $100k-200k, 10429.8% for AGIs over 200k)
Taxable individual retirement arrangement distribution: $32,568 (reported on 14.2% of returns)
94960:
$32,568
California:
$23,505
(% of AGI for various income ranges: 115.0% for AGIs below $25k, 366.9% for AGIs $25k-50k, 511.2% for AGIs $50k-75k, 1153.6% for AGIs $75k-100k, 1678.2% for AGIs $100k-200k, 3312.8% for AGIs over 200k)
Self-employed (Keogh) retirement plans: $31,877 (reported on 5.9% of returns)
94960:
$31,877
California:
$30,163
(% of AGI for various income ranges: 53.6% for AGIs $25k-50k, 87.3% for AGIs $50k-75k, 110.0% for AGIs $75k-100k, 376.4% for AGIs $100k-200k, 2043.0% for AGIs over 200k)
Total itemized deductions: $49,966 (reported on 36.5% of returns)
Here:
$49,966
State:
$39,517
(% of AGI for various income ranges: 415.3% for AGIs below $25k, 939.1% for AGIs $25k-50k, 1545.8% for AGIs $50k-75k, 2315.5% for AGIs $75k-100k, 3858.2% for AGIs $100k-200k, 17699.4% for AGIs over 200k)
Charity contributions: $12,290 (reported on 30.0% of returns)
Here:
$12,290
State:
$12,598
(% of AGI for various income ranges: 14.5% for AGIs below $25k, 54.2% for AGIs $25k-50k, 111.2% for AGIs $50k-75k, 212.3% for AGIs $75k-100k, 410.5% for AGIs $100k-200k, 4401.1% for AGIs over 200k)
Taxes paid: $9,370 (reported on 36.4% of returns)
94960:
$9,370
State:
$8,807
(% of AGI for various income ranges: 95.5% for AGIs below $25k, 232.9% for AGIs $25k-50k, 337.0% for AGIs $50k-75k, 635.0% for AGIs $75k-100k, 1064.5% for AGIs $100k-200k, 2760.0% for AGIs over 200k)
Earned income credit: $1,418 (reported on 3.9% of returns)
Here:
$1,418
State:
$2,074
(% of AGI for various income ranges: 43.9% for AGIs below $25k, 27.8% for AGIs $25k-50k)
Percentage of individuals using paid preparers for their 2020 taxes: 92.7%
Here:
93%
State:
92%
(% for various income ranges: 89.2% for AGIs below $25k, 92.3% for AGIs $25k-50k, 91.2% for AGIs $50k-75k, 91.1% for AGIs $75k-100k, 93.2% for AGIs $100k-200k, 95.8% for AGIs over 200k)
Averages for the 2012 tax year for zip code 94960, filed in 2013:
Average Adjusted Gross Income (AGI) in 2012: $153,102 (Individual Income Tax Returns)
Here:
$153,102
State:
$72,726
Salary/wage: $113,310 (reported on 72.1% of returns)
Here:
$113,310
State:
$59,079
(% of AGI for various income ranges: 56.7% for AGIs below $25k, 56.0% for AGIs $25k-50k, 60.1% for AGIs $50k-75k, 59.5% for AGIs $75k-100k, 64.0% for AGIs $100k-200k, 49.1% for AGIs over 200k)
Taxable interest for individuals: $2,860 (reported on 56.9% of returns)
This zip code:
$2,860
California:
$2,146
(% of AGI for various income ranges: 3.6% for AGIs below $25k, 1.7% for AGIs $25k-50k, 1.5% for AGIs $50k-75k, 1.7% for AGIs $75k-100k, 1.4% for AGIs $100k-200k, 0.8% for AGIs over 200k)
Ordinary dividends: $12,822 (reported on 47.1% of returns)
Here:
$12,822
State:
$9,308
(% of AGI for various income ranges: 8.2% for AGIs below $25k, 4.9% for AGIs $25k-50k, 5.0% for AGIs $50k-75k, 4.3% for AGIs $75k-100k, 3.2% for AGIs $100k-200k, 3.9% for AGIs over 200k)
Net capital gain/loss in AGI: +$42,174 (reported on 42.9% of returns)
Here:
+$42,174
State:
+$30,460
(% of AGI for various income ranges: 3.0% for AGIs below $25k, 1.5% for AGIs $25k-50k, 1.8% for AGIs $50k-75k, 2.1% for AGIs $75k-100k, 2.5% for AGIs $100k-200k, 16.8% for AGIs over 200k)
Profit/loss from business: +$39,807 (reported on 30.5% of returns)
Here:
+$39,807
State:
+$17,064
(% of AGI for various income ranges: 21.7% for AGIs below $25k, 15.0% for AGIs $25k-50k, 12.0% for AGIs $50k-75k, 10.5% for AGIs $75k-100k, 10.6% for AGIs $100k-200k, 5.9% for AGIs over 200k)
Taxable individual retirement arrangement distribution: $23,594 (reported on 15.3% of returns)
94960:
$23,594
California:
$19,557
(% of AGI for various income ranges: 5.5% for AGIs below $25k, 4.5% for AGIs $25k-50k, 4.4% for AGIs $50k-75k, 6.0% for AGIs $75k-100k, 3.8% for AGIs $100k-200k, 1.3% for AGIs over 200k)
Self-employment retirement plans: $26,192 (reported on 5.6% of returns)
94960:
$26,192
California:
$24,530
(% of AGI for various income ranges: 1.3% for AGIs below $25k, 0.5% for AGIs $50k-75k, 0.7% for AGIs $75k-100k, 0.9% for AGIs $100k-200k, 1.1% for AGIs over 200k)
Total itemized deductions: $55,610 (23% of AGI, reported on 57.8% of returns)
Here:
$55,610
State:
$34,004
Here:
23.2% of AGI
State:
22.7% of AGI
(% of AGI for various income ranges: 30.6% for AGIs below $25k, 18.9% for AGIs $25k-50k, 20.5% for AGIs $50k-75k, 21.8% for AGIs $75k-100k, 23.3% for AGIs $100k-200k, 20.2% for AGIs over 200k)
Charity contributions: $4,184 (reported on 50.4% of returns)
Here:
$4,184
State:
$4,659
(% of AGI for various income ranges: 1.3% for AGIs below $25k, 1.2% for AGIs $25k-50k, 1.3% for AGIs $50k-75k, 1.3% for AGIs $75k-100k, 1.5% for AGIs $100k-200k, 1.4% for AGIs over 200k)
Taxes paid: $24,734 (reported on 57.7% of returns)
94960:
$24,734
State:
$14,448
(% of AGI for various income ranges: 7.8% for AGIs below $25k, 5.5% for AGIs $25k-50k, 6.6% for AGIs $50k-75k, 8.3% for AGIs $75k-100k, 9.9% for AGIs $100k-200k, 9.7% for AGIs over 200k)
Earned income credit: $1,188 (reported on 5.6% of returns)
Here:
$1,188
State:
$2,286
(% of AGI for various income ranges: 2.0% for AGIs below $25k, 0.2% for AGIs $25k-50k)
Percentage of individuals using paid preparers for their 2012 taxes: 62.9%
Here:
63%
State:
64%
(% for various income ranges: 51.1% for AGIs below $25k, 55.3% for AGIs $25k-50k, 60.5% for AGIs $50k-75k, 65.6% for AGIs $75k-100k, 68.2% for AGIs $100k-200k, 79.1% for AGIs over 200k)
Averages for the 2004 tax year for zip code 94960, filed in 2005:
Average Adjusted Gross Income (AGI) in 2004: $105,532 (Individual Income Tax Returns)
Here:
$105,532
State:
$58,600
Salary/wage: $83,524 (reported on 70.5% of returns)
Here:
$83,524
State:
$49,455
(% of AGI for various income ranges: 50.3% for AGIs $10k-25k, 63.5% for AGIs $25k-50k, 60.4% for AGIs $50k-75k, 64.1% for AGIs $75k-100k, 52.6% for AGIs over 100k)
Taxable interest for individuals: $3,241 (reported on 63.9% of returns)
This zip code:
$3,241
California:
$2,365
(% of AGI for various income ranges: 5.7% for AGIs $10k-25k, 3.0% for AGIs $25k-50k, 3.0% for AGIs $50k-75k, 2.2% for AGIs $75k-100k, 1.5% for AGIs over 100k)
Taxable dividends: $6,472 (reported on 52.8% of returns)
Here:
$6,472
State:
$4,746
(% of AGI for various income ranges: 6.4% for AGIs $10k-25k, 4.3% for AGIs $25k-50k, 4.0% for AGIs $50k-75k, 3.5% for AGIs $75k-100k, 2.8% for AGIs over 100k)
Net capital gain/loss: +$30,604 (reported on 46.1% of returns)
Here:
+$30,604
State:
+$23,418
(% of AGI for various income ranges: 2.1% for AGIs $10k-25k, 1.1% for AGIs $25k-50k, 1.9% for AGIs $50k-75k, 3.0% for AGIs $75k-100k, 16.4% for AGIs over 100k)
Profit/loss from business: +$34,046 (reported on 31.0% of returns)
Here:
+$34,046
State:
+$16,826
(% of AGI for various income ranges: 20.0% for AGIs $10k-25k, 12.1% for AGIs $25k-50k, 14.2% for AGIs $50k-75k, 14.0% for AGIs $75k-100k, 8.4% for AGIs over 100k)
IRA payment deduction: $3,389 (reported on 4.5% of returns)
94960:
$3,389
California:
$3,192
(% of AGI for various income ranges: 0.5% for AGIs $10k-25k, 0.5% for AGIs $25k-50k, 0.3% for AGIs $50k-75k, 0.3% for AGIs $75k-100k, 0.1% for AGIs over 100k)
Self-employed pension: $18,594 (reported on 7.0% of returns)
Here:
$18,594
California:
$17,688
(% of AGI for various income ranges: 0.4% for AGIs $10k-25k, 0.6% for AGIs $25k-50k, 1.1% for AGIs $50k-75k, 1.2% for AGIs $75k-100k, 1.3% for AGIs over 100k)
Total itemized deductions: $39,757 (23% of AGI, reported on 54.5% of returns)
Here:
$39,757
State:
$28,113
Here:
22.8% of AGI
State:
25.3% of AGI
(% of AGI for various income ranges: 28.6% for AGIs $10k-25k, 20.3% for AGIs $25k-50k, 23.1% for AGIs $50k-75k, 26.0% for AGIs $75k-100k, 18.9% for AGIs over 100k)
Charity contributions deductions: $3,701 (2% of AGI, reported on 49.5% of returns)
Here:
$3,701
State:
$3,923
Here:
2.1% of AGI
State:
3.3% of AGI
(% of AGI for various income ranges: 1.7% for AGIs $10k-25k, 1.5% for AGIs $25k-50k, 1.7% for AGIs $50k-75k, 1.9% for AGIs $75k-100k, 1.7% for AGIs over 100k)
Total tax: $22,147 (reported on 84.7% of returns)
94960:
$22,147
State:
$10,761
(% of AGI for various income ranges: 7.0% for AGIs $10k-25k, 9.6% for AGIs $25k-50k, 12.0% for AGIs $50k-75k, 11.6% for AGIs $75k-100k, 19.4% for AGIs over 100k)
Earned income credit: $1,009 (reported on 4.5% of returns)
Here:
$1,009
State:
$1,763
Percentage of individuals using paid preparers for their 2004 taxes: 65.0%
Here:
65%
State:
66%
(% for various income ranges: 57.9% for AGIs below $10k, 56.7% for AGIs $10k-25k, 56.4% for AGIs $25k-50k, 65.2% for AGIs $50k-75k, 71.4% for AGIs $75k-100k, 76.2% for AGIs over 100k)
Likely homosexual households (counted as self-reported same-sex unmarried-partner households)
Lesbian couples: 0.7% of all households
Gay men: 0.0% of all households
Household received Food Stamps/SNAP in the past 12 months: 171 Household did not receive Food Stamps/SNAP in the past 12 months: 5,921
Women who had a birth in the past 12 months: 151 (102 now married, 49 unmarried) Women who did not have a birth in the past 12 months: 3,164 (1,234 now married, 1,931 unmarried)
Housing units in zip code 94960 with a mortgage: 3,122 (530 second mortgage, 521 both second mortgage and home equity loan) Houses without a mortgage: 193
Median monthly owner costs for units with a mortgage: $3,876 Median monthly owner costs for units without a mortgage: $1,238
Residents with income below the poverty level in 2022:
This zip code:
4.0%
Whole state:
12.2%
Residents with income below 50% of the poverty level in 2022:
This zip code:
1.7%
Whole state:
6.2%
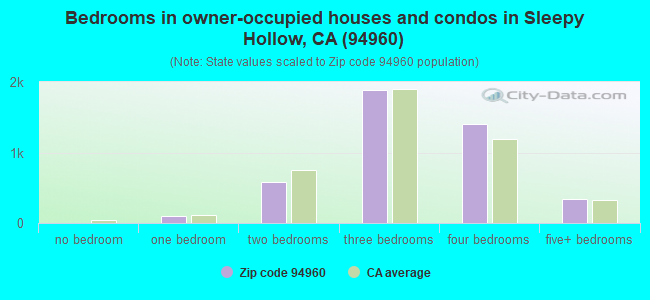
Median number of rooms in houses and condos:
Here:
6.9
State:
6.0
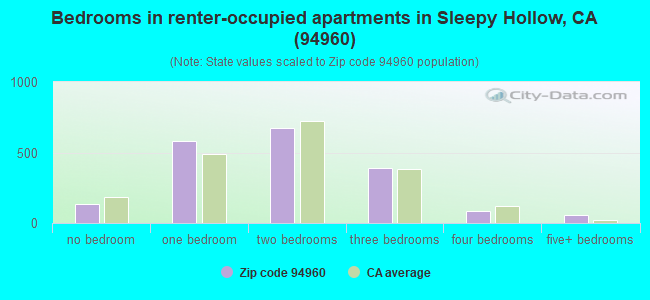
Median number of rooms in apartments:
Here:
4.2
State:
3.9
Notable locations in this zip code not listed on our city pages
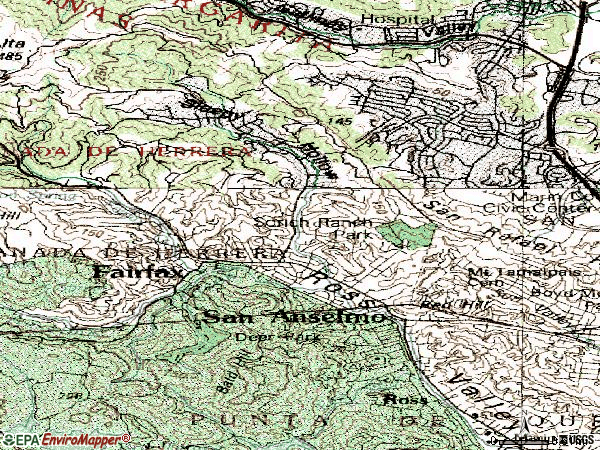
Notable locations in zip code 94960: Sunny Hills Orphanage (A), San Anselmo Public Library (B), Ross Town Hall (C), Robson House (D), San Anselmo Town Hall (E), Ross Valley Fire Department Station 20 (F), Ross Valley Fire Department Station 19 Headquarters (G), Ross Fire Department (H). Display/hide their locations on the map
Churches in zip code 94960 include: Saint Anselms Catholic Church (A), Church of the Nazarene (B), First Baptist Church (C), Montgomery Memorial Chapel (D), Saint Johns Episcopal Church (E), Saint Nicholas Orthodox Church (F). Display/hide their locations on the map
Parks in zip code 94960 include: Faude Park (1), Isabel Cook Recreation Center (2), Lonsdale Station Park (3), Oak Park (4), Robson Park (5), San Anselmo Memorial Park (6), Sorich Ranch Park (7). Display/hide their locations on the map
In group quarters: 196 (-1 institutionalized population)
Size of family households: 1,858 2-persons, 1,001 3-persons, 948 4-persons, 419 5-persons, 37 6-persons, 90 7-or-more-persons
Size of nonfamily households: 1,419 1-person, 413 2-persons, 37 3-persons
2,760 married couples with children.
746 single-parent households (223 men, 523 women).
92.5% of residents of 94960 zip code speak English at home.
2.4% of residents speak Spanish at home (95% very well, 5% well).
3.1% of residents speak other Indo-European language at home (87% very well, 13% well).
1.6% of residents speak Asian or Pacific Island language at home (49% very well, 32% well, 19% not well).
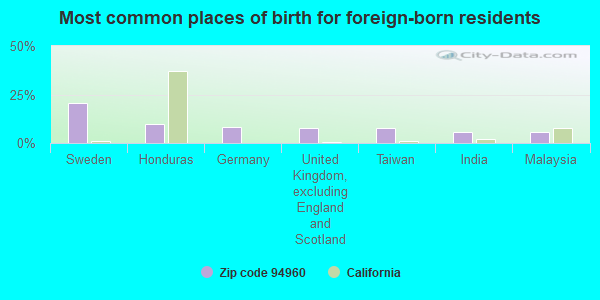
Foreign born population: 1,422 (8.9%) (55.8% of them are naturalized citizens)
This zip code:
8.9%
Whole state:
26.7%
21%Sweden
10%Honduras
8%Germany
8%United Kingdom, excluding England and Scotland
8%Taiwan
6%India
6%Malaysia
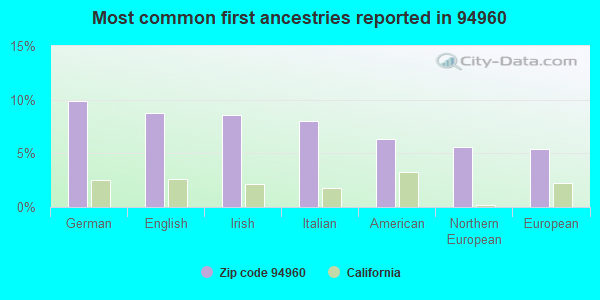
10%German
9%English
9%Irish
8%Italian
6%American
6%Northern European
5%European
Year of entry for the foreign-born population
5032010 or later
3162000 to 2009
2191990 to 1999
623Before 1990
Facilities with environmental interests located in this zip code:
M AND R CLEANERS (90 GREENFIELD AVENUE in SAN ANSELMO, CA)
CRITERIA AND HAZARDOUS AIR POLLUTANT INVENTORY (Inventory of air pollution sources) Small Quantity Generators, between 100 kg and 1000 kg of hazardous waste/month (Resource Conservation and Recovery Act (tracking hazardous waste)) Business SIC classification: DRYCLEANING PLANTS, EXCEPT RUG CLEANING Organizations: JA MIN KYUNG (CONTACT/OWNER)
ALEX'S DRY CLEANING AND VALET (754 SIR FRANCIS DRAKE BOULEVARD in SAN ANSELMO, CA)
CRITERIA AND HAZARDOUS AIR POLLUTANT INVENTORY (Inventory of air pollution sources) Small Quantity Generators, between 100 kg and 1000 kg of hazardous waste/month (Resource Conservation and Recovery Act (tracking hazardous waste)) - notification Business SIC classification: DRYCLEANING PLANTS, EXCEPT RUG CLEANING Organizations: NAJMA INTERNATIONAL CORPORATION (CONTACT/OWNER)
Alternative names: ONE HOUR MARTINIZING
NORTH BAY PHOTO LAB (580 RED HILL AVE in SAN ANSELMO, CA)
Small Quantity Generators, between 100 kg and 1000 kg of hazardous waste/month (Resource Conservation and Recovery Act (tracking hazardous waste)) - notification Organizations: RYGH CORPORATION (CONTACT/OWNER)
LYCEE FRANCAIS DE SAN FRANCISCO (100 SHAW DRIVE in SAN ANSELMO, CA)
COMPLIANCE ACTIVITY (Tracking inspections of insecticide, fungicide, and rodenticide, and toxic substances)
Housing units lacking complete plumbing facilities: 1.1% Housing units lacking complete kitchen facilities: 2.7%
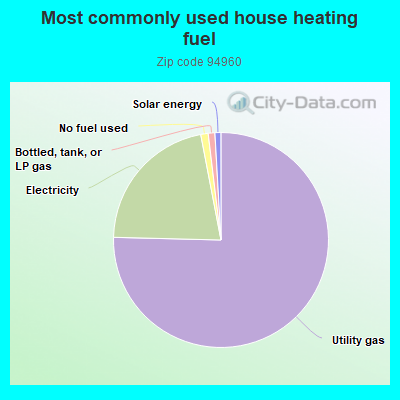
75.1%Utility gas
21.5%Electricity
1.1%No fuel used
1.0%Bottled, tank, or LP gas
0.9%Solar energy
Population in 1990: 15,178. Population change in the 1990s: +1,668 (+11.0%).
Place of birth for U.S.-born residents:
This state: 9,666
Northeast: 1,744
Midwest: 1,201
South: 859
West: 705
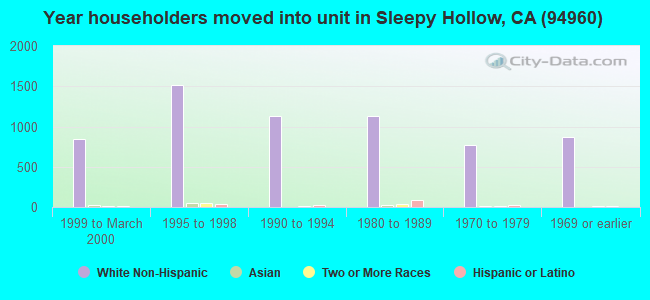
63% of the 94960 zip code residents lived in the same house 5 years ago. Out of people who lived in different houses, 49% lived in this county. Out of people who lived in different counties, 50% lived in California.
90% of the 94960 zip code residents lived in the same house 1 year ago. Out of people who lived in different houses, 45% moved from this county. Out of people who lived in different houses, 41% moved from different county within same state. Out of people who lived in different houses, 10% moved from different state. Out of people who lived in different houses, 4% moved from abroad.
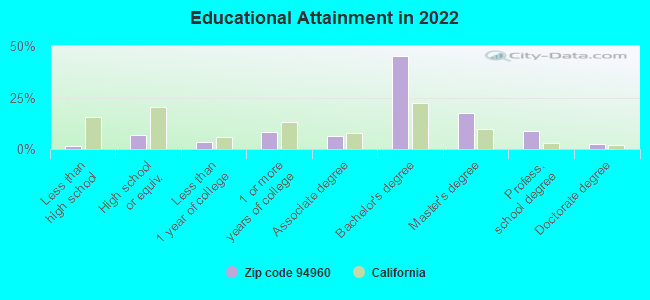
Private vs. public school enrollment:
Students in private schools in grades 1 to 8 (elementary and middle school): 288
Here:
15.7%
California:
10.5%
Students in private schools in grades 9 to 12 (high school): 189
Here:
20.4%
California:
8.5%
Students in private undergraduate colleges: 190
Here:
23.7%
California:
15.9%
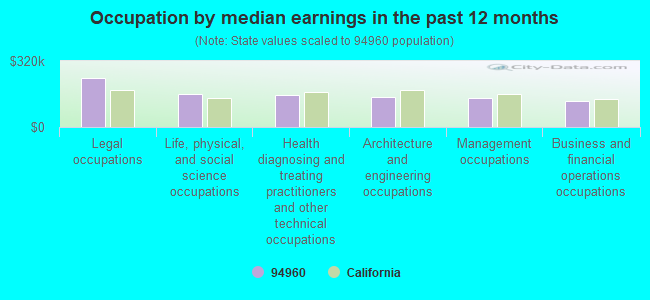
Occupation by median earnings in the past 12 months ($)
237,352Legal occupations
160,386Life, physical, and social science occupations
156,002Health diagnosing and treating practitioners and other technical occupations
143,590Architecture and engineering occupations
141,764Management occupations
126,477Business and financial operations occupations
Companies with federal contracts located in this zip code:
FORSTER & KROEGER (15 LIBRARY PL in SAN ANSELMO, CA; small business) : $627,170 in 6 contractsfrom 1999 to 2003
Contracts for Landscaping/Groundskeeping Services by U.S. Army Corps of Engineers - civil program financing only, Army Signed by year:2000: $33,250; 2001: $0; 2002: $284,470; 2003: $276,200; 2004: $0; 2005: $0; 2006: $0.
Biggest contracts:
$146,370 with U.S. Army Corps of Engineers - civil program financing only for Landscaping/Groundskeeping Services. Signed on 2002-03-04. Completion date: 2002-09-30.
$138,100 with Army for Landscaping/Groundskeeping Services. Signed on 2003-12-15. Completion date: 2004-09-30.
$138,100 with U.S. Army Corps of Engineers - civil program financing only for Landscaping/Groundskeeping Services. Signed on 2003-12-15. Completion date: 2004-09-30.
$138,100, same as above.Signed on 2002-11-18. Completion date: 2003-09-30.
ETRAC ENGINEERING, LLC (30 PROSPECT AVE in SAN ANSELMO, CA; small business) 100 employees, $0 revenue.
$23,557 with Army for Navigational Instruments. Taking place in MD. Signed on 2005-07-15. Completion date: 2005-08-09.
Top industries in this zip code by the number of employees in 2005:
2002 - 2018 National Fire Incident Reporting System (NFIRS) incidents
Based on the data from the years 2002 - 2018 the average number of fires per year is 24. The highest number of fires - 51 took place in 2006, and the least - 0 in 2004. The data has a growing trend.
When looking into fire subcategories, the most reports belonged to: Structure Fires (51.7%), and Outside Fires (32.4%).
Fire incident types reported to NFIRS in Zip Code 94960


 Nearest zip codes: 94903, 94957, 94904, 94973, 94930, 94939.
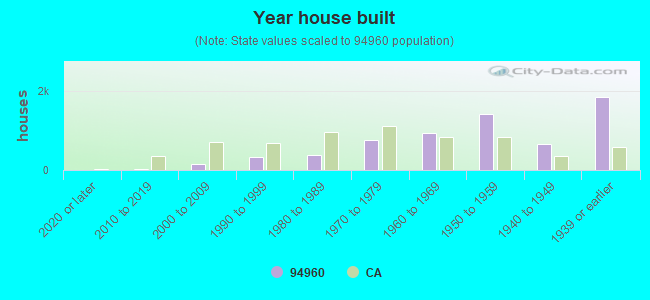


 Based on the data from the years 2002 - 2018 the average number of fires per year is 24. The highest number of fires - 51 took place in 2006, and the least - 0 in 2004. The data has a growing trend.
 When looking into fire subcategories, the most reports belonged to: Structure Fires (51.7%), and Outside Fires (32.4%).