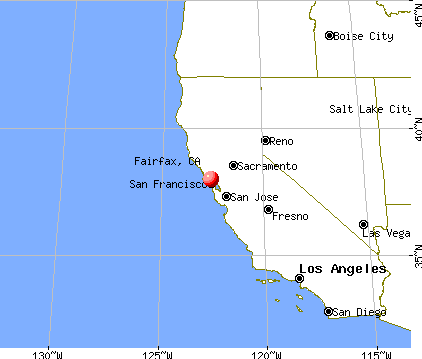
Fairfax, California
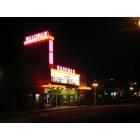
Fairfax: Fairfax Theater
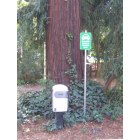
Fairfax: Fairfax Electric Vehicle Recharging Station
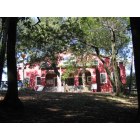
Fairfax: Looking out at Delano Grocery Store in Fairfax
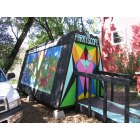
Fairfax: Artist-in-Residence created Walk-in Kaleidoscope
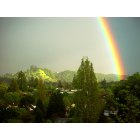
Fairfax: Afternoon shower looking east from Chester ave, Fairfax
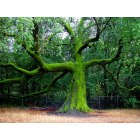
Fairfax: Deer Park School tree
Fairfax: Fairfax Pavilion
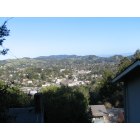
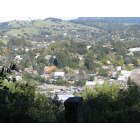
Fairfax: DownTown Fairfax from Scenic Rd.
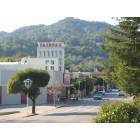
Fairfax: Downtown Fairfax
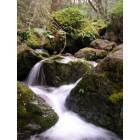
Fairfax: Waterfall at pristine Cascade Canyon in Fairfax
- add
your
Submit your own pictures of this town and show them to the world
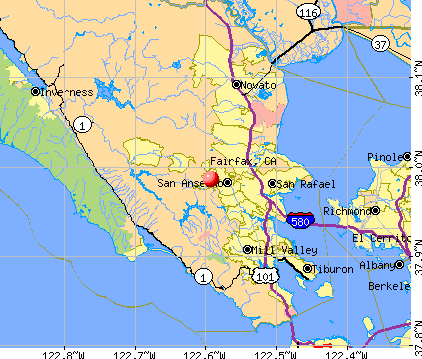
- OSM Map
- General Map
- Google Map
- MSN Map
Population change since 2000: +1.4%
 |
| Males: 3,486 | |
| Females: 3,937 |
| Median resident age: | 48.1 years |
| California median age: | 37.9 years |
| Fairfax: | $120,882 |
| CA: | $91,551 |
Estimated per capita income in 2022: $66,668 (it was $34,080 in 2000)
Fairfax town income, earnings, and wages data
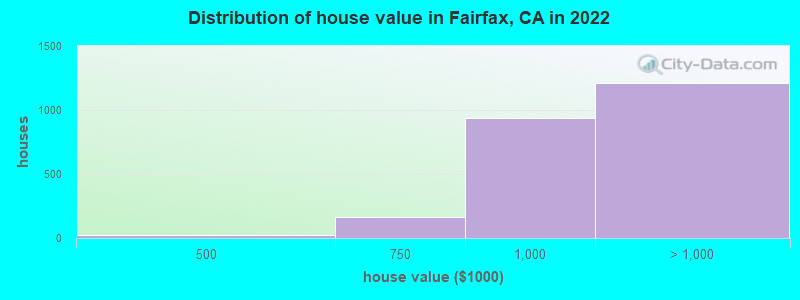
Estimated median house or condo value in 2022: over $1,000,000 (it was $418,000 in 2000)
| Fairfax: | over $1,000,000 |
| CA: | $715,900 |
Mean prices in 2022: all housing units: over $1,000,000; detached houses: over $1,000,000; townhouses or other attached units: $968,809; in 2-unit structures: over $1,000,000; in 3-to-4-unit structures: over $1,000,000
Median gross rent in 2022: $2,189.
(11.3% for White Non-Hispanic residents, 3.8% for Hispanic or Latino residents, 100.0% for American Indian residents, 9.6% for Native Hawaiian and other Pacific Islander residents, 4.5% for two or more races residents)
Detailed information about poverty and poor residents in Fairfax, CA


Compare current foreclosures near Fairfax, CA:
| Photo | Address | Area | Beds / Baths | Price | Details |
|---|---|---|---|---|---|

|
#1
Meernaa Ave
Fairfax, CA 94930
|
1,489 sq. feet
|
2 baths 3 beds |
show details | |

|
#2
Piper Ln
Fairfax, CA 94930
|
1,976 sq. feet
|
2 baths 4 beds |
show details | |

|
#3
Meernaa Ave # B
Fairfax, CA 94930
|
- sq. feet
|
- baths - beds |
show details | |

|
#4
Sir Francis Drake Blvd
Fairfax, CA 94930
|
- sq. feet
|
- baths - beds |
show details | |

|
#5
Sir Francis Drake Blvd
Fairfax, CA 94930
|
- sq. feet
|
- baths - beds |
show details | |

|
#6
2nd St
Richmond, CA 94801
|
887 sq. feet
|
1 baths 3 beds |
$349,900
|
show details |

|
#7
Thorndale Dr Apt 435
San Rafael, CA 94903
|
1,096 sq. feet
|
2 baths 2 beds |
$149,900
|
show details |

|
#8
Petaluma Blvd S Apt 28
Petaluma, CA 94952
|
565 sq. feet
|
1 baths 1 beds |
$359,900
|
show details |

|
#9
El Portal Dr Apt D
San Pablo, CA 94806
|
1,058 sq. feet
|
2 baths 2 beds |
show details | |

|
#10
21st St
San Pablo, CA 94806
|
1,665 sq. feet
|
2 baths 3 beds |
show details |
| Photo | Address | Area | Beds / Baths | Price | Details |
|---|---|---|---|---|---|

|
#11
Balboa St
San Francisco, CA 94118
|
2,410 sq. feet
|
1 baths 3 beds |
show details | |

|
#12
36th St
Richmond, CA 94805
|
1,116 sq. feet
|
1 baths 2 beds |
show details | |

|
#13
California Ave
San Pablo, CA 94806
|
805 sq. feet
|
1 baths 2 beds |
show details | |

|
#14
Warner Ct
San Rafael, CA 94901
|
1,664 sq. feet
|
2 baths 4 beds |
show details | |

|
#15
Harmon Rd
El Sobrante, CA 94803
|
1,031 sq. feet
|
1 baths 3 beds |
show details | |

|
#16
Rancho Rd
El Sobrante, CA 94803
|
1,644 sq. feet
|
2 baths 4 beds |
show details | |

|
#17
Sunny Cove Dr
Novato, CA 94949
|
2,568 sq. feet
|
2 baths 4 beds |
show details | |

|
#18
3rd St
San Rafael, CA 94901
|
1,304 sq. feet
|
1 baths 2 beds |
show details | |

|
#19
California Ave
Mill Valley, CA 94941
|
2,678 sq. feet
|
3 baths 3 beds |
show details | |

|
#20
Sequoia Valley Rd
Mill Valley, CA 94941
|
2,177 sq. feet
|
2 baths 3 beds |
show details |
| Photo | Address | Area | Beds / Baths | Price | Details |
|---|---|---|---|---|---|

|
#21
Greenwich St Apt 3
San Francisco, CA 94109
|
998 sq. feet
|
1 baths 1 beds |
show details | |

|
#22
Harris Hill Dr
Novato, CA 94947
|
2,773 sq. feet
|
3 baths 4 beds |
show details | |

|
#23
Orange Blossom Ln
San Rafael, CA 94903
|
1,892 sq. feet
|
2 baths 3 beds |
show details | |

|
#24
Eureka Ave
El Cerrito, CA 94530
|
1,700 sq. feet
|
2 baths 3 beds |
show details | |

|
#25
Olima St
Sausalito, CA 94965
|
- sq. feet
|
2 baths 4 beds |
show details | |

|
#26
Lincoln Ave
Richmond, CA 94804
|
795 sq. feet
|
1 baths 2 beds |
show details | |

|
#27
Ivy Lane
Woodacre, CA 94973
|
2,251 sq. feet
|
2 baths 3 beds |
show details | |

|
#28
Thorndale Dr Apt 206
San Rafael, CA 94903
|
660 sq. feet
|
1 baths 1 beds |
show details | |

|
#29
Crucero Ave
San Pablo, CA 94806
|
1,264 sq. feet
|
2 baths 3 beds |
show details | |

|
#30
Jo Ann Dr
San Pablo, CA 94806
|
1,120 sq. feet
|
2 baths 3 beds |
show details |
| Photo | Address | Area | Beds / Baths | Price | Details |
|---|---|---|---|---|---|

|
#31
S 41st St
Richmond, CA 94804
|
1,188 sq. feet
|
1 baths 4 beds |
show details | |

|
#32
Murphy Dr
San Pablo, CA 94806
|
1,160 sq. feet
|
2 baths 3 beds |
show details | |

|
#33
S 42nd St
Richmond, CA 94804
|
1,045 sq. feet
|
2 baths 3 beds |
show details | |

|
#34
Blackwood Ct
San Pablo, CA 94806
|
1,441 sq. feet
|
2 baths 4 beds |
show details | |

|
#35
33rd Ave
San Francisco, CA 94121
|
3,642 sq. feet
|
4 baths 3 beds |
show details | |

|
#36
Kenney Dr
San Pablo, CA 94806
|
1,188 sq. feet
|
2 baths 3 beds |
show details | |

|
#37
W Clay St
San Francisco, CA 94121
|
5,112 sq. feet
|
3 baths 8 beds |
show details | |

|
#38
Dundee Rd
San Pablo, CA 94806
|
1,680 sq. feet
|
3 baths 3 beds |
show details | |

|
#39
Ralston Ave
Richmond, CA 94805
|
2,240 sq. feet
|
2 baths 5 beds |
show details | |

|
#40
Draper St
San Pablo, CA 94806
|
1,454 sq. feet
|
2 baths 3 beds |
show details |
| Photo | Address | Area | Beds / Baths | Price | Details |
|---|---|---|---|---|---|

|
#41
Draper St
San Pablo, CA 94806
|
1,187 sq. feet
|
2 baths 3 beds |
show details | |

|
#42
Bell Ct
Richmond, CA 94804
|
1,281 sq. feet
|
1 baths 3 beds |
show details | |

|
#43
Parkside Dr
El Sobrante, CA 94803
|
1,421 sq. feet
|
2 baths 3 beds |
show details | |

|
#44
Doremus Ave
Richmond, CA 94805
|
1,781 sq. feet
|
2 baths 4 beds |
show details | |

|
#45
Jerilynn Ave
San Pablo, CA 94806
|
1,807 sq. feet
|
2 baths 3 beds |
show details | |

|
#46
Del Monte Dr
San Pablo, CA 94806
|
1,441 sq. feet
|
2 baths 4 beds |
show details | |

|
#47
Via Verdi
El Sobrante, CA 94803
|
815 sq. feet
|
1 baths 1 beds |
show details | |

|
#48
47th Ave
San Francisco, CA 94121
|
2,346 sq. feet
|
3 baths 4 beds |
show details | |

|
#49
Dursey Dr
Pinole, CA 94564
|
996 sq. feet
|
2 baths 2 beds |
show details | |

|
Check over 1 million property listings on Foreclosure.com!
|
browse all offers | |||


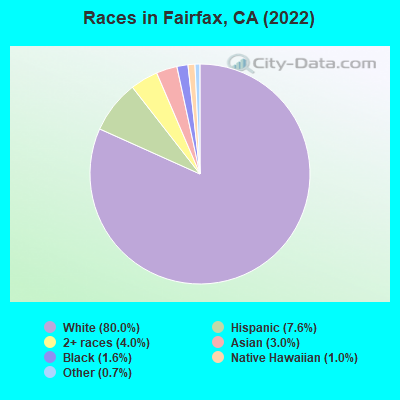
- 5,95180.0%White alone
- 5687.6%Hispanic
- 2994.0%Two or more races
- 2253.0%Asian alone
- 1201.6%Black alone
- 751.0%Native Hawaiian and Other
Pacific Islander alone - 540.7%Other race alone
- 70.09%American Indian alone
According to our research of California and other state lists, there were 3 registered sex offenders living in Fairfax, California as of May 17, 2024.
The ratio of all residents to sex offenders in Fairfax is 2,545 to 1.
The ratio of registered sex offenders to all residents in this city is much lower than the state average.
Type |
2009 |
2010 |
2011 |
2012 |
2013 |
2014 |
2015 |
2016 |
2017 |
2018 |
2019 |
2020 |
2022 |
|---|---|---|---|---|---|---|---|---|---|---|---|---|---|
| Murders (per 100,000) | 0 (0.0) | 0 (0.0) | 0 (0.0) | 0 (0.0) | 0 (0.0) | 0 (0.0) | 0 (0.0) | 0 (0.0) | 0 (0.0) | 0 (0.0) | 0 (0.0) | 0 (0.0) | 0 (0.0) |
| Rapes (per 100,000) | 2 (28.4) | 1 (13.4) | 1 (13.3) | 3 (39.5) | 3 (39.7) | 1 (13.1) | 6 (78.1) | 3 (39.2) | 0 (0.0) | 1 (13.1) | 3 (39.6) | 3 (39.8) | 3 (40.1) |
| Robberies (per 100,000) | 2 (28.4) | 2 (26.9) | 0 (0.0) | 0 (0.0) | 1 (13.2) | 1 (13.1) | 1 (13.0) | 4 (52.2) | 1 (13.1) | 1 (13.1) | 0 (0.0) | 0 (0.0) | 0 (0.0) |
| Assaults (per 100,000) | 13 (184.7) | 11 (147.8) | 22 (292.2) | 7 (92.2) | 9 (119.0) | 14 (183.1) | 6 (78.1) | 9 (117.5) | 3 (39.4) | 4 (52.5) | 6 (79.3) | 7 (93.0) | 8 (107.0) |
| Burglaries (per 100,000) | 35 (497.3) | 32 (430.0) | 27 (358.7) | 32 (421.6) | 30 (396.7) | 22 (287.7) | 19 (247.2) | 16 (208.8) | 10 (131.2) | 21 (275.6) | 13 (171.8) | 14 (185.9) | 4 (53.5) |
| Thefts (per 100,000) | 139 (1,975) | 83 (1,115) | 94 (1,249) | 93 (1,225) | 68 (899.1) | 74 (967.7) | 79 (1,028) | 113 (1,475) | 78 (1,023) | 90 (1,181) | 77 (1,017) | 79 (1,049) | 34 (454.7) |
| Auto thefts (per 100,000) | 4 (56.8) | 14 (188.1) | 2 (26.6) | 8 (105.4) | 6 (79.3) | 8 (104.6) | 6 (78.1) | 7 (91.4) | 6 (78.7) | 5 (65.6) | 2 (26.4) | 9 (119.5) | 5 (66.9) |
| Arson (per 100,000) | 6 (85.3) | 3 (40.3) | 0 (0.0) | 1 (13.2) | 1 (13.2) | 1 (13.1) | 1 (13.0) | 0 (0.0) | 2 (26.2) | 0 (0.0) | 0 (0.0) | 0 (0.0) | 0 (0.0) |
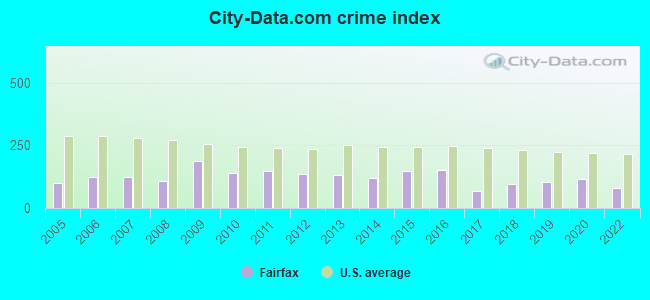
| City-Data.com crime index | 186.6 | 138.2 | 146.3 | 137.0 | 129.6 | 118.2 | 146.6 | 151.4 | 68.2 | 96.7 | 102.4 | 115.0 | 80.8 |
The City-Data.com crime index weighs serious crimes and violent crimes more heavily. Higher means more crime, U.S. average is 246.1. It adjusts for the number of visitors and daily workers commuting into cities.
Crime rate in Fairfax detailed stats: murders, rapes, robberies, assaults, burglaries, thefts, arson
Full-time law enforcement employees in 2021, including police officers: 16 (11 officers - 10 male; 1 female).
| Officers per 1,000 residents here: | 1.45 |
| California average: | 2.30 |
 Recent articles from our blog. Our writers, many of them Ph.D. graduates or candidates, create easy-to-read articles on a wide variety of topics.

 | Culver City Or Pico and Fairfax - Which Is A Safer Area? (6 replies) |
| K Line opened its first phase on October 10th (50 replies) |
| Relocation Sonoma Sebastopol vs Marin Fairfax for active early retirement? (4 replies) |
| Looking for an inexpensive hotel/motel in West L.A. (39 replies) |
| Best mexican food in Hollywood/Fairfax (13 replies) |
| Is Marin County very liberal? (99 replies) |
Latest news from Fairfax, CA collected exclusively by city-data.com from local newspapers, TV, and radio stations
Ancestries: English (9.1%), European (8.8%), Irish (7.2%), Italian (7.2%), German (4.4%), Norwegian (3.3%).
Current Local Time: PST time zone
Incorporated on 03/2/1931
Elevation: 120 feet
Land area: 2.13 square miles.
Population density: 3,490 people per square mile (average).
818 residents are foreign born (2.8% Latin America, 2.7% Asia, 2.3% Europe, 1.5% Africa).
| This town: | 11.0% |
| California: | 26.5% |
Median real estate property taxes paid for housing units with mortgages in 2022: $10,001 (0.8%)
Median real estate property taxes paid for housing units with no mortgage in 2022: $9,568 (0.9%)
Nearest city with pop. 50,000+: Ross Valley, CA (2.8 miles  , pop. 59,662).
Nearest city with pop. 200,000+: West Contra Costa, CA (15.0 miles , pop. 236,008).
Nearest city with pop. 1,000,000+: Los Angeles, CA (358.2 miles , pop. 3,694,820).
Nearest cities:
), ), ), ), ), )Latitude: 37.99 N, Longitude: 122.59 W
Daytime population change due to commuting: -754 (-10.1%)
Workers who live and work in this town: 1,969 (51.6%)
Area code commonly used in this area: 415

Fairfax, California accommodation & food services, waste management - Economy and Business Data
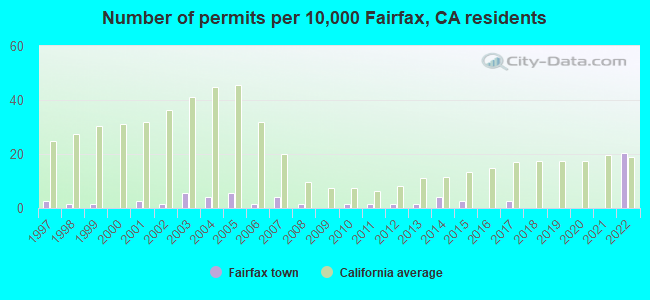
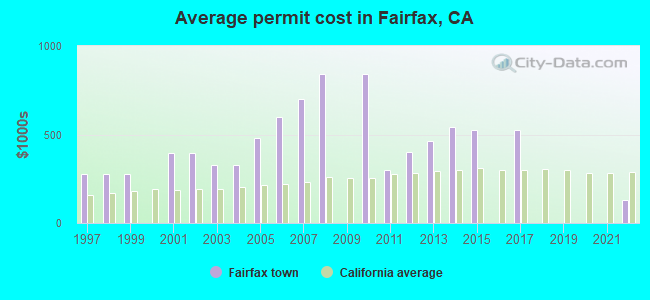
Single-family new house construction building permits:
- 2022: 15 buildings, average cost: $130,000
- 2017: 2 buildings, average cost: $525,000
- 2015: 2 buildings, average cost: $525,000
- 2014: 3 buildings, average cost: $543,300
- 2013: 1 building, cost: $465,000
- 2012: 1 building, cost: $400,000
- 2011: 1 building, cost: $300,000
- 2010: 1 building, cost: $840,000
- 2008: 1 building, cost: $840,000
- 2007: 3 buildings, average cost: $700,000
- 2006: 1 building, cost: $600,000
- 2005: 4 buildings, average cost: $481,900
- 2004: 3 buildings, average cost: $328,400
- 2003: 4 buildings, average cost: $328,400
- 2002: 1 building, cost: $395,000
- 2001: 2 buildings, average cost: $397,500
- 1999: 1 building, cost: $275,000
- 1998: 1 building, cost: $275,000
- 1997: 2 buildings, average cost: $275,000
| Here: | 3.7% |
| California: | 5.1% |

Population change in the 1990s: +236 (+3.3%).
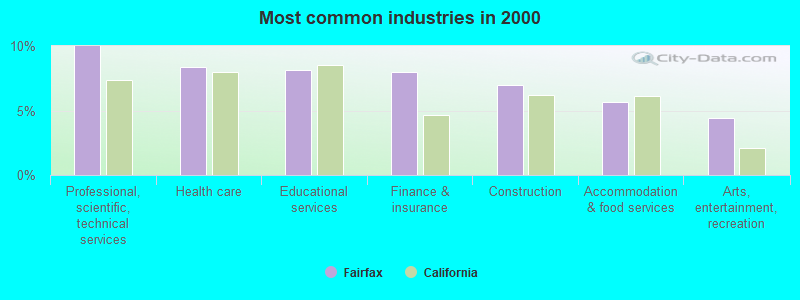
- Professional, scientific, technical services (10.0%)
- Health care (8.4%)
- Educational services (8.1%)
- Finance & insurance (8.0%)
- Construction (7.0%)
- Accommodation & food services (5.6%)
- Arts, entertainment, recreation (4.5%)
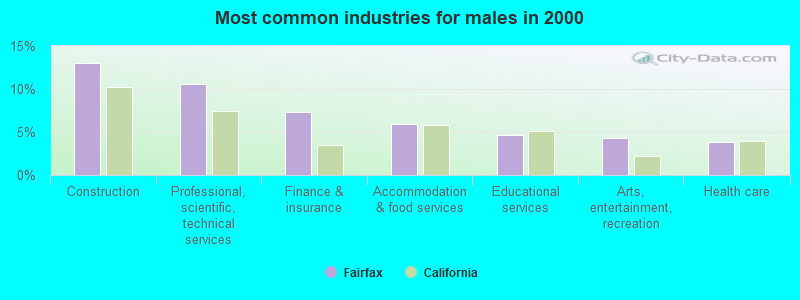
- Construction (13.0%)
- Professional, scientific, technical services (10.6%)
- Finance & insurance (7.3%)
- Accommodation & food services (5.9%)
- Educational services (4.7%)
- Arts, entertainment, recreation (4.3%)
- Health care (3.9%)
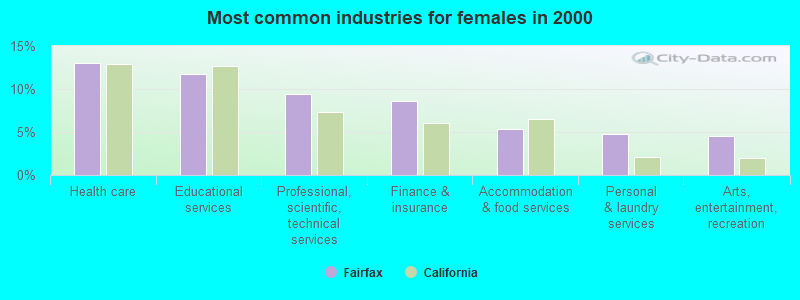
- Health care (13.0%)
- Educational services (11.7%)
- Professional, scientific, technical services (9.4%)
- Finance & insurance (8.6%)
- Accommodation & food services (5.4%)
- Personal & laundry services (4.7%)
- Arts, entertainment, recreation (4.6%)
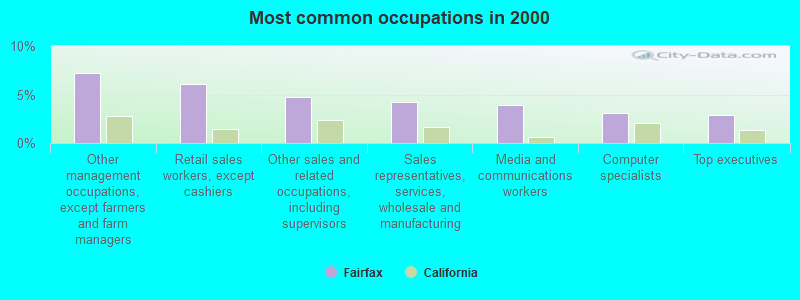
- Other management occupations, except farmers and farm managers (7.3%)
- Retail sales workers, except cashiers (6.1%)
- Other sales and related occupations, including supervisors (4.7%)
- Sales representatives, services, wholesale and manufacturing (4.2%)
- Media and communications workers (3.9%)
- Computer specialists (3.1%)
- Top executives (2.9%)
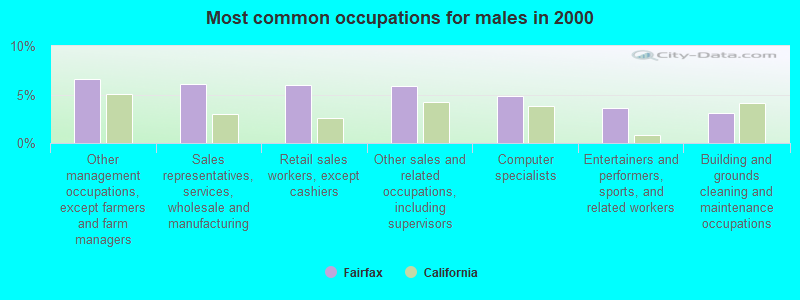
- Other management occupations, except farmers and farm managers (6.6%)
- Sales representatives, services, wholesale and manufacturing (6.1%)
- Retail sales workers, except cashiers (6.0%)
- Other sales and related occupations, including supervisors (5.8%)
- Computer specialists (4.8%)
- Entertainers and performers, sports, and related workers (3.6%)
- Building and grounds cleaning and maintenance occupations (3.1%)
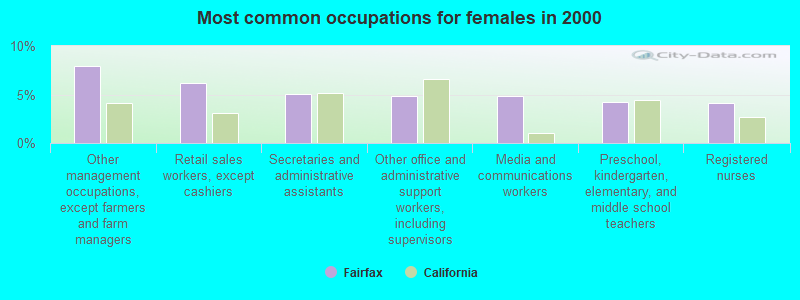
- Other management occupations, except farmers and farm managers (7.9%)
- Retail sales workers, except cashiers (6.2%)
- Secretaries and administrative assistants (5.0%)
- Other office and administrative support workers, including supervisors (4.8%)
- Media and communications workers (4.8%)
- Preschool, kindergarten, elementary, and middle school teachers (4.2%)
- Registered nurses (4.1%)
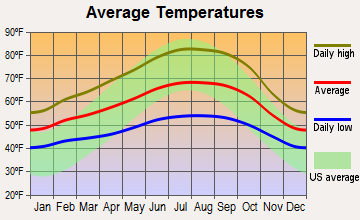
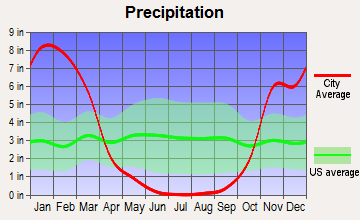
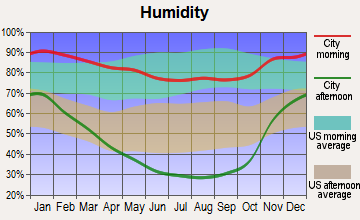
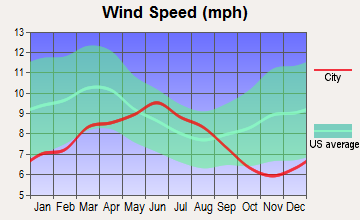
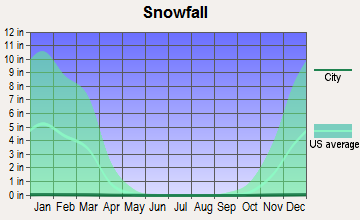
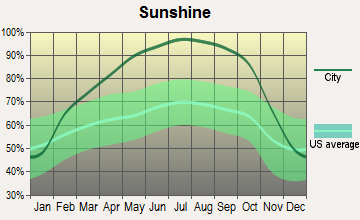
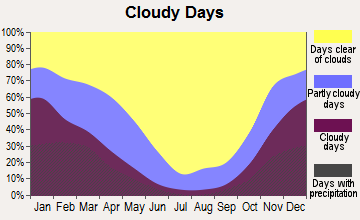
Average climate in Fairfax, California
Based on data reported by over 4,000 weather stations
|
|

(lower is better)
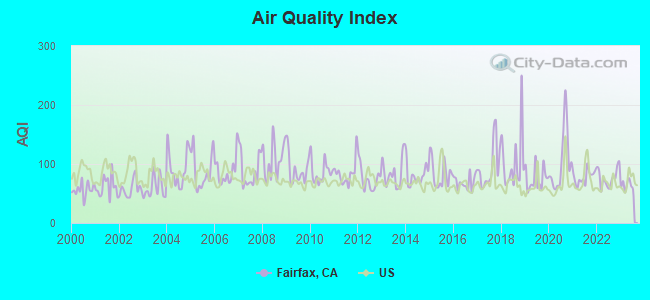
Air Quality Index (AQI) level in 2023 was 63.7. This is about average.
| City: | 63.7 |
| U.S.: | 72.6 |

Carbon Monoxide (CO) [ppm] level in 2023 was 0.274. This is about average. Closest monitor was 4.1 miles away from the city center.
| City: | 0.274 |
| U.S.: | 0.251 |
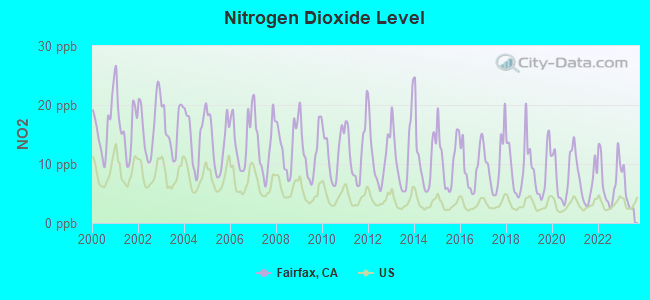
Nitrogen Dioxide (NO2) [ppb] level in 2023 was 4.98. This is about average. Closest monitor was 4.1 miles away from the city center.
| City: | 4.98 |
| U.S.: | 5.11 |
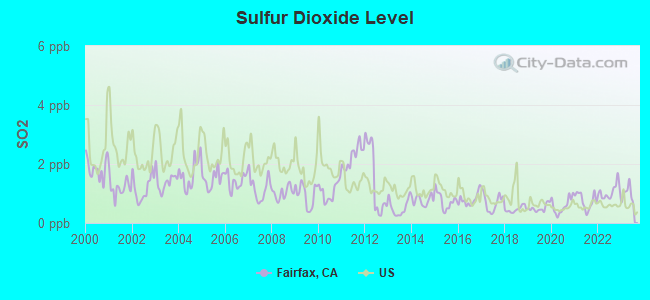
Sulfur Dioxide (SO2) [ppb] level in 2023 was 0.988. This is significantly better than average. Closest monitor was 12.0 miles away from the city center.
| City: | 0.988 |
| U.S.: | 1.515 |
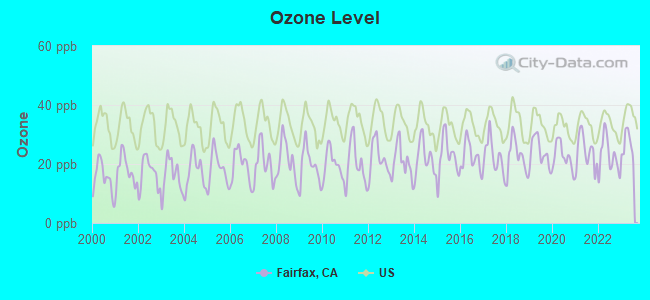
Ozone [ppb] level in 2023 was 26.6. This is better than average. Closest monitor was 4.1 miles away from the city center.
| City: | 26.6 |
| U.S.: | 33.3 |
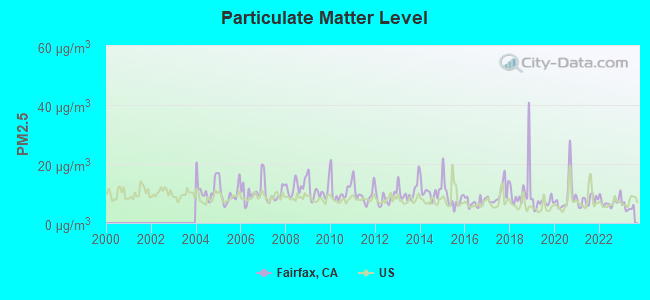
Particulate Matter (PM2.5) [µg/m3] level in 2023 was 5.32. This is significantly better than average. Closest monitor was 4.1 miles away from the city center.
| City: | 5.32 |
| U.S.: | 8.11 |
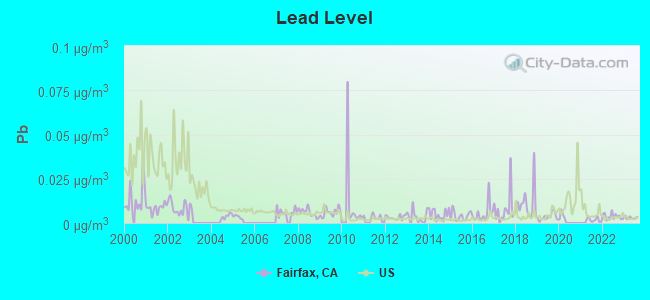
Lead (Pb) [µg/m3] level in 2023 was 0.00290. This is significantly better than average. Closest monitor was 13.1 miles away from the city center.
| City: | 0.00290 |
| U.S.: | 0.00931 |
Earthquake activity:
Fairfax-area historical earthquake activity is significantly above California state average. It is 7313% greater than the overall U.S. average.On 4/18/1906 at 13:12:21, a magnitude 7.9 (7.9 UK, Class: Major, Intensity: VIII - XII) earthquake occurred 22.2 miles away from the city center, causing $524,000,000 total damage
On 10/18/1989 at 00:04:15, a magnitude 7.1 (6.5 MB, 7.1 MS, 6.9 MW, 7.0 ML) earthquake occurred 75.5 miles away from the city center, causing 62 deaths (62 shaking deaths) and 3757 injuries, causing $1,305,032,704 total damage
On 1/31/1922 at 13:17:28, a magnitude 7.6 (7.6 UK) earthquake occurred 245.6 miles away from the city center
On 11/4/1927 at 13:51:53, a magnitude 7.5 (7.5 UK) earthquake occurred 229.5 miles away from Fairfax center
On 7/21/1952 at 11:52:14, a magnitude 7.7 (7.7 UK) earthquake occurred 287.3 miles away from Fairfax center, causing $50,000,000 total damage
On 4/25/1992 at 18:06:04, a magnitude 7.2 (6.3 MB, 7.1 MS, 7.2 MW, 7.1 MW, Depth: 9.4 mi) earthquake occurred 181.6 miles away from Fairfax center, causing $75,000,000 total damage
Magnitude types: body-wave magnitude (MB), local magnitude (ML), surface-wave magnitude (MS), moment magnitude (MW)
Natural disasters:
The number of natural disasters in Marin County (22) is greater than the US average (15).Major Disasters (Presidential) Declared: 15
Emergencies Declared: 2
Causes of natural disasters: Floods: 17, Storms: 9, Mudslides: 7, Winter Storms: 7, Landslides: 6, Drought: 1, Earthquake: 1, Freeze: 1, Heavy Rain: 1, Hurricane: 1, Tornado: 1, Other: 1 (Note: some incidents may be assigned to more than one category).

Hospitals and medical centers near Fairfax:
- ROSS GENERAL HOSPITAL (Nursing Home, about 2 miles away; ROSS, CA)
- KAISER FOUNDATION HOSPITAL Acute Care Hospitals (about 3 miles away; SAN RAFAEL, CA)
- DURAN DRIVE (Hospital, about 3 miles away; SAN RAFAEL, CA)
- NAZARETH HOUSE (Nursing Home, about 3 miles away; SAN RAFAEL, CA)
- VILLA MARIN (Nursing Home, about 3 miles away; SAN RAFAEL, CA)
- NORTHGATE DIALYSIS CENTER (Dialysis Facility, about 4 miles away; SAN RAFAEL, CA)
- KINDRED NURSING AND REHABILITATION-FIFTH AVENUE (Nursing Home, about 4 miles away; SAN RAFAEL, CA)
Amtrak stations near Fairfax:
- 14 miles: RICHMOND (16TH ST. & MACDONALD AVE.) . Services: fully wheelchair accessible, enclosed waiting area, public restrooms, public payphones, free short-term parking, call for taxi service, public transit connection.
- 16 miles: SAN FRANCISCO FISHERMANS (SAN FRANCISCO, PIER 39) - Bus Station . Services: fully wheelchair accessible, public payphones, full-service food facilities, paid short-term parking, paid long-term parking, call for taxi service, public transit connection.
- 18 miles: SAN FRANCISCO (31 THE EMBARCADERO) - Bus Station . Services: ticket office, fully wheelchair accessible, enclosed waiting area, public restrooms, public payphones, full-service food facilities, paid short-term parking, call for taxi service, public transit connection.
Colleges/universities with over 2000 students nearest to Fairfax:
- College of Marin (about 4 miles; Kentfield, CA; Full-time enrollment: 4,489)
- Contra Costa College (about 14 miles; San Pablo, CA; FT enrollment: 4,249)
- University of San Francisco (about 17 miles; San Francisco, CA; FT enrollment: 9,190)
- Academy of Art University (about 18 miles; San Francisco, CA; FT enrollment: 12,352)
- Berkeley City College (about 20 miles; Berkeley, CA; FT enrollment: 3,146)
- San Francisco State University (about 20 miles; San Francisco, CA; FT enrollment: 24,644)
- City College of San Francisco (about 20 miles; San Francisco, CA; FT enrollment: 17,569)
Public elementary/middle schools in Fairfax:
- WHITE HILL MIDDLE (Students: 555, Location: 101 GLEN DR., Grades: 6-8)
- MANOR ELEMENTARY (Students: 238, Location: 150 OAK MANOR DR., Grades: KG-5)
Private elementary/middle schools in Fairfax:
- ST RITA SCHOOL (Students: 172, Location: 102 MARINDA DR, Grades: PK-8)
- CASCADE CANYON SCHOOL (Students: 47, Location: 2626 SIR FRANCIS DRAKE BLVD, Grades: KG-8)
Points of interest:
Notable locations in Fairfax: Marin Town and Country Club (A), Fairfax Regional Branch Marin County Free Library (B), Saint Ritas Meeting Hall (C), Ross Valley Fire Department Station 21 (D). Display/hide their locations on the map
Churches in Fairfax include: Fairfax Community Church (A), Saint Ritas Roman Catholic Church (B), Seventh Day Adventist Church (C). Display/hide their locations on the map
Creeks: Bothin Creek (A), Carey Camp Creek (B), Deer Park Creek (C), Fairfax Creek (D). Display/hide their locations on the map
Parks in Fairfax include: Bolinas Park (1), Doc Edgar Park (2). Display/hide their locations on the map
Birthplace of: Heather Burge - Basketball player, Heidi Burge - Basketball player, Lonnie Mayne - Professional wrestler, Alex Pribble - College basketball player (California Golden Bears), Robert Peterson (poet) - Poet.
| This town: | 2.2 people |
| California: | 2.9 people |
| This town: | 55.5% |
| Whole state: | 68.7% |
| This town: | 9.4% |
| Whole state: | 7.2% |
Likely homosexual households (counted as self-reported same-sex unmarried-partner households)
- Lesbian couples: 0.9% of all households
- Gay men: 0.7% of all households
10 people in nursing facilities/skilled-nursing facilities in 2010
People in group quarters in Fairfax in 2000:
- 10 people in homes for the mentally ill
- 8 people in other noninstitutional group quarters
- 7 people in other nonhousehold living situations
- 5 people in homes for the mentally retarded
Banks with branches in Fairfax (2011 data):
- First Federal Savings and Loan Association of San Rafael: 2009 Sir Francis Drake Boulvard Bran at 2009 Sir Francis Drake Blvd, branch established on 1963/07/31. Info updated 2011/07/21: Bank assets: $168.5 mil, Deposits: $131.8 mil, headquarters in San Rafael, CA, positive income, Commercial Lending Specialization, 5 total offices
- Bank of America, National Association: Fairfax Branch at 89 Broadway, branch established on 1927/02/19. Info updated 2009/11/18: Bank assets: $1,451,969.3 mil, Deposits: $1,077,176.8 mil, headquarters in Charlotte, NC, positive income, 5782 total offices, Holding Company: Bank Of America Corporation
For population 15 years and over in Fairfax:
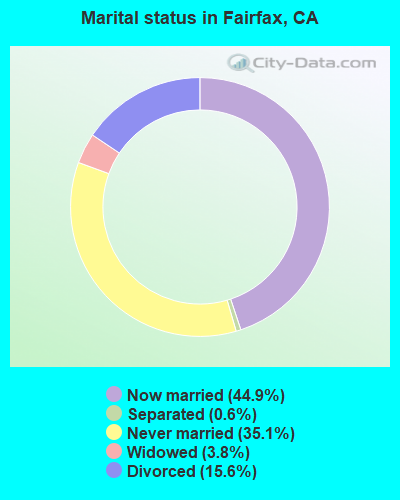
- Never married: 35.1%
- Now married: 44.9%
- Separated: 0.6%
- Widowed: 3.8%
- Divorced: 15.6%
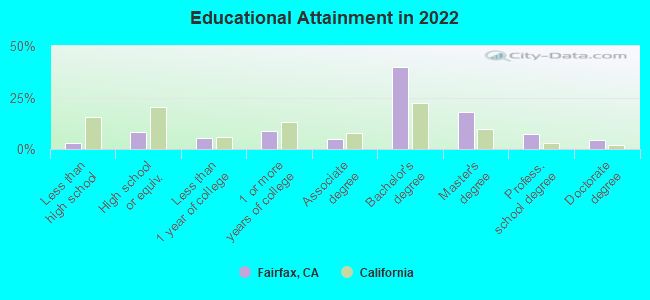
For population 25 years and over in Fairfax:
- High school or higher: 97.7%
- Bachelor's degree or higher: 68.0%
- Graduate or professional degree: 28.0%
- Unemployed: 4.7%
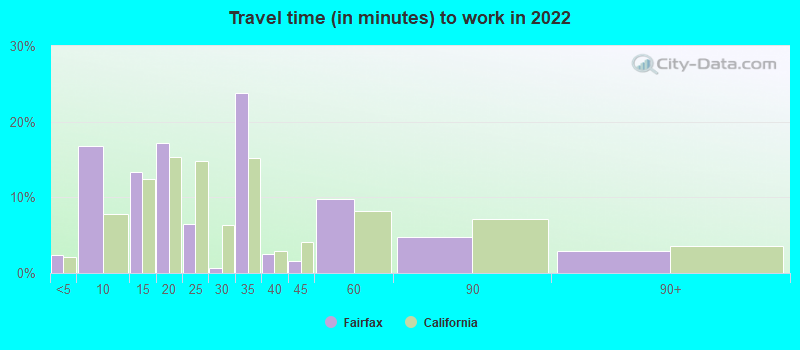
- Mean travel time to work (commute): 17.6 minutes
| Here: | 8.7 |
| California average: | 15.5 |

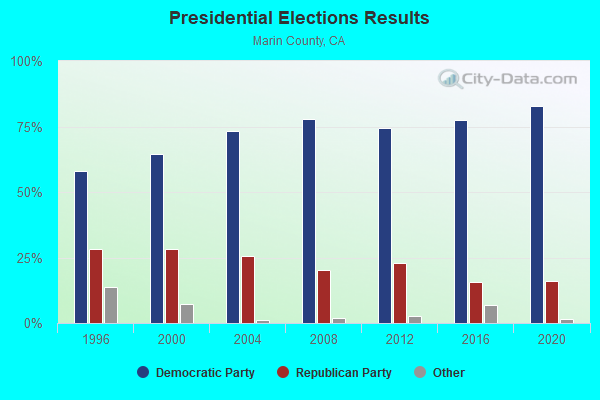
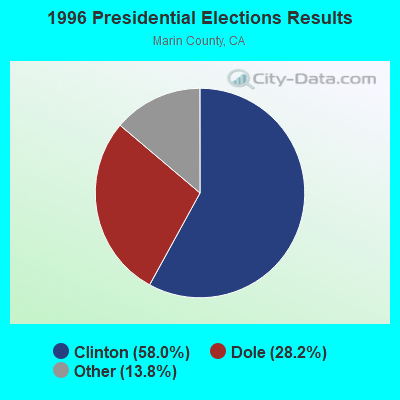
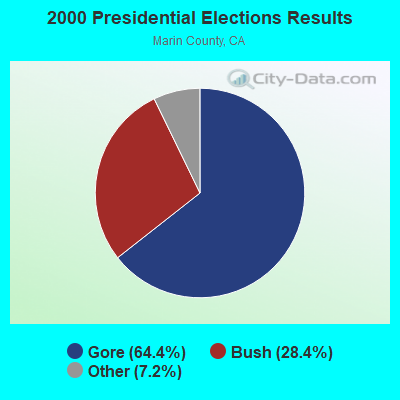
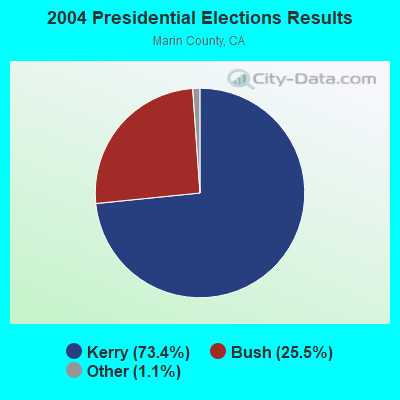
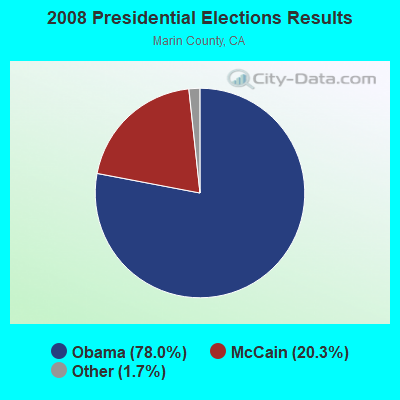
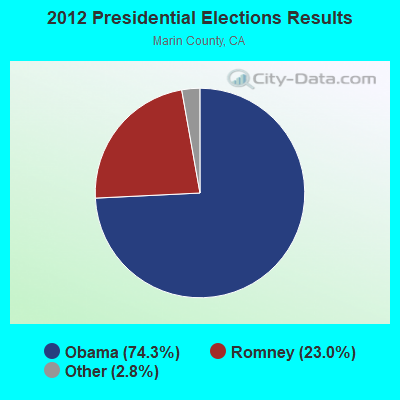
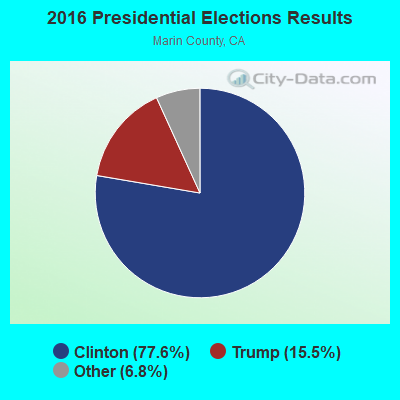
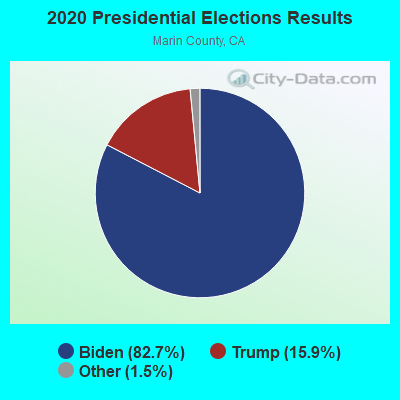
Graphs represent county-level data. Detailed 2008 Election Results
Religion statistics for Fairfax, CA (based on Marin County data)
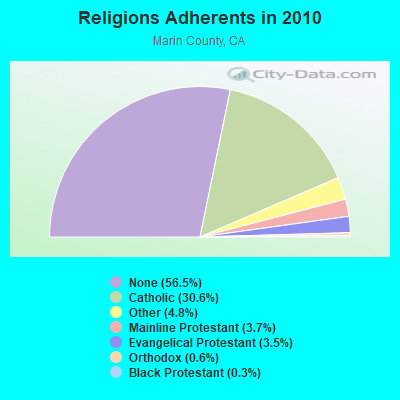
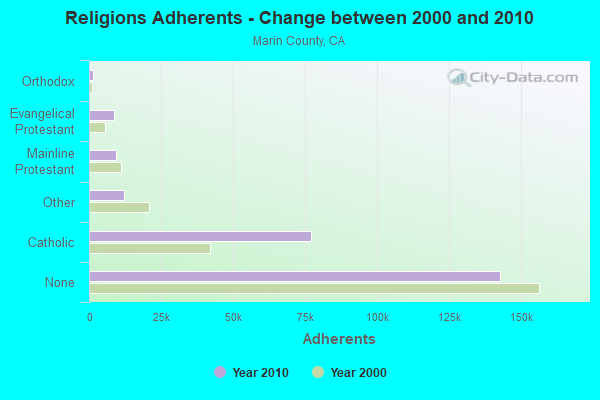
| Religion | Adherents | Congregations |
|---|---|---|
| Catholic | 77,114 | 30 |
| Other | 12,119 | 50 |
| Mainline Protestant | 9,458 | 48 |
| Evangelical Protestant | 8,817 | 71 |
| Orthodox | 1,525 | 3 |
| Black Protestant | 775 | 2 |
| None | 142,601 | - |
Food Environment Statistics:
| Marin County: | 2.59 / 10,000 pop. |
| California: | 2.14 / 10,000 pop. |
| This county: | 0.04 / 10,000 pop. |
| California: | 0.04 / 10,000 pop. |
| Marin County: | 0.61 / 10,000 pop. |
| California: | 0.62 / 10,000 pop. |
| This county: | 1.30 / 10,000 pop. |
| State: | 1.49 / 10,000 pop. |
| Marin County: | 11.95 / 10,000 pop. |
| California: | 7.42 / 10,000 pop. |
| Marin County: | 7.0% |
| State: | 7.3% |
| Marin County: | 17.1% |
| California: | 21.3% |
| Marin County: | 17.1% |
| California: | 17.9% |
Health and Nutrition:
| Fairfax: | 50.6% |
| California: | 49.4% |
| This city: | 48.1% |
| California: | 48.0% |
| This city: | 28.6 |
| California: | 28.1 |
| Here: | 21.2% |
| State: | 20.2% |
| Fairfax: | 9.2% |
| California: | 11.2% |
| Fairfax: | 6.8 |
| State: | 6.8 |
| This city: | 35.4% |
| California: | 31.5% |
| Fairfax: | 57.2% |
| California: | 56.4% |
| Fairfax: | 79.1% |
| California: | 80.9% |
More about Health and Nutrition of Fairfax, CA Residents
| Local government employment and payroll (March 2022) | |||||
| Function | Full-time employees | Monthly full-time payroll | Average yearly full-time wage | Part-time employees | Monthly part-time payroll |
|---|---|---|---|---|---|
| Police Protection - Officers | 11 | $110,774 | $120,844 | 0 | $0 |
| Police - Other | 5 | $31,934 | $76,642 | 2 | $1,636 |
| Other Government Administration | 5 | $59,472 | $142,733 | 6 | $4,720 |
| Streets and Highways | 4 | $34,754 | $104,262 | 0 | $0 |
| Financial Administration | 2 | $22,996 | $137,976 | 3 | $8,056 |
| Other and Unallocable | 2 | $16,030 | $96,180 | 0 | $0 |
| Parks and Recreation | 1 | $6,762 | $81,144 | 3 | $2,819 |
| Totals for Government | 30 | $282,722 | $113,089 | 14 | $17,230 |
Fairfax government finances - Expenditure in 2017 (per resident):
- Construction - Regular Highways: $313,000 ($42.17)
- Current Operations - Police Protection: $3,107,000 ($418.56)
Local Fire Protection: $2,125,000 ($286.27)
Central Staff Services: $2,056,000 ($276.98)
Regular Highways: $903,000 ($121.65)
Parks and Recreation: $491,000 ($66.15)
Protective Inspection and Regulation - Other: $189,000 ($25.46)
- General - Interest on Debt: $383,000 ($51.60)
- Other Capital Outlay - Police Protection: $41,000 ($5.52)
Central Staff Services: $21,000 ($2.83)
Natural Resources - Other: $14,000 ($1.89)
Fairfax government finances - Revenue in 2017 (per resident):
- Charges - Other: $554,000 ($74.63)
Parks and Recreation: $84,000 ($11.32)
- Miscellaneous - General Revenue - Other: $277,000 ($37.32)
Fines and Forfeits: $137,000 ($18.46)
Rents: $33,000 ($4.45)
Interest Earnings: $27,000 ($3.64)
- State Intergovernmental - Other: $656,000 ($88.37)
Highways: $133,000 ($17.92)
General Local Government Support: $28,000 ($3.77)
- Tax - Property: $5,124,000 ($690.29)
Other: $1,640,000 ($220.93)
General Sales and Gross Receipts: $1,149,000 ($154.79)
Public Utilities Sales: $751,000 ($101.17)
Other License: $314,000 ($42.30)
Occupation and Business License - Other: $128,000 ($17.24)
Documentary and Stock Transfer: $51,000 ($6.87)
Other Selective Sales: $21,000 ($2.83)
Fairfax government finances - Debt in 2017 (per resident):
- Long Term Debt - Outstanding Unspecified Public Purpose: $12,762,000 ($1719.25)
Beginning Outstanding - Unspecified Public Purpose: $9,558,000 ($1287.62)
Issue, Unspecified Public Purpose: $3,860,000 ($520.01)
Retired Unspecified Public Purpose: $656,000 ($88.37)
Fairfax government finances - Cash and Securities in 2017 (per resident):
- Bond Funds - Cash and Securities: $2,814,000 ($379.09)
- Other Funds - Cash and Securities: $3,007,000 ($405.09)
- Sinking Funds - Cash and Securities: $1,777,000 ($239.39)
| Businesses in Fairfax, CA | ||||
| Name | Count | Name | Count | |
|---|---|---|---|---|
| 7-Eleven | 2 | FedEx | 2 | |
| Ace Hardware | 1 | UPS | 2 | |
| DHL | 1 | |||
Strongest AM radio stations in Fairfax:
- KCBS (740 AM; 50 kW; SAN FRANCISCO, CA; Owner: INFINITY BROADCASTING OPERATIONS, INC.)
- KTRB (860 AM; 50 kW; MODESTO, CA; Owner: PAPPAS RADIO OF CALIFORNIA, A CALIFORNIA LIMITED PARTNERSHIP)
- KIQI (1010 AM; 35 kW; SAN FRANCISCO, CA; Owner: RADIO UNICA OF SAN FRANCISCO LICENSE CORP.)
- KNEW (910 AM; 20 kW; OAKLAND, CA; Owner: AMFM RADIO LICENSES, L.L.C.)
- KNBR (680 AM; 50 kW; SAN FRANCISCO, CA; Owner: KNBR LICO, INC.)
- KTCT (1050 AM; 50 kW; SAN MATEO, CA; Owner: SUSQUEHANNA RADIO CORP.)
- KFAX (1100 AM; 50 kW; SAN FRANCISCO, CA; Owner: GOLDEN GATE BROADCASTING CO, INC.)
- KGO (810 AM; 50 kW; SAN FRANCISCO, CA; Owner: KGO-AM RADIO, INC.)
- KYCY (1550 AM; 50 kW; SAN FRANCISCO, CA; Owner: INFINITY BROADCASTING OPERATIONS, INC.)
- KFRC (610 AM; 5 kW; SAN FRANCISCO, CA; Owner: INFINITY BROADCASTING CORPORATION OF LOS ANGELES)
- KDYA (1190 AM; 10 kW; VALLEJO, CA; Owner: BAYBRIDGE COMMUNICATIONS, L.L.C.)
- KSFO (560 AM; 5 kW; SAN FRANCISCO, CA; Owner: KGO-AM RADIO, INC.)
- KDIA (1640 AM; 10 kW; VALLEJO, CA; Owner: BAYBRIDGE COMMUNICATIONS, L.L.C.)
Strongest FM radio stations in Fairfax:
- KSFB-FM (100.7 FM; SAN RAFAEL, CA; Owner: GOLDEN GATE BROADCASTING COMPANY, INC.)
- KDFC-FM (102.1 FM; SAN FRANCISCO, CA; Owner: BONNEVILLE HOLDING COMPANY)
- KISQ (98.1 FM; SAN FRANCISCO, CA; Owner: AMFM RADIO LICENSES, L.L.C.)
- KEAR (106.9 FM; SAN FRANCISCO, CA; Owner: FAMILY STATIONS, INC.)
- KSOL-FM2 (98.9 FM; SAUSALITO, ETC., CA; Owner: TMS LICENSE CALIFORNIA, INC)
- KOIT-FM (96.5 FM; SAN FRANCISCO, CA; Owner: BONNEVILLE HOLDING COMPANY)
- KKSF (103.7 FM; SAN FRANCISCO, CA; Owner: AMFM RADIO LICENSES, L.L.C.)
- KFOG (104.5 FM; SAN FRANCISCO, CA; Owner: KFFG LICO, INC)
- KSOL (98.9 FM; SAN FRANCISCO, CA; Owner: TMS LICENSE CALIFORNIA, INC)
- KKSF-FM1 (103.7 FM; PLEASANTON, ETC., CA; Owner: AMFM RADIO LICENSES, L.L.C.)
- KWMR (90.5 FM; POINT REYES STATION, CA; Owner: WEST MARIN COMMUNITY RADIO, INC.)
- KBLX-FM2 (102.9 FM; PLEASANTON, CA; Owner: ICBC BROADCAST HOLDINGS -CA, INC.)
- KSOL-FM3 (98.9 FM; PLEASANTON, CA; Owner: TMS LICENSE CALIFORNIA, INC)
- KFRC-FM3 (99.7 FM; WALNUT CREEK, CA; Owner: INFINITY KFRC-FM, INC.)
- KZBR-FM1 (95.7 FM; WALNUT CREEK, CA; Owner: BONNEVILLE HOLDING COMPANY)
- KISQ-FM3 (98.1 FM; CONCORD, CA; Owner: AMFM RADIO LICENSES, L.L.C.)
- KMEL-FM1 (106.1 FM; CONCORD, CA; Owner: AMFM RADIO LICENSES, L.L.C.)
- KYLD (94.9 FM; SAN FRANCISCO, CA; Owner: AMFM RADIO LICENSES, L.L.C.)
- KMEL (106.1 FM; SAN FRANCISCO, CA; Owner: AMFM RADIO LICENSES, L.L.C.)
- KZBR (95.7 FM; SAN FRANCISCO, CA; Owner: BONNEVILLE HOLDING COMPANY)
TV broadcast stations around Fairfax:
- KQED (Channel 9; SAN FRANCISCO, CA; Owner: KQED, INC.)
- KGO-TV (Channel 7; SAN FRANCISCO, CA; Owner: KGO TELEVISION, INC.)
- KPIX-TV (Channel 5; SAN FRANCISCO, CA; Owner: CBS BROADCASTING INC.)
- KTVU (Channel 2; OAKLAND, CA; Owner: KTVU PARTNERSHIP)
- KRON-TV (Channel 4; SAN FRANCISCO, CA; Owner: YOUNG BROADCASTING OF SAN FRANCISCO, INC.)
- KMTP-TV (Channel 32; SAN FRANCISCO, CA; Owner: MINORITY TELEVISION PROJECT)
- KBHK-TV (Channel 44; SAN FRANCISCO, CA; Owner: VIACOM TELEVISION STATIONS GROUP OF SAN FRANCISCO INC.)
- KBWB (Channel 20; SAN FRANCISCO, CA; Owner: KBWB LICENSE, INC.)
- KFSF (Channel 66; VALLEJO, CA; Owner: TELEFUTURA SAN FRANCISCO LLC)
- KCNS (Channel 38; SAN FRANCISCO, CA; Owner: WRAY, INC.)
- KCSM-TV (Channel 60; SAN MATEO, CA; Owner: SAN MATEO COUNTY COMMUNITY COLLEGE DISTRICT)
- KSPX (Channel 29; SACRAMENTO, CA; Owner: PAXSON SACRAMENTO LICENSE, INC.)
- KOVR (Channel 13; STOCKTON, CA; Owner: SCI - SACRAMENTO LICENSEE, LLC)
- KXTV (Channel 10; SACRAMENTO, CA; Owner: KXTV, INC.)
- KTXL (Channel 40; SACRAMENTO, CA; Owner: CHANNEL 40, INC.)
- National Bridge Inventory (NBI) Statistics
- 6Number of bridges
- 33ft / 10.1mTotal length
- $691,000Total costs
- 885Total average daily traffic
- 19Total average daily truck traffic
- 1,411Total future (year 2036) average daily traffic
FCC Registered Cell Phone Towers:
1 (See the full list of FCC Registered Cell Phone Towers in Fairfax)FCC Registered Antenna Towers:
39 (See the full list of FCC Registered Antenna Towers)FCC Registered Broadcast Land Mobile Towers:
4- Fire Department Bolinas & Park Rds (Lat: 37.985472 Lon: -122.589972), Call Sign: KAR970, Licensee ID: L00425477,
Assigned Frequencies: 46.1200 MHz, 46.5000 MHz, Grant Date: 11/29/2001, Expiration Date: 02/02/2012, Cancellation Date: 05/11/2011, Registrant: City Of Fairfax, San Rafael, CA 94913, Phone: (415) 499-7241
- Lat: 37.989917 Lon: -122.591083, Call Sign: WQAS958, Licensee ID: L00897909,
Assigned Frequencies: 457.525 MHz, 457.525 MHz, 457.550 MHz, 457.550 MHz, 457.575 MHz, 457.575 MHz, 457.600 MHz, 457.600 MHz, 467.925 MHz, 467.925 MHz, Grant Date: 08/02/2004, Expiration Date: 01/29/2005, Cancellation Date: 04/02/2005, Certifier: David A Sexton, Registrant: The Meadow Club, 1001 Bolinas Road, Fairfax, CA 94978-0129, Phone: (415) 453-3274, Fax: (415) 453-3276, Email:
- Lat: 37.929000 Lon: -122.587083, Call Sign: WQEW222,
Assigned Frequencies: 492.837 MHz, Grant Date: 02/18/2016, Expiration Date: 05/01/2026, Certifier: Mark J Abrams, Registrant: Rini O\'Neil, Pc, 2101 L Street Nw, Suite 300, Washington, DC 20037, Phone: (202) 997-0025, Email:
- 3000 Sir Francis Drake Blvd (Lat: 38.001833 Lon: -122.611056), Type: Pole, Structure height: 5.5 m, Overall height: 6.7 m, Call Sign: WRCV424,
Assigned Frequencies: 171.912 MHz, Grant Date: 02/06/2019, Expiration Date: 02/06/2029, Certifier: Robert Pascaretta, Registrant: County Of Marin, 3501 Civic Center Dr., San Rafael, CA 94903, Phone: (415) 473-7028, Email:
FCC Registered Microwave Towers:
8 (See the full list of FCC Registered Microwave Towers in this town)FCC Registered Paging Towers:
1 (See the full list of FCC Registered Paging Towers)FCC Registered Amateur Radio Licenses:
83 (See the full list of FCC Registered Amateur Radio Licenses in Fairfax)FAA Registered Aircraft:
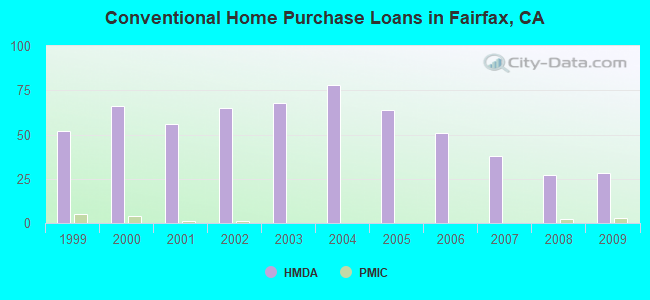
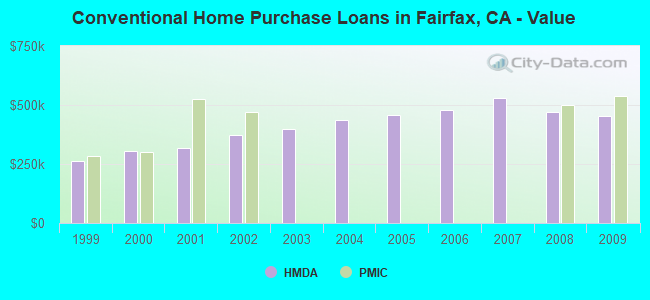
10 (See the full list of FAA Registered Aircraft in Fairfax)| Home Mortgage Disclosure Act Aggregated Statistics For Year 2009 (Based on 2 partial tracts) | ||||||||||
| A) FHA, FSA/RHS & VA Home Purchase Loans | B) Conventional Home Purchase Loans | C) Refinancings | D) Home Improvement Loans | F) Non-occupant Loans on < 5 Family Dwellings (A B C & D) | ||||||
|---|---|---|---|---|---|---|---|---|---|---|
| Number | Average Value | Number | Average Value | Number | Average Value | Number | Average Value | Number | Average Value | |
| LOANS ORIGINATED | 7 | $489,347 | 28 | $455,455 | 163 | $359,319 | 10 | $215,134 | 7 | $315,567 |
| APPLICATIONS APPROVED, NOT ACCEPTED | 0 | $0 | 2 | $562,335 | 25 | $424,468 | 0 | $0 | 1 | $504,470 |
| APPLICATIONS DENIED | 1 | $342,360 | 5 | $535,002 | 48 | $444,507 | 2 | $127,870 | 2 | $292,385 |
| APPLICATIONS WITHDRAWN | 1 | $512,720 | 2 | $433,795 | 18 | $432,661 | 2 | $118,300 | 2 | $341,025 |
| FILES CLOSED FOR INCOMPLETENESS | 0 | $0 | 2 | $496,625 | 5 | $422,008 | 0 | $0 | 0 | $0 |
Detailed HMDA statistics for the following Tracts: 1141.00 , 1142.00
| Private Mortgage Insurance Companies Aggregated Statistics For Year 2009 (Based on 2 partial tracts) | ||||
| A) Conventional Home Purchase Loans | B) Refinancings | |||
|---|---|---|---|---|
| Number | Average Value | Number | Average Value | |
| LOANS ORIGINATED | 3 | $539,100 | 1 | $492,910 |
| APPLICATIONS APPROVED, NOT ACCEPTED | 1 | $439,420 | 0 | $0 |
| APPLICATIONS DENIED | 1 | $834,720 | 0 | $0 |
| APPLICATIONS WITHDRAWN | 1 | $543,010 | 0 | $0 |
| FILES CLOSED FOR INCOMPLETENESS | 0 | $0 | 0 | $0 |
Detailed PMIC statistics for the following Tracts: 1141.00 , 1142.00
2005 - 2018 National Fire Incident Reporting System (NFIRS) incidents
- Fire incident types reported to NFIRS in Fairfax, CA
- 15249.8%Structure Fires
- 9430.8%Outside Fires
- 3511.5%Mobile Property/Vehicle Fires
- 247.9%Other
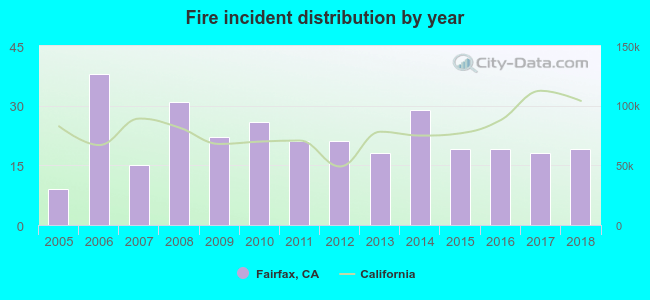 According to the data from the years 2005 - 2018 the average number of fire incidents per year is 22. The highest number of fires - 38 took place in 2006, and the least - 9 in 2005. The data has a growing trend.
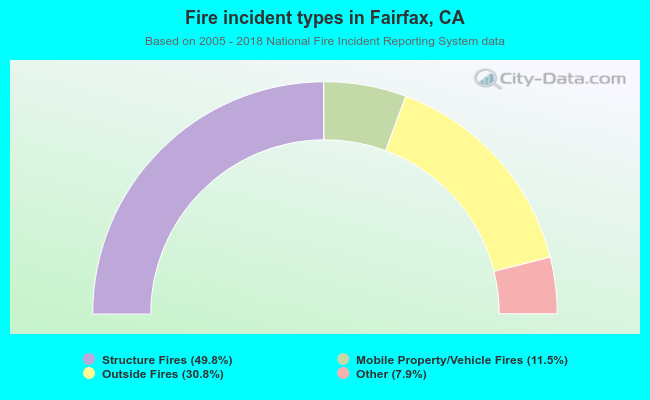 When looking into fire subcategories, the most reports belonged to: Structure Fires (49.8%), and Outside Fires (30.8%).
| Most common first names in Fairfax, CA among deceased individuals | ||
| Name | Count | Lived (average) |
|---|---|---|
| John | 48 | 74.7 years |
| William | 44 | 72.4 years |
| Robert | 43 | 71.9 years |
| Mary | 37 | 80.3 years |
| George | 33 | 75.7 years |
| James | 33 | 70.0 years |
| Joseph | 29 | 77.8 years |
| Charles | 29 | 72.8 years |
| Helen | 27 | 75.9 years |
| Frank | 21 | 75.9 years |
| Most common last names in Fairfax, CA among deceased individuals | ||
| Last name | Count | Lived (average) |
|---|---|---|
| Johnson | 12 | 78.9 years |
| Miller | 9 | 68.3 years |
| Wilson | 7 | 74.9 years |
| Anderson | 7 | 74.5 years |
| Young | 7 | 74.4 years |
| Williams | 6 | 82.2 years |
| Brewer | 6 | 79.5 years |
| Stanley | 6 | 84.0 years |
| Jones | 6 | 56.5 years |
| Edwards | 6 | 75.4 years |
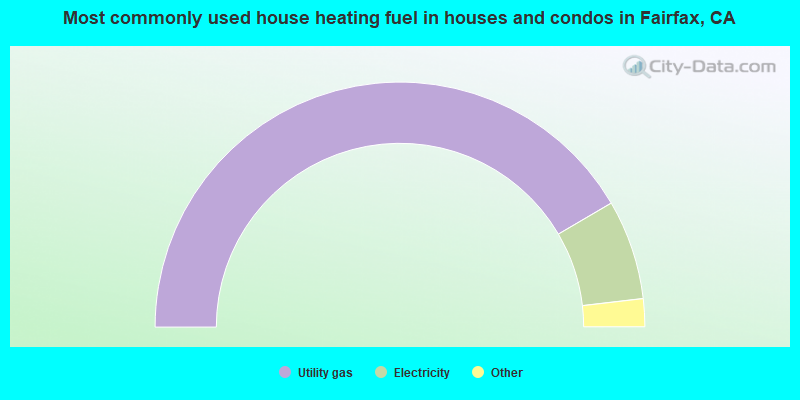
- 83.2%Utility gas
- 13.2%Electricity
- 2.4%No fuel used
- 0.6%Solar energy
- 0.3%Bottled, tank, or LP gas
- 0.3%Wood
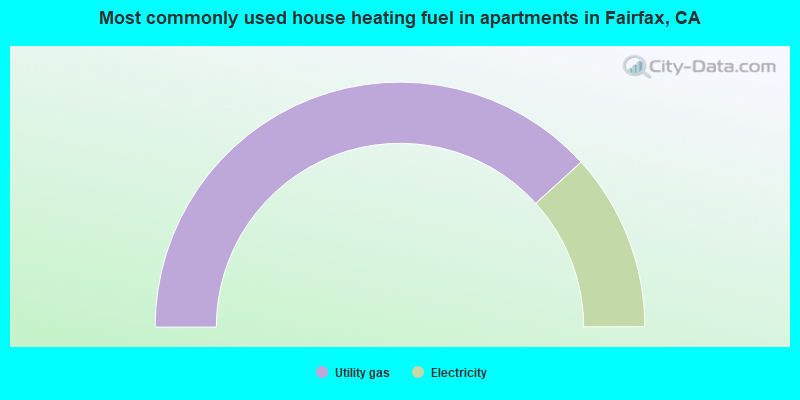
- 76.5%Utility gas
- 23.5%Electricity
Fairfax compared to California state average:
- Median house value above state average.
- Unemployed percentage significantly below state average.
- Black race population percentage significantly below state average.
- Hispanic race population percentage significantly below state average.
- Median age significantly above state average.
- Foreign-born population percentage significantly below state average.
- Length of stay since moving in significantly above state average.
- House age above state average.
- Percentage of population with a bachelor's degree or higher significantly above state average.
Fairfax on our top lists:
- #7 on the list of "Top 101 cities with largest percentage of females in occupations: arts, design, entertainment, sports, and media occupations (population 5,000+)"
- #26 on the list of "Top 101 cities with the most people taking a ferryboat to work (population 5,000+)"
- #29 on the list of "Top 101 cities with largest percentage of males in occupations: arts, design, entertainment, sports, and media occupations (population 5,000+)"
- #39 on the list of "Top 101 cities with the most people taking a bicycle to work (population 5,000+)"
- #70 on the list of "Top 101 cities with largest percentage of females in industries: professional, scientific, and technical services (population 5,000+)"
- #93 on the list of "Top 101 cities with the lowest number of robberies per 100,000 residents (population 5,000+)"
- #11 (94930) on the list of "Top 101 zip codes with the largest percentage of taxpayers reporting profit/loss from business in 2012 (pop 5,000+)"
- #13 on the list of "Top 101 counties with the largest number of people without health insurance coverage in 2000 (pop. 50,000+)"
- #17 on the list of "Top 101 counties with the highest carbon monoxide air pollution readings in 2012 (ppm)"
- #17 on the list of "Top 101 counties with the lowest Ozone (1-hour) air pollution readings in 2012 (ppm)"
- #30 on the list of "Top 101 counties with highest percentage of residents voting for Obama (Democrat) in the 2012 Presidential Election (pop. 50,000+)"
- #43 on the list of "Top 101 counties with the lowest number of births per 1000 residents 2007-2013"

|
|
Total of 228 patent applications in 2008-2024.