Estimated zip code population in 2022: 2,875 Zip code population in 2010: 3,168 Zip code population in 2000: 3,678
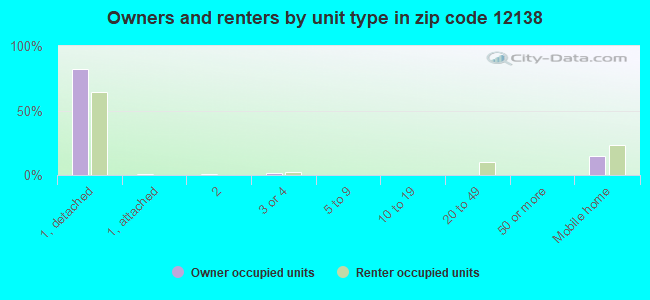
Houses and condos: 1,715 Renter-occupied apartments: 121
% of renters here:
10%
State:
46%
March 2022 cost of living index in zip code 12138: 95.7 (near average, U.S. average is 100)
Land area: 80.3 sq. mi. Water area: 0.4 sq. mi.
Population density: 36 people per square mile
(very low).
OSM Map
General Map
Google Map
MSN Map
OSM Map
General Map
Google Map
MSN Map
OSM Map
General Map
Google Map
MSN Map
OSM Map
General Map
Google Map
MSN Map
Please wait while loading the map...
Real estate property taxes paid for housing units in 2022:
This zip code:
1.9% ($3,076)
New York:
1.5% ($6,180)
Median real estate property taxes paid for housing units with mortgages in 2022: $3,533 (2.0%) Median real estate property taxes paid for housing units with no mortgage in 2022: $2,656 (1.8%)
Business Search- 14 Million verified businesses
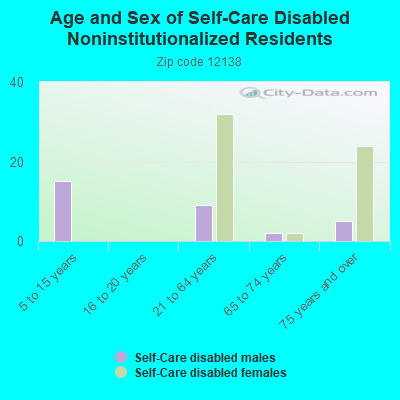
Males: 1,477
(51.4%)
Females: 1,398
(48.6%)
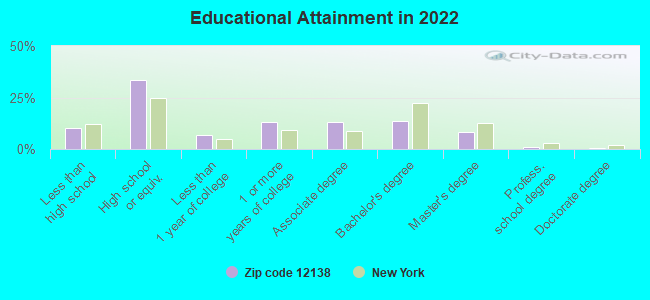
For population 25 years and over in 12138:
High school or higher: 88.7%
Bachelor's degree or higher: 23.0%
Graduate or professional degree: 9.7%
Unemployed: 2.7%
Mean travel time to work (commute): 29.8 minutes
For population 15 years and over in 12138:
Never married: 27.0%
Now married: 56.5%
Separated: 0.6%
Widowed: 7.4%
Divorced: 8.5%
Zip code 12138 compared to state average:
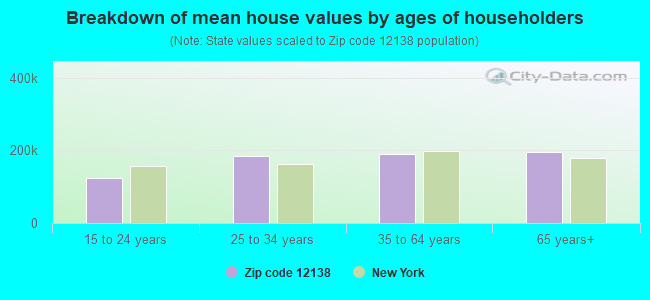
Median house value significantly below state average.
Unemployed percentage below state average.
Black race population percentage significantly below state average.
Hispanic race population percentage significantly below state average.
Foreign-born population percentage significantly below state average.
Renting percentage significantly below state average.
Number of college students below state average.
Percentage of population with a bachelor's degree or higher below state average.
Averages for the 2020 tax year for zip code 12138, filed in 2021:
Average Adjusted Gross Income (AGI) in 2020: $61,804 (Individual Income Tax Returns)
Here:
$61,804
State:
$90,930
Salary/wage: $54,819 (reported on 79.9% of returns)
Here:
$54,819
State:
$72,104
(% of AGI for various income ranges: 1030.8% for AGIs below $25k, 3399.0% for AGIs $25k-50k, 6604.1% for AGIs $50k-75k, 8032.3% for AGIs $75k-100k, 15530.0% for AGIs $100k-200k)
Taxable interest for individuals: $871 (reported on 35.4% of returns)
This zip code:
$871
New York:
$3,075
(% of AGI for various income ranges: 15.8% for AGIs below $25k, 25.5% for AGIs $25k-50k, 27.6% for AGIs $50k-75k, 65.4% for AGIs $75k-100k, 49.3% for AGIs $100k-200k)
Ordinary dividends: $4,179 (reported on 19.4% of returns)
Here:
$4,179
State:
$11,095
(% of AGI for various income ranges: 26.2% for AGIs below $25k, 47.1% for AGIs $25k-50k, 30.6% for AGIs $50k-75k, 126.9% for AGIs $75k-100k, 182.9% for AGIs $100k-200k)
Net capital gain/loss in AGI: +$14,695 (reported on 15.3% of returns)
Here:
+$14,695
State:
+$44,925
(% of AGI for various income ranges: 42.3% for AGIs $25k-50k, 96.5% for AGIs $50k-75k, 95.4% for AGIs $75k-100k, 372.9% for AGIs $100k-200k)
Profit/loss from business: +$17,852 (reported on 14.6% of returns)
Here:
+$17,852
State:
+$14,940
(% of AGI for various income ranges: 204.2% for AGIs below $25k, 111.0% for AGIs $25k-50k, 203.5% for AGIs $50k-75k, 1805.7% for AGIs $100k-200k)
Taxable individual retirement arrangement distribution: $14,138 (reported on 9.0% of returns)
12138:
$14,138
New York:
$19,609
(% of AGI for various income ranges: 79.2% for AGIs below $25k, 179.0% for AGIs $25k-50k, 270.0% for AGIs $75k-100k, 518.6% for AGIs $100k-200k)
Total itemized deductions: $23,700 (reported on 5.6% of returns)
Here:
$23,700
State:
$39,326
(% of AGI for various income ranges: 626.5% for AGIs $50k-75k, 593.6% for AGIs $100k-200k)
Charity contributions: $6,750 (reported on 2.8% of returns)
Here:
$6,750
State:
$15,420
(% of AGI for various income ranges: 207.7% for AGIs $75k-100k)
Taxes paid: $8,575 (reported on 5.6% of returns)
12138:
$8,575
State:
$9,183
(% of AGI for various income ranges: 235.9% for AGIs $50k-75k, 203.6% for AGIs $100k-200k)
Earned income credit: $2,300 (reported on 11.1% of returns)
Here:
$2,300
State:
$2,138
(% of AGI for various income ranges: 84.2% for AGIs below $25k, 48.1% for AGIs $25k-50k)
Percentage of individuals using paid preparers for their 2020 taxes: 96.5%
Here:
97%
State:
95%
(% for various income ranges: 94.9% for AGIs below $25k, 94.9% for AGIs $25k-50k, 100.0% for AGIs $50k-75k, 100.0% for AGIs $75k-100k, 95.5% for AGIs $100k-200k, 100.0% for AGIs over 200k)
Averages for the 2012 tax year for zip code 12138, filed in 2013:
Average Adjusted Gross Income (AGI) in 2012: $50,747 (Individual Income Tax Returns)
Here:
$50,747
State:
$77,088
Salary/wage: $46,629 (reported on 83.1% of returns)
Here:
$46,629
State:
$60,593
(% of AGI for various income ranges: 68.7% for AGIs below $25k, 78.5% for AGIs $25k-50k, 77.3% for AGIs $50k-75k, 77.0% for AGIs $75k-100k, 76.0% for AGIs $100k-200k)
Taxable interest for individuals: $700 (reported on 38.2% of returns)
This zip code:
$700
New York:
$3,125
(% of AGI for various income ranges: 1.0% for AGIs below $25k, 0.4% for AGIs $25k-50k, 0.7% for AGIs $50k-75k, 0.4% for AGIs $75k-100k, 0.5% for AGIs $100k-200k)
Ordinary dividends: $2,419 (reported on 19.1% of returns)
Here:
$2,419
State:
$10,299
(% of AGI for various income ranges: 0.9% for AGIs below $25k, 0.6% for AGIs $25k-50k, 0.5% for AGIs $50k-75k, 0.5% for AGIs $75k-100k, 1.5% for AGIs $100k-200k)
Net capital gain/loss in AGI: +$2,353 (reported on 11.0% of returns)
Here:
+$2,353
State:
+$42,474
(% of AGI for various income ranges: 0.3% for AGIs below $25k, 0.3% for AGIs $75k-100k, 1.3% for AGIs $100k-200k)
Profit/loss from business: +$8,800 (reported on 16.2% of returns)
Here:
+$8,800
State:
+$16,168
(% of AGI for various income ranges: 8.0% for AGIs below $25k, 2.7% for AGIs $25k-50k, 1.5% for AGIs $50k-75k, 2.4% for AGIs $75k-100k, 2.5% for AGIs $100k-200k)
Taxable individual retirement arrangement distribution: $9,664 (reported on 8.1% of returns)
12138:
$9,664
New York:
$17,621
(% of AGI for various income ranges: 3.5% for AGIs below $25k, 1.2% for AGIs $25k-50k, 2.4% for AGIs $50k-75k, 1.6% for AGIs $100k-200k)
Total itemized deductions: $19,168 (23% of AGI, reported on 32.4% of returns)
Here:
$19,168
State:
$34,985
Here:
22.5% of AGI
State:
21.3% of AGI
(% of AGI for various income ranges: 7.9% for AGIs below $25k, 10.0% for AGIs $25k-50k, 12.5% for AGIs $50k-75k, 12.0% for AGIs $75k-100k, 14.5% for AGIs $100k-200k)
Charity contributions: $1,733 (reported on 24.3% of returns)
Here:
$1,733
State:
$5,572
(% of AGI for various income ranges: 0.4% for AGIs below $25k, 0.6% for AGIs $25k-50k, 0.9% for AGIs $50k-75k, 0.7% for AGIs $75k-100k, 1.1% for AGIs $100k-200k)
Taxes paid: $9,473 (reported on 32.4% of returns)
12138:
$9,473
State:
$18,656
(% of AGI for various income ranges: 3.3% for AGIs below $25k, 4.5% for AGIs $25k-50k, 5.4% for AGIs $50k-75k, 6.0% for AGIs $75k-100k, 8.0% for AGIs $100k-200k)
Earned income credit: $2,090 (reported on 14.7% of returns)
Here:
$2,090
State:
$2,230
(% of AGI for various income ranges: 4.8% for AGIs below $25k, 1.0% for AGIs $25k-50k)
Percentage of individuals using paid preparers for their 2012 taxes: 55.1%
Here:
55%
State:
66%
(% for various income ranges: 48.9% for AGIs below $25k, 53.8% for AGIs $25k-50k, 63.6% for AGIs $50k-75k, 50.0% for AGIs $75k-100k, 68.8% for AGIs $100k-200k)
Averages for the 2004 tax year for zip code 12138, filed in 2005:
Average Adjusted Gross Income (AGI) in 2004: $42,188 (Individual Income Tax Returns)
Here:
$42,188
State:
$59,519
Salary/wage: $37,495 (reported on 85.0% of returns)
Here:
$37,495
State:
$50,673
(% of AGI for various income ranges: 80.3% for AGIs below $10k, 74.2% for AGIs $10k-25k, 81.2% for AGIs $25k-50k, 82.4% for AGIs $50k-75k, 82.7% for AGIs $75k-100k, 57.3% for AGIs over 100k)
Taxable interest for individuals: $794 (reported on 52.1% of returns)
This zip code:
$794
New York:
$2,377
(% of AGI for various income ranges: 4.3% for AGIs below $10k, 1.8% for AGIs $10k-25k, 1.0% for AGIs $25k-50k, 0.9% for AGIs $50k-75k, 0.3% for AGIs $75k-100k, 0.9% for AGIs over 100k)
Taxable dividends: $1,978 (reported on 24.4% of returns)
Here:
$1,978
State:
$5,394
(% of AGI for various income ranges: 1.3% for AGIs below $10k, 2.1% for AGIs $10k-25k, 0.5% for AGIs $25k-50k, 0.7% for AGIs $50k-75k, 0.4% for AGIs $75k-100k, 2.4% for AGIs over 100k)
Net capital gain/loss: +$3,425 (reported on 16.6% of returns)
Here:
+$3,425
State:
+$23,581
(% of AGI for various income ranges: -0.5% for AGIs below $10k, 0.3% for AGIs $10k-25k, 0.4% for AGIs $25k-50k, 0.8% for AGIs $50k-75k, -0.0% for AGIs $75k-100k, 4.6% for AGIs over 100k)
Profit/loss from business: +$9,423 (reported on 17.6% of returns)
Here:
+$9,423
State:
+$13,809
(% of AGI for various income ranges: 12.4% for AGIs below $10k, 6.9% for AGIs $10k-25k, 3.9% for AGIs $25k-50k, 2.0% for AGIs $50k-75k, 0.4% for AGIs $75k-100k, 6.8% for AGIs over 100k)
IRA payment deduction: $2,410 (reported on 3.0% of returns)
12138:
$2,410
New York:
$3,115
Total itemized deductions: $15,688 (21% of AGI, reported on 32.4% of returns)
Here:
$15,688
State:
$25,864
Here:
21.4% of AGI
State:
21.9% of AGI
(% of AGI for various income ranges: 10.4% for AGIs $10k-25k, 9.9% for AGIs $25k-50k, 12.6% for AGIs $50k-75k, 13.8% for AGIs $75k-100k, 14.0% for AGIs over 100k)
Charity contributions deductions: $1,891 (2% of AGI, reported on 28.4% of returns)
Here:
$1,891
State:
$4,439
Here:
2.5% of AGI
State:
3.6% of AGI
(% of AGI for various income ranges: 0.8% for AGIs $10k-25k, 0.9% for AGIs $25k-50k, 1.5% for AGIs $50k-75k, 1.6% for AGIs $75k-100k, 1.5% for AGIs over 100k)
Total tax: $5,548 (reported on 78.2% of returns)
12138:
$5,548
State:
$11,730
(% of AGI for various income ranges: 3.8% for AGIs below $10k, 4.4% for AGIs $10k-25k, 7.4% for AGIs $25k-50k, 8.7% for AGIs $50k-75k, 10.5% for AGIs $75k-100k, 17.6% for AGIs over 100k)
Earned income credit: $1,640 (reported on 13.6% of returns)
Here:
$1,640
State:
$1,757
Percentage of individuals using paid preparers for their 2004 taxes: 58.1%
Here:
58%
State:
67%
(% for various income ranges: 49.4% for AGIs below $10k, 57.8% for AGIs $10k-25k, 57.8% for AGIs $25k-50k, 59.1% for AGIs $50k-75k, 68.8% for AGIs $75k-100k, 69.6% for AGIs over 100k)
Likely homosexual households (counted as self-reported same-sex unmarried-partner households)
Lesbian couples: 0.0% of all households
Gay men: 0.4% of all households
Household received Food Stamps/SNAP in the past 12 months: 128 Household did not receive Food Stamps/SNAP in the past 12 months: 1,133
Women who had a birth in the past 12 months: 17 (7 now married, 10 unmarried) Women who did not have a birth in the past 12 months: 670 (300 now married, 366 unmarried)
Housing units in zip code 12138 with a mortgage: 545 (38 second mortgage, 30 both second mortgage and home equity loan) Houses without a mortgage: 23
Median monthly owner costs for units with a mortgage: $1,494 Median monthly owner costs for units without a mortgage: $649
Residents with income below the poverty level in 2022:
This zip code:
9.3%
Whole state:
14.3%
Residents with income below 50% of the poverty level in 2022:
This zip code:
7.4%
Whole state:
6.8%
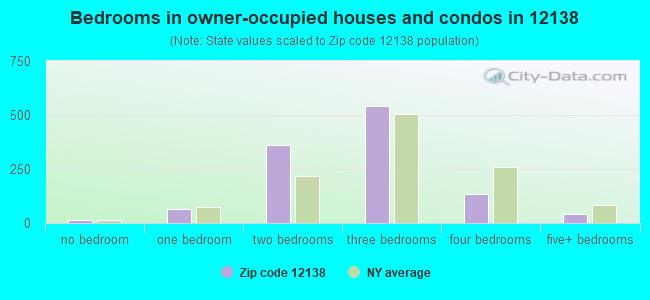
Median number of rooms in houses and condos:
Here:
5.5
State:
6.3
Median number of rooms in apartments:
Here:
5.6
State:
3.8
Notable locations in this zip code not listed on our city pages
Notable locations in zip code 12138: Taconic Trails Ski Area (A), Broken Wheel Campground (B), Aqua Vista Valley Campground (C), Petersburg Public Library (D), Grafton Volunteer Fire Company (E). Display/hide their locations on the map
Churches in zip code 12138 include: Dutch Church (A), Fifty Six Church (B), Petersburg Baptist Church (C), Shiloh Assembly of God (D), Mountain Chapel Church (E), Petersburgh United Methodist Church (F), North Petersburgh United Methodist Church (G), Grafton United Methodist Church (H). Display/hide their locations on the map
Lakes: Peckham Pond (A), Red Pond (B), Spring Lake (C), Banker Pond (D), Black River Pond (E), Dyken Pond (F), Lake Elizabeth (G). Display/hide their locations on the map
Streams, rivers, and creeks: Rocky Brook (A), Red Pond Brook (B), Little Hoosic River (C), Dill Creek (D), Dayfoot Brook (E). Display/hide their locations on the map
Tourist attractions (not listed on the city page) : Dubacher William (Recreation Areas; Red Pond Road) (1), Berkshire Bird Paradise (Recreation Areas; 43 Red Pond Road) (2). Display/hide their approximate locations on the map
Size of family households: 400 2-persons, 159 3-persons, 91 4-persons, 80 5-persons, 11 6-persons, 19 7-or-more-persons
Size of nonfamily households: 446 1-person, 65 2-persons
444 married couples with children.
28 single-parent households (12 men, 16 women).
96.5% of residents of 12138 zip code speak English at home.
0.9% of residents speak Spanish at home (60% very well, 24% well, 16% not well).
2.1% of residents speak other Indo-European language at home (88% very well, 12% well).
0.1% of residents speak Asian or Pacific Island language at home (100% well).
0.1% of residents speak other language at home (100% very well).
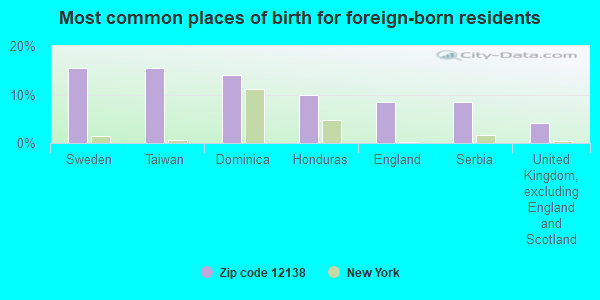
Foreign born population: 71 (2.5%) (61.0% of them are naturalized citizens)
This zip code:
2.5%
Whole state:
22.7%
15%Sweden
15%Taiwan
14%Dominica
10%Honduras
8%England
8%Serbia
4%United Kingdom, excluding England and Scotland
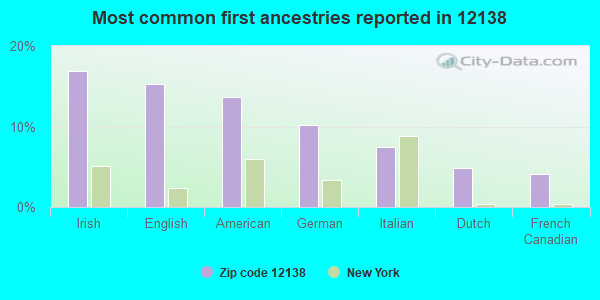
17%Irish
15%English
14%American
10%German
7%Italian
5%Dutch
4%French Canadian
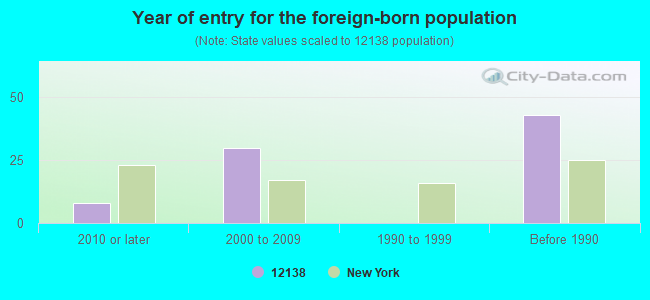
Year of entry for the foreign-born population
82010 or later
302000 to 2009
01990 to 1999
43Before 1990
Facilities with environmental interests located in this zip code:
EVERGREEN FARM (4 GREEN ROAD in PETERSBURG, NY)
STATE MASTER (New York facility tracking) - National Pollutant Discharge Elimination System Permit National Pollutant Discharge Elimination System NON-MAJOR (Tracking pollutant discharge elimination systems) - permit Business SIC classification: GENERAL FARMS, PRIMARILY LIVESTOCK AND ANIMAL SPECIALTIES Organizations: DAVID G. GREEN (CONTACT/OWNER)
Alternative names: DAVID G. GREEN
GARRISON ROSE M (119 E HOLLOW RD in PETERSBURG, NY)
Conditionally Exempt Small Quantity Generators, less than 100 kg/month of hazardous waste (Resource Conservation and Recovery Act (tracking hazardous waste)) Organizations: JIM JENSEN (CONTACT/OPERATOR)
, ROSE M GARRISON (CONTACT/OWNER)
Housing units lacking complete plumbing facilities: 5.0% Housing units lacking complete kitchen facilities: 5.0%
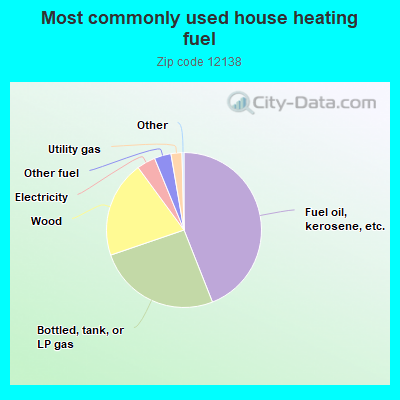
44.1%Fuel oil, kerosene, etc.
25.8%Bottled, tank, or LP gas
20.2%Wood
3.9%Electricity
3.5%Other fuel
2.3%Utility gas
Population in 1990: 3,891.
Place of birth for U.S.-born residents:
This state: 1,671
Northeast: 846
Midwest: 93
South: 132
West: 44
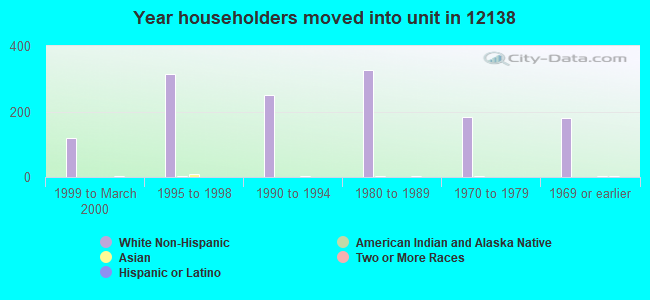
73% of the 12138 zip code residents lived in the same house 5 years ago. Out of people who lived in different houses, 70% lived in this county. Out of people who lived in different counties, 50% lived in New York.
97% of the 12138 zip code residents lived in the same house 1 year ago. Out of people who lived in different houses, 25% moved from this county. Out of people who lived in different houses, 44% moved from different county within same state. Out of people who lived in different houses, 6% moved from different state. Out of people who lived in different houses, 22% moved from abroad.
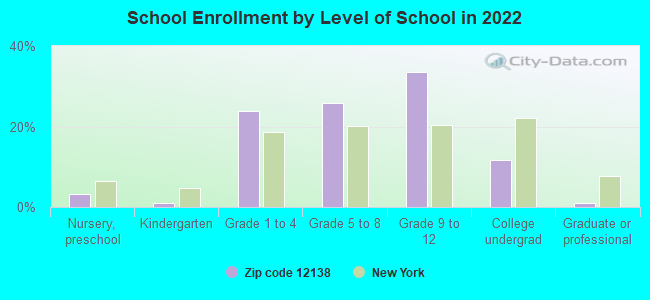
Private vs. public school enrollment:
Students in private schools in grades 1 to 8 (elementary and middle school): 23
Here:
9.4%
New York:
15.6%
Students in private schools in grades 9 to 12 (high school): 11
Here:
6.8%
New York:
15.0%
Students in private undergraduate colleges: 28
Here:
47.8%
New York:
39.2%
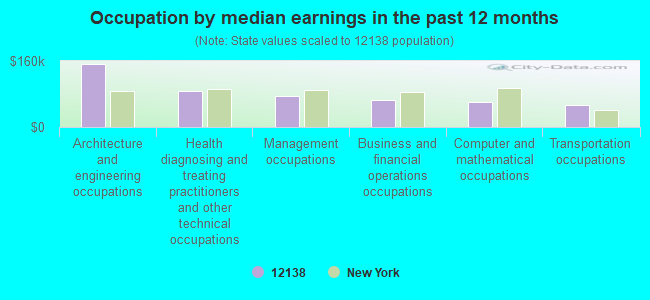
Occupation by median earnings in the past 12 months ($)
152,183Architecture and engineering occupations
87,269Health diagnosing and treating practitioners and other technical occupations
74,408Management occupations
65,105Business and financial operations occupations
59,813Computer and mathematical occupations
52,249Transportation occupations
Companies with federal contracts located in this zip code:
BRYAN TRIBLEY (233 LEWIS HOLLOW RD in PETERSBURG, NY; small business) : $45,175 in 8 contractsfrom 2000 to 2006
Contracts for Maintenance, Repair or Alteration of Real Property -- Production Buildings, Maintenance, Repair or Alteration of Real Property -- Office Buildings, Maintenance, Repair or Alteration of Real Property -- Parking Facilities Conservation by Army Signed by year:2000: $12,383; 2001: $5,468; 2002: $6,486; 2003: $6,847; 2004: $4,178; 2005: $3,432; 2006: $6,381.
Biggest contracts:
$12,383 with Army for Maintenance, Repair or Alteration of Real Property -- Production Buildings. Signed on 2000-09-27. Completion date: 2000-10-30.
$6,847, same as above.Signed on 2003-05-14. Completion date: 2003-04-30.
$6,486 with Army for Maintenance, Repair or Alteration of Real Property -- Office Buildings. Signed on 2002-11-19. Completion date: 2002-11-29.
$6,095, same as above.Signed on 2006-03-06. Completion date: 2006-04-05.
TONOGA INC (136 COON BROOK RD in PETERSBURGH, NY; small business) : $9,923 in 3 contractsin 2005
$7,118 with Air Force for Circuit Breakers. Signed on 2005-03-21. Completion date: 2005-04-01.
$2,865 with Navy for Miscellaneous Items. Signed on 2005-03-11. Completion date: 2005-04-01.
-$60, same as above.Signed on 2005-04-19. Completion date: 2005-04-01.
Top industries in this zip code by the number of employees in 2005:
Accommodation and Food Services: Full-Service Restaurants (5-9 employees: 1 establishment)
Construction: Plumbing, Heating, and Air-Conditioning Contractors (1-4: 2)
Professional, Scientific, and Technical Services: Computer Systems Design Services (1-4: 1)
Construction: Site Preparation Contractors (1-4: 1)
Construction: Electrical Contractors (1-4: 1)
Construction: New Single-Family Housing Construction (except Operative Builders) (1-4: 1)
Professional, Scientific, and Technical Services: Public Relations Agencies (1-4: 1)
Real Estate and Rental and Leasing: Lessors of Residential Buildings and Dwellings (1-4: 1)
People in group quarters in 2000:
3 people in nursing homes
Fatal accident statistics in 2012:
Fatal accident count: 1
Vehicles involved in fatal accidents: 1
Fatal accidents caused by drunken drivers: 0
Fatalities: 1
Persons involved in fatal accidents: 1
Pedestrians involved in fatal accidents: 0
Home Mortgage Disclosure Act Aggregated Statistics For Year 2009 (Based on 2 full and 6 partial tracts)
A) FHA, FSA/RHS & VA Home Purchase Loans
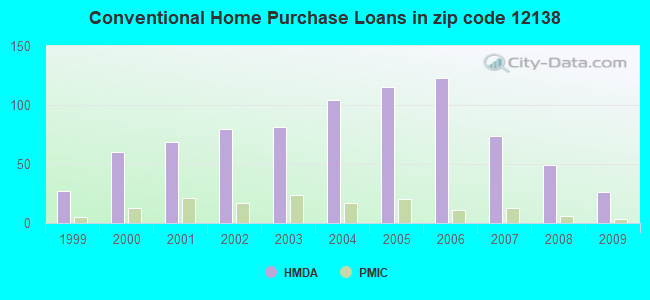
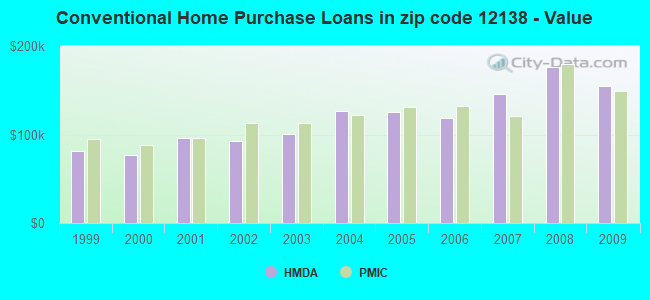
B) Conventional Home Purchase Loans
C) Refinancings
D) Home Improvement Loans
F) Non-occupant Loans on < 5 Family Dwellings (A B C & D)
G) Loans On Manufactured Home Dwelling (A B C & D)
Number
Average Value
Number
Average Value
Number
Average Value
Number
Average Value
Number
Average Value
Number
Average Value
LOANS ORIGINATED
19
$154,258
26
$154,393
135
$140,817
16
$41,462
12
$146,676
4
$115,740
APPLICATIONS APPROVED, NOT ACCEPTED
2
$128,535
2
$109,595
18
$158,627
6
$10,090
1
$87,720
1
$111,260
APPLICATIONS DENIED
6
$152,703
12
$118,450
61
$164,051
16
$45,772
5
$116,240
8
$152,008
APPLICATIONS WITHDRAWN
3
$139,730
4
$119,062
34
$160,864
3
$24,737
1
$85,580
0
$0
FILES CLOSED FOR INCOMPLETENESS
0
$0
1
$152,980
12
$162,502
0
$0
0
$0
0
$0
Aggregated Statistics For Year 2008 (Based on 2 full and 6 partial tracts)
A) FHA, FSA/RHS & VA Home Purchase Loans
B) Conventional Home Purchase Loans
C) Refinancings
D) Home Improvement Loans
F) Non-occupant Loans on < 5 Family Dwellings (A B C & D)
G) Loans On Manufactured Home Dwelling (A B C & D)
Number
Average Value
Number
Average Value
Number
Average Value
Number
Average Value
Number
Average Value
Number
Average Value
LOANS ORIGINATED
21
$127,520
49
$176,813
88
$123,793
28
$49,626
15
$154,045
6
$87,302
APPLICATIONS APPROVED, NOT ACCEPTED
3
$148,070
17
$152,313
20
$140,882
1
$101,500
8
$130,486
6
$61,722
APPLICATIONS DENIED
3
$196,400
13
$98,893
85
$152,216
23
$42,799
3
$84,047
11
$88,768
APPLICATIONS WITHDRAWN
2
$298,275
5
$128,856
39
$172,094
3
$58,983
1
$178,040
4
$174,000
FILES CLOSED FOR INCOMPLETENESS
2
$43,000
1
$65,570
9
$116,906
1
$150,840
2
$73,355
2
$149,000
Aggregated Statistics For Year 2007 (Based on 2 full and 6 partial tracts)
A) FHA, FSA/RHS & VA Home Purchase Loans
B) Conventional Home Purchase Loans
C) Refinancings
D) Home Improvement Loans
F) Non-occupant Loans on < 5 Family Dwellings (A B C & D)
G) Loans On Manufactured Home Dwelling (A B C & D)
Number
Average Value
Number
Average Value
Number
Average Value
Number
Average Value
Number
Average Value
Number
Average Value
LOANS ORIGINATED
15
$120,231
74
$145,367
120
$138,795
35
$45,052
14
$188,099
14
$61,356
APPLICATIONS APPROVED, NOT ACCEPTED
1
$113,920
8
$118,072
33
$124,120
8
$35,892
1
$162,380
0
$0
APPLICATIONS DENIED
5
$125,022
31
$86,416
104
$119,200
31
$42,018
0
$0
8
$107,806
APPLICATIONS WITHDRAWN
2
$119,965
13
$133,852
44
$115,732
7
$69,711
3
$30,283
0
$0
FILES CLOSED FOR INCOMPLETENESS
2
$86,000
4
$150,472
15
$169,911
1
$100,250
1
$267,450
0
$0
Aggregated Statistics For Year 2006 (Based on 2 full and 6 partial tracts)
A) FHA, FSA/RHS & VA Home Purchase Loans
B) Conventional Home Purchase Loans
C) Refinancings
D) Home Improvement Loans
F) Non-occupant Loans on < 5 Family Dwellings (A B C & D)
G) Loans On Manufactured Home Dwelling (A B C & D)
Number
Average Value
Number
Average Value
Number
Average Value
Number
Average Value
Number
Average Value
Number
Average Value
LOANS ORIGINATED
12
$147,726
123
$118,552
149
$117,733
43
$48,849
27
$106,849
17
$83,453
APPLICATIONS APPROVED, NOT ACCEPTED
0
$0
14
$105,643
27
$131,627
12
$43,189
3
$109,120
5
$53,402
APPLICATIONS DENIED
0
$0
37
$83,109
115
$111,894
58
$45,594
12
$57,658
20
$61,338
APPLICATIONS WITHDRAWN
7
$114,613
17
$120,344
65
$117,081
8
$85,742
1
$94,140
1
$28,690
FILES CLOSED FOR INCOMPLETENESS
1
$71,310
7
$162,001
23
$130,036
2
$69,570
0
$0
0
$0
Aggregated Statistics For Year 2005 (Based on 2 full and 6 partial tracts)
A) FHA, FSA/RHS & VA Home Purchase Loans
B) Conventional Home Purchase Loans
C) Refinancings
D) Home Improvement Loans
E) Loans on Dwellings For 5+ Families
F) Non-occupant Loans on < 5 Family Dwellings (A B C & D)
G) Loans On Manufactured Home Dwelling (A B C & D)
Number
Average Value
Number
Average Value
Number
Average Value
Number
Average Value
Number
Average Value
Number
Average Value
Number
Average Value
LOANS ORIGINATED
9
$138,941
115
$125,912
171
$109,503
42
$40,772
1
$171,170
17
$101,082
14
$72,361
APPLICATIONS APPROVED, NOT ACCEPTED
1
$85,580
26
$138,815
17
$99,206
10
$36,104
0
$0
1
$40,980
5
$67,868
APPLICATIONS DENIED
2
$153,035
33
$110,847
150
$88,742
40
$57,634
0
$0
6
$103,577
30
$81,407
APPLICATIONS WITHDRAWN
3
$123,753
13
$160,025
74
$123,001
14
$134,631
0
$0
4
$83,030
4
$98,682
FILES CLOSED FOR INCOMPLETENESS
0
$0
7
$154,924
17
$102,874
0
$0
0
$0
1
$72,750
0
$0
Aggregated Statistics For Year 2004 (Based on 2 full and 6 partial tracts)
A) FHA, FSA/RHS & VA Home Purchase Loans
B) Conventional Home Purchase Loans
C) Refinancings
D) Home Improvement Loans
E) Loans on Dwellings For 5+ Families
F) Non-occupant Loans on < 5 Family Dwellings (A B C & D)
G) Loans On Manufactured Home Dwelling (A B C & D)
Number
Average Value
Number
Average Value
Number
Average Value
Number
Average Value
Number
Average Value
Number
Average Value
Number
Average Value
LOANS ORIGINATED
16
$109,948
104
$126,904
153
$99,369
43
$40,327
0
$0
11
$92,885
11
$64,645
APPLICATIONS APPROVED, NOT ACCEPTED
0
$0
24
$96,847
32
$78,884
6
$21,760
0
$0
6
$57,862
3
$47,363
APPLICATIONS DENIED
1
$79,010
20
$73,977
124
$82,620
25
$33,457
0
$0
0
$0
21
$60,378
APPLICATIONS WITHDRAWN
1
$158,330
12
$129,937
116
$97,795
5
$36,416
2
$42,210
3
$163,707
3
$74,347
FILES CLOSED FOR INCOMPLETENESS
0
$0
6
$94,705
15
$118,703
1
$37,670
0
$0
0
$0
0
$0
Aggregated Statistics For Year 2003 (Based on 2 full and 6 partial tracts)
A) FHA, FSA/RHS & VA Home Purchase Loans
B) Conventional Home Purchase Loans
C) Refinancings
D) Home Improvement Loans
F) Non-occupant Loans on < 5 Family Dwellings (A B C & D)
Number
Average Value
Number
Average Value
Number
Average Value
Number
Average Value
Number
Average Value
LOANS ORIGINATED
13
$104,715
81
$100,812
215
$96,666
13
$24,445
10
$105,914
APPLICATIONS APPROVED, NOT ACCEPTED
1
$55,730
9
$132,927
45
$97,383
3
$35,473
4
$115,442
APPLICATIONS DENIED
3
$38,087
18
$70,656
139
$86,715
21
$22,298
5
$72,616
APPLICATIONS WITHDRAWN
1
$144,250
6
$124,207
94
$99,846
0
$0
2
$48,000
FILES CLOSED FOR INCOMPLETENESS
0
$0
2
$97,650
12
$129,777
1
$61,970
0
$0
Aggregated Statistics For Year 2002 (Based on 2 full and 6 partial tracts)
A) FHA, FSA/RHS & VA Home Purchase Loans
B) Conventional Home Purchase Loans
C) Refinancings
D) Home Improvement Loans
F) Non-occupant Loans on < 5 Family Dwellings (A B C & D)
Number
Average Value
Number
Average Value
Number
Average Value
Number
Average Value
Number
Average Value
LOANS ORIGINATED
14
$94,705
80
$92,222
183
$76,369
38
$37,517
14
$81,228
APPLICATIONS APPROVED, NOT ACCEPTED
0
$0
20
$75,714
35
$91,121
4
$27,058
1
$125,400
APPLICATIONS DENIED
2
$101,920
21
$61,827
96
$77,813
20
$25,281
4
$50,362
APPLICATIONS WITHDRAWN
2
$105,970
2
$67,990
61
$88,863
0
$0
1
$144,420
FILES CLOSED FOR INCOMPLETENESS
0
$0
1
$75,890
12
$74,327
0
$0
0
$0
Aggregated Statistics For Year 2001 (Based on 2 full and 6 partial tracts)
A) FHA, FSA/RHS & VA Home Purchase Loans
B) Conventional Home Purchase Loans
C) Refinancings
D) Home Improvement Loans
F) Non-occupant Loans on < 5 Family Dwellings (A B C & D)
Number
Average Value
Number
Average Value
Number
Average Value
Number
Average Value
Number
Average Value
LOANS ORIGINATED
20
$93,553
69
$95,961
137
$81,562
36
$23,916
12
$56,815
APPLICATIONS APPROVED, NOT ACCEPTED
2
$72,000
11
$45,337
25
$81,350
6
$28,022
0
$0
APPLICATIONS DENIED
1
$125,760
26
$51,108
82
$66,541
19
$17,655
2
$111,385
APPLICATIONS WITHDRAWN
2
$124,140
9
$74,223
34
$70,254
16
$23,427
4
$54,940
FILES CLOSED FOR INCOMPLETENESS
0
$0
0
$0
12
$52,499
1
$7,110
0
$0
Aggregated Statistics For Year 2000 (Based on 2 full and 6 partial tracts)
A) FHA, FSA/RHS & VA Home Purchase Loans
B) Conventional Home Purchase Loans
C) Refinancings
D) Home Improvement Loans
F) Non-occupant Loans on < 5 Family Dwellings (A B C & D)
Number
Average Value
Number
Average Value
Number
Average Value
Number
Average Value
Number
Average Value
LOANS ORIGINATED
21
$72,142
60
$76,279
67
$68,857
36
$22,153
7
$60,707
APPLICATIONS APPROVED, NOT ACCEPTED
0
$0
7
$44,390
27
$64,132
10
$14,919
1
$33,500
APPLICATIONS DENIED
5
$90,508
21
$48,231
93
$56,678
13
$18,430
2
$51,570
APPLICATIONS WITHDRAWN
1
$107,900
5
$136,388
48
$55,069
6
$31,132
2
$33,880
FILES CLOSED FOR INCOMPLETENESS
0
$0
1
$117,680
5
$69,796
1
$10,700
0
$0
Aggregated Statistics For Year 1999 (Based on 1 full and 3 partial tracts)
A) FHA, FSA/RHS & VA Home Purchase Loans
B) Conventional Home Purchase Loans
C) Refinancings
D) Home Improvement Loans
F) Non-occupant Loans on < 5 Family Dwellings (A B C & D)

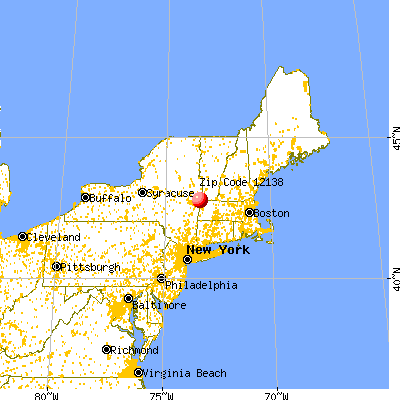


 Nearest zip codes: 12022, 12052, 12040, 05260, 12090, 12089.