Estimated zip code population in 2022: 1,942 Zip code population in 2010: 1,568 Zip code population in 2000: 1,000
Houses and condos: 932 Renter-occupied apartments: 40
% of renters here:
6%
State:
46%
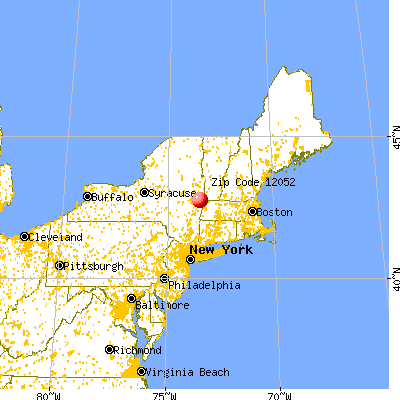
March 2022 cost of living index in zip code 12052: 95.5 (near average, U.S. average is 100)
Land area: 30.3 sq. mi. Water area: 1.0 sq. mi.
Population density: 64 people per square mile
(very low).
OSM Map
General Map
Google Map
MSN Map
OSM Map
General Map
Google Map
MSN Map
OSM Map
General Map
Google Map
MSN Map
OSM Map
General Map
Google Map
MSN Map
Please wait while loading the map...
Real estate property taxes paid for housing units in 2022:
This zip code:
1.9% ($4,492)
New York:
1.5% ($6,180)
Median real estate property taxes paid for housing units with mortgages in 2022: $5,563 (2.0%) Median real estate property taxes paid for housing units with no mortgage in 2022: $2,754 (1.4%)
Business Search- 14 Million verified businesses
Males: 891
(45.9%)
Females: 1,050
(54.1%)
For population 25 years and over in 12052:
High school or higher: 95.8%
Bachelor's degree or higher: 29.2%
Graduate or professional degree: 16.4%
Unemployed: 3.2%
Mean travel time to work (commute): 27.9 minutes
For population 15 years and over in 12052:
Never married: 29.3%
Now married: 56.8%
Separated: 2.1%
Widowed: 3.4%
Divorced: 8.3%
Zip code 12052 compared to state average:
Median house value below state average.
Black race population percentage significantly below state average.
Hispanic race population percentage significantly below state average.
Median age significantly above state average.
Foreign-born population percentage significantly below state average.
Renting percentage significantly below state average.
Length of stay since moving in significantly above state average.
Averages for the 2020 tax year for zip code 12052, filed in 2021:
Average Adjusted Gross Income (AGI) in 2020: $69,444 (Individual Income Tax Returns)
Here:
$69,444
State:
$90,930
Salary/wage: $65,629 (reported on 78.8% of returns)
Here:
$65,629
State:
$72,104
(% of AGI for various income ranges: 1081.8% for AGIs below $25k, 3923.8% for AGIs $25k-50k, 6765.0% for AGIs $50k-75k, 10231.4% for AGIs $75k-100k, 14855.5% for AGIs $100k-200k)
Taxable interest for individuals: $366 (reported on 40.0% of returns)
This zip code:
$366
New York:
$3,075
(% of AGI for various income ranges: 12.7% for AGIs below $25k, 13.1% for AGIs $25k-50k, 8.0% for AGIs $50k-75k, 14.3% for AGIs $75k-100k, 61.8% for AGIs $100k-200k)
Ordinary dividends: $2,407 (reported on 17.5% of returns)
Here:
$2,407
State:
$11,095
(% of AGI for various income ranges: 32.7% for AGIs below $25k, 100.0% for AGIs $50k-75k, 182.7% for AGIs $100k-200k)
Net capital gain/loss in AGI: +$8,358 (reported on 15.0% of returns)
Here:
+$8,358
State:
+$44,925
(% of AGI for various income ranges: 20.0% for AGIs below $25k, 166.0% for AGIs $50k-75k, 740.9% for AGIs $100k-200k)
Profit/loss from business: +$7,678 (reported on 11.2% of returns)
Here:
+$7,678
State:
+$14,940
(% of AGI for various income ranges: 236.4% for AGIs below $25k, 66.0% for AGIs $50k-75k, 331.8% for AGIs $100k-200k)
Taxable individual retirement arrangement distribution: $18,171 (reported on 8.8% of returns)
12052:
$18,171
New York:
$19,609
(% of AGI for various income ranges: 179.1% for AGIs below $25k, 225.0% for AGIs $50k-75k, 772.7% for AGIs $100k-200k)
Total itemized deductions: $19,880 (reported on 6.2% of returns)
Here:
$19,880
State:
$39,326
(% of AGI for various income ranges: 1420.0% for AGIs $75k-100k)
Charity contributions: $3,267 (reported on 3.8% of returns)
Here:
$3,267
State:
$15,420
(% of AGI for various income ranges: 140.0% for AGIs $75k-100k)
Taxes paid: $7,660 (reported on 6.2% of returns)
12052:
$7,660
State:
$9,183
(% of AGI for various income ranges: 547.1% for AGIs $75k-100k)
Earned income credit: $2,033 (reported on 7.5% of returns)
Here:
$2,033
State:
$2,138
(% of AGI for various income ranges: 53.6% for AGIs below $25k, 48.5% for AGIs $25k-50k)
Percentage of individuals using paid preparers for their 2020 taxes: 92.5%
Here:
92%
State:
95%
(% for various income ranges: 94.4% for AGIs below $25k, 89.5% for AGIs $25k-50k, 92.9% for AGIs $50k-75k, 90.9% for AGIs $75k-100k, 93.8% for AGIs $100k-200k, 100.0% for AGIs over 200k)
Averages for the 2012 tax year for zip code 12052, filed in 2013:
Average Adjusted Gross Income (AGI) in 2012: $55,314 (Individual Income Tax Returns)
Here:
$55,314
State:
$77,088
Salary/wage: $51,834 (reported on 84.9% of returns)
Here:
$51,834
State:
$60,593
(% of AGI for various income ranges: 71.5% for AGIs below $25k, 77.2% for AGIs $25k-50k, 72.2% for AGIs $50k-75k, 81.5% for AGIs $75k-100k, 85.2% for AGIs $100k-200k)
Taxable interest for individuals: $323 (reported on 41.1% of returns)
This zip code:
$323
New York:
$3,125
(% of AGI for various income ranges: 0.2% for AGIs below $25k, 0.3% for AGIs $25k-50k, 0.4% for AGIs $50k-75k, 0.2% for AGIs $100k-200k)
Ordinary dividends: $1,700 (reported on 17.8% of returns)
Here:
$1,700
State:
$10,299
(% of AGI for various income ranges: 0.6% for AGIs $25k-50k, 1.1% for AGIs $50k-75k, 0.3% for AGIs $75k-100k, 0.4% for AGIs $100k-200k)
Net capital gain/loss in AGI: +$1,525 (reported on 11.0% of returns)
Here:
+$1,525
State:
+$42,474
(% of AGI for various income ranges: 0.3% for AGIs below $25k, 0.9% for AGIs $50k-75k, 0.5% for AGIs $75k-100k)
Profit/loss from business: +$10,000 (reported on 12.3% of returns)
Here:
+$10,000
State:
+$16,168
(% of AGI for various income ranges: 4.7% for AGIs $25k-50k, 4.5% for AGIs $50k-75k, 2.5% for AGIs $75k-100k)
Taxable individual retirement arrangement distribution: $10,240 (reported on 6.8% of returns)
12052:
$10,240
New York:
$17,621
Total itemized deductions: $17,824 (21% of AGI, reported on 39.7% of returns)
Here:
$17,824
State:
$34,985
Here:
20.9% of AGI
State:
21.3% of AGI
(% of AGI for various income ranges: 13.2% for AGIs $25k-50k, 12.6% for AGIs $50k-75k, 13.7% for AGIs $75k-100k, 14.2% for AGIs $100k-200k)
Charity contributions: $1,918 (reported on 30.1% of returns)
Here:
$1,918
State:
$5,572
(% of AGI for various income ranges: 0.6% for AGIs $25k-50k, 1.6% for AGIs $50k-75k, 1.2% for AGIs $75k-100k, 1.0% for AGIs $100k-200k)
Taxes paid: $8,693 (reported on 39.7% of returns)
12052:
$8,693
State:
$18,656
(% of AGI for various income ranges: 4.7% for AGIs $25k-50k, 5.5% for AGIs $50k-75k, 6.3% for AGIs $75k-100k, 8.3% for AGIs $100k-200k)
Earned income credit: $1,729 (reported on 9.6% of returns)
Here:
$1,729
State:
$2,230
(% of AGI for various income ranges: 2.8% for AGIs below $25k, 0.9% for AGIs $25k-50k)
Percentage of individuals using paid preparers for their 2012 taxes: 49.3%
Here:
49%
State:
66%
(% for various income ranges: 35.0% for AGIs below $25k, 50.0% for AGIs $25k-50k, 64.3% for AGIs $50k-75k, 50.0% for AGIs $75k-100k, 54.5% for AGIs $100k-200k)
Averages for the 2004 tax year for zip code 12052, filed in 2005:
Average Adjusted Gross Income (AGI) in 2004: $45,041 (Individual Income Tax Returns)
Here:
$45,041
State:
$59,519
Salary/wage: $42,706 (reported on 87.3% of returns)
Here:
$42,706
State:
$50,673
(% of AGI for various income ranges: 102.8% for AGIs below $10k, 77.9% for AGIs $10k-25k, 80.1% for AGIs $25k-50k, 80.4% for AGIs $50k-75k, 88.0% for AGIs $75k-100k, 83.5% for AGIs over 100k)
Taxable interest for individuals: $609 (reported on 56.6% of returns)
This zip code:
$609
New York:
$2,377
(% of AGI for various income ranges: 2.3% for AGIs below $10k, 0.7% for AGIs $10k-25k, 0.6% for AGIs $25k-50k, 1.6% for AGIs $50k-75k, 0.3% for AGIs $75k-100k, 0.3% for AGIs over 100k)
Taxable dividends: $795 (reported on 26.0% of returns)
Here:
$795
State:
$5,394
(% of AGI for various income ranges: 4.4% for AGIs below $10k, 1.0% for AGIs $10k-25k, 0.5% for AGIs $25k-50k, 0.3% for AGIs $50k-75k, 0.3% for AGIs $75k-100k, 0.4% for AGIs over 100k)
Profit/loss from business: +$9,264 (reported on 14.3% of returns)
Here:
+$9,264
State:
+$13,809
(% of AGI for various income ranges: 2.8% for AGIs below $10k, 5.0% for AGIs $10k-25k, 2.9% for AGIs $25k-50k, 3.3% for AGIs $50k-75k, 4.7% for AGIs $75k-100k)
IRA payment deduction: $2,143 (reported on 2.2% of returns)
12052:
$2,143
New York:
$3,115
Total itemized deductions: $15,106 (21% of AGI, reported on 39.8% of returns)
Here:
$15,106
State:
$25,864
Here:
20.8% of AGI
State:
21.9% of AGI
(% of AGI for various income ranges: 9.1% for AGIs $10k-25k, 11.6% for AGIs $25k-50k, 14.1% for AGIs $50k-75k, 14.8% for AGIs $75k-100k, 15.1% for AGIs over 100k)
Charity contributions deductions: $1,796 (2% of AGI, reported on 36.1% of returns)
Here:
$1,796
State:
$4,439
Here:
2.4% of AGI
State:
3.6% of AGI
(% of AGI for various income ranges: 1.3% for AGIs below $10k, 0.9% for AGIs $25k-50k, 1.7% for AGIs $50k-75k, 1.7% for AGIs $75k-100k, 1.8% for AGIs over 100k)
Total tax: $5,667 (reported on 79.6% of returns)
12052:
$5,667
State:
$11,730
(% of AGI for various income ranges: 3.8% for AGIs below $10k, 4.5% for AGIs $10k-25k, 7.2% for AGIs $25k-50k, 9.3% for AGIs $50k-75k, 10.6% for AGIs $75k-100k, 15.4% for AGIs over 100k)
Earned income credit: $1,415 (reported on 10.2% of returns)
Here:
$1,415
State:
$1,757
Percentage of individuals using paid preparers for their 2004 taxes: 55.8%
Here:
56%
State:
67%
(% for various income ranges: 52.3% for AGIs below $10k, 56.7% for AGIs $10k-25k, 57.8% for AGIs $25k-50k, 55.4% for AGIs $50k-75k, 57.5% for AGIs $75k-100k, 53.2% for AGIs over 100k)
Household received Food Stamps/SNAP in the past 12 months: 62 Household did not receive Food Stamps/SNAP in the past 12 months: 647
Women who had a birth in the past 12 months: 36 (36 now married, 0 unmarried) Women who did not have a birth in the past 12 months: 470 (123 now married, 349 unmarried)
Housing units in zip code 12052 with a mortgage: 418 (14 second mortgage, 14 both second mortgage and home equity loan) Houses without a mortgage: 43
Median monthly owner costs for units with a mortgage: $1,766 Median monthly owner costs for units without a mortgage: $614
Residents with income below the poverty level in 2022:
This zip code:
5.8%
Whole state:
14.3%
Residents with income below 50% of the poverty level in 2022:
This zip code:
4.4%
Whole state:
6.8%
Median number of rooms in houses and condos:
Here:
6.4
State:
6.3
Median number of rooms in apartments:
Here:
5.5
State:
3.8
Notable locations in this zip code not listed on our city pages
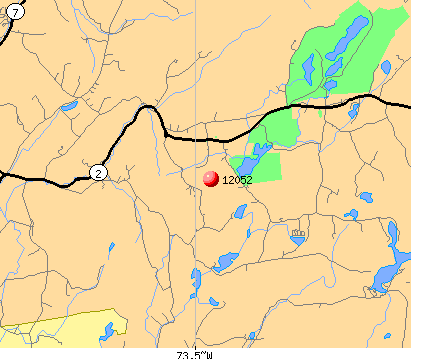
Lakes and reservoirs: Long Pond (A), Second Pond (B), South Long Pond (C), Taconic Pond (D), White Lily Pond (E), Bernie Pond (F), Bonesteel Pond (G), Cranberry Pond (H). Display/hide their locations on the map
Size of family households: 298 2-persons, 91 3-persons, 54 4-persons, 76 5-persons, 6 7-or-more-persons
Size of nonfamily households: 148 1-person, 40 2-persons
351 married couples with children.
30 single-parent households (7 men, 23 women).
99.9% of residents of 12052 zip code speak English at home.
Foreign born population: 16 (0.8%) (100.0% of them are naturalized citizens)
This zip code:
0.8%
Whole state:
22.7%
100%France
58%Irish
17%German
9%Italian
5%English
2%French
2%Ukrainian
2%American
Year of entry for the foreign-born population
02010 or later
02000 to 2009
01990 to 1999
25Before 1990
Facilities with environmental interests located in this zip code:
GRAFTON ES ( in CROPSEYVILLE, NY)
(National Center for Education Statistics) - STATE ID-490101040002 Organizations: BERLIN CSD (SCHOOL DISTRICT)
Housing units lacking complete plumbing facilities: 4.8% Housing units lacking complete kitchen facilities: 4.1%
44.0%Fuel oil, kerosene, etc.
22.8%Wood
17.8%Bottled, tank, or LP gas
13.0%Electricity
2.9%Other fuel
Population in 1990: 1,339.
Place of birth for U.S.-born residents:
This state: 1,720
Northeast: 149
Midwest: 17
South: 17
West: 3
71% of the 12052 zip code residents lived in the same house 5 years ago. Out of people who lived in different houses, 68% lived in this county. Out of people who lived in different counties, 50% lived in New York.
96% of the 12052 zip code residents lived in the same house 1 year ago. Out of people who lived in different houses, 64% moved from this county. Out of people who lived in different houses, 18% moved from different county within same state. Out of people who lived in different houses, 13% moved from different state.
Private vs. public school enrollment:
Students in private schools in grades 1 to 8 (elementary and middle school):
Here:
0.0%
New York:
15.6%
Students in private schools in grades 9 to 12 (high school):
Here:
0.0%
New York:
15.0%
Students in private undergraduate colleges: 9
Here:
9.9%
New York:
39.2%
Occupation by median earnings in the past 12 months ($)
114,769Architecture and engineering occupations
112,062Life, physical, and social science occupations
74,623Construction and extraction occupations
69,365Transportation occupations
66,958Business and financial operations occupations
66,951Sales and related occupations
Top industries in this zip code by the number of employees in 2005:
Health Care and Social Assistance: Services for the Elderly and Persons with Disabilities (50-99 employees: 1 establishment)
Health Care and Social Assistance: Offices of Physicians (except Mental Health Specialists) (20-49: 2)
Mining: Crushed and Broken Limestone Mining and Quarrying (5-9: 1)
Other Services (except Public Administration): Religious Organizations (1-4: 1)
Construction: Highway, Street, and Bridge Construction (1-4: 1)
Administrative and Support and Waste Management and Remediation Services: Other Waste Collection (1-4: 1)
Construction: Masonry Contractors (1-4: 1)
Accommodation and Food Services: Limited-Service Restaurants (1-4: 1)
Fatal accident statistics in 2014:
Fatal accident count: 1
Vehicles involved in fatal accidents: 1
Fatal accidents caused by drunken drivers: 0
Fatalities: 1
Persons involved in fatal accidents: 1
Pedestrians involved in fatal accidents: 0
Fatal accident statistics in 2013:
Fatal accident count: 1
Vehicles involved in fatal accidents: 1
Fatal accidents caused by drunken drivers: 0
Fatalities: 1
Persons involved in fatal accidents: 1
Pedestrians involved in fatal accidents: 0
Home Mortgage Disclosure Act Aggregated Statistics For Year 2009 (Based on 2 partial tracts)
A) FHA, FSA/RHS & VA Home Purchase Loans
B) Conventional Home Purchase Loans
C) Refinancings
D) Home Improvement Loans
F) Non-occupant Loans on < 5 Family Dwellings (A B C & D)
G) Loans On Manufactured Home Dwelling (A B C & D)
Number
Average Value
Number
Average Value
Number
Average Value
Number
Average Value
Number
Average Value
Number
Average Value
LOANS ORIGINATED
5
$178,800
10
$184,879
40
$146,012
4
$82,248
7
$140,869
1
$112,640
APPLICATIONS APPROVED, NOT ACCEPTED
1
$127,840
1
$73,310
5
$187,918
0
$0
1
$73,310
1
$92,980
APPLICATIONS DENIED
3
$115,327
3
$116,220
20
$192,120
5
$58,288
4
$94,540
1
$113,540
APPLICATIONS WITHDRAWN
1
$126,950
2
$107,280
11
$150,924
0
$0
1
$71,520
0
$0
FILES CLOSED FOR INCOMPLETENESS
0
$0
1
$127,840
3
$229,163
0
$0
0
$0
0
$0
Aggregated Statistics For Year 2008 (Based on 2 partial tracts)
A) FHA, FSA/RHS & VA Home Purchase Loans
B) Conventional Home Purchase Loans
C) Refinancings
D) Home Improvement Loans
F) Non-occupant Loans on < 5 Family Dwellings (A B C & D)
G) Loans On Manufactured Home Dwelling (A B C & D)
Number
Average Value
Number
Average Value
Number
Average Value
Number
Average Value
Number
Average Value
Number
Average Value
LOANS ORIGINATED
8
$138,122
14
$163,283
28
$140,262
9
$62,381
6
$180,737
3
$70,923
APPLICATIONS APPROVED, NOT ACCEPTED
1
$130,520
5
$171,648
6
$124,267
0
$0
2
$185,505
2
$66,155
APPLICATIONS DENIED
2
$185,950
5
$122,836
18
$173,436
6
$80,608
1
$117,110
2
$109,070
APPLICATIONS WITHDRAWN
1
$273,560
3
$98,340
8
$220,482
1
$1,790
1
$89,400
0
$0
FILES CLOSED FOR INCOMPLETENESS
0
$0
0
$0
2
$103,255
1
$126,050
0
$0
0
$0
Aggregated Statistics For Year 2007 (Based on 2 partial tracts)
A) FHA, FSA/RHS & VA Home Purchase Loans
B) Conventional Home Purchase Loans
C) Refinancings
D) Home Improvement Loans
F) Non-occupant Loans on < 5 Family Dwellings (A B C & D)
G) Loans On Manufactured Home Dwelling (A B C & D)
Number
Average Value
Number
Average Value
Number
Average Value
Number
Average Value
Number
Average Value
Number
Average Value
LOANS ORIGINATED
2
$101,915
21
$165,475
34
$165,890
9
$41,024
4
$183,048
2
$71,075
APPLICATIONS APPROVED, NOT ACCEPTED
0
$0
2
$92,530
9
$163,106
2
$12,070
1
$82,250
0
$0
APPLICATIONS DENIED
1
$58,110
7
$84,674
28
$110,664
6
$39,932
0
$0
1
$160,920
APPLICATIONS WITHDRAWN
1
$126,050
4
$125,382
7
$114,816
2
$147,510
1
$58,110
0
$0
FILES CLOSED FOR INCOMPLETENESS
0
$0
3
$132,313
7
$171,903
0
$0
1
$223,500
0
$0
Aggregated Statistics For Year 2006 (Based on 2 partial tracts)
A) FHA, FSA/RHS & VA Home Purchase Loans
B) Conventional Home Purchase Loans
C) Refinancings
D) Home Improvement Loans
F) Non-occupant Loans on < 5 Family Dwellings (A B C & D)
G) Loans On Manufactured Home Dwelling (A B C & D)
Number
Average Value
Number
Average Value
Number
Average Value
Number
Average Value
Number
Average Value
Number
Average Value
LOANS ORIGINATED
4
$165,612
34
$126,396
46
$136,393
12
$54,459
10
$107,816
3
$51,853
APPLICATIONS APPROVED, NOT ACCEPTED
0
$0
4
$98,340
8
$200,368
4
$35,538
3
$91,187
1
$44,700
APPLICATIONS DENIED
0
$0
10
$102,899
34
$125,476
8
$36,878
3
$53,343
4
$77,778
APPLICATIONS WITHDRAWN
4
$106,610
3
$118,603
25
$105,420
2
$89,400
1
$78,670
0
$0
FILES CLOSED FOR INCOMPLETENESS
0
$0
2
$147,510
5
$178,442
1
$71,520
0
$0
0
$0
Aggregated Statistics For Year 2005 (Based on 2 partial tracts)
A) FHA, FSA/RHS & VA Home Purchase Loans
B) Conventional Home Purchase Loans
C) Refinancings
D) Home Improvement Loans
E) Loans on Dwellings For 5+ Families
F) Non-occupant Loans on < 5 Family Dwellings (A B C & D)
G) Loans On Manufactured Home Dwelling (A B C & D)
Number
Average Value
Number
Average Value
Number
Average Value
Number
Average Value
Number
Average Value
Number
Average Value
Number
Average Value
LOANS ORIGINATED
1
$146,620
32
$124,042
54
$104,896
13
$32,528
1
$143,040
5
$98,518
2
$70,625
APPLICATIONS APPROVED, NOT ACCEPTED
1
$71,520
6
$157,792
8
$101,134
2
$71,965
0
$0
0
$0
1
$74,200
APPLICATIONS DENIED
0
$0
4
$104,150
50
$93,065
16
$65,262
0
$0
1
$40,230
11
$73,958
APPLICATIONS WITHDRAWN
1
$131,420
5
$204,904
28
$111,431
3
$97,147
0
$0
1
$37,550
2
$85,825
FILES CLOSED FOR INCOMPLETENESS
0
$0
4
$128,512
4
$76,885
0
$0
0
$0
1
$60,790
0
$0
Aggregated Statistics For Year 2004 (Based on 2 partial tracts)
A) FHA, FSA/RHS & VA Home Purchase Loans
B) Conventional Home Purchase Loans
C) Refinancings
D) Home Improvement Loans
F) Non-occupant Loans on < 5 Family Dwellings (A B C & D)
G) Loans On Manufactured Home Dwelling (A B C & D)
Number
Average Value
Number
Average Value
Number
Average Value
Number
Average Value
Number
Average Value
Number
Average Value
LOANS ORIGINATED
4
$142,818
26
$124,438
44
$90,192
10
$36,833
3
$57,513
1
$66,160
APPLICATIONS APPROVED, NOT ACCEPTED
0
$0
3
$137,973
8
$71,968
2
$24,585
0
$0
0
$0
APPLICATIONS DENIED
0
$0
4
$97,000
46
$80,654
6
$40,230
0
$0
3
$60,793
APPLICATIONS WITHDRAWN
1
$132,310
2
$77,330
33
$103,054
3
$22,053
1
$52,750
0
$0
FILES CLOSED FOR INCOMPLETENESS
0
$0
1
$109,960
2
$96,105
0
$0
0
$0
0
$0
Aggregated Statistics For Year 2003 (Based on 2 partial tracts)
A) FHA, FSA/RHS & VA Home Purchase Loans
B) Conventional Home Purchase Loans
C) Refinancings
D) Home Improvement Loans
F) Non-occupant Loans on < 5 Family Dwellings (A B C & D)
Number
Average Value
Number
Average Value
Number
Average Value
Number
Average Value
Number
Average Value
LOANS ORIGINATED
3
$78,673
28
$104,758
59
$97,476
4
$33,748
3
$92,977
APPLICATIONS APPROVED, NOT ACCEPTED
0
$0
1
$74,200
8
$129,295
2
$29,055
0
$0
APPLICATIONS DENIED
0
$0
4
$80,682
45
$88,943
4
$12,962
3
$56,620
APPLICATIONS WITHDRAWN
0
$0
3
$113,537
21
$89,740
0
$0
0
$0
FILES CLOSED FOR INCOMPLETENESS
0
$0
1
$89,400
5
$167,178
1
$46,490
0
$0
Aggregated Statistics For Year 2002 (Based on 2 partial tracts)
A) FHA, FSA/RHS & VA Home Purchase Loans
B) Conventional Home Purchase Loans
C) Refinancings
D) Home Improvement Loans
F) Non-occupant Loans on < 5 Family Dwellings (A B C & D)
Number
Average Value
Number
Average Value
Number
Average Value
Number
Average Value
Number
Average Value
LOANS ORIGINATED
4
$91,635
18
$96,949
55
$76,981
4
$35,090
5
$82,964
APPLICATIONS APPROVED, NOT ACCEPTED
0
$0
4
$71,742
8
$82,360
1
$1,790
0
$0
APPLICATIONS DENIED
0
$0
8
$69,620
21
$73,393
7
$34,610
3
$44,700
APPLICATIONS WITHDRAWN
2
$72,860
0
$0
24
$86,197
0
$0
1
$120,690
FILES CLOSED FOR INCOMPLETENESS
0
$0
0
$0
4
$95,210
0
$0
0
$0
Aggregated Statistics For Year 2001 (Based on 2 partial tracts)
A) FHA, FSA/RHS & VA Home Purchase Loans
B) Conventional Home Purchase Loans
C) Refinancings
D) Home Improvement Loans
F) Non-occupant Loans on < 5 Family Dwellings (A B C & D)
Number
Average Value
Number
Average Value
Number
Average Value
Number
Average Value
Number
Average Value
LOANS ORIGINATED
5
$108,890
24
$105,306
35
$84,879
9
$9,437
4
$68,168
APPLICATIONS APPROVED, NOT ACCEPTED
0
$0
3
$25,627
8
$80,795
0
$0
0
$0
APPLICATIONS DENIED
1
$76,880
9
$37,946
20
$64,681
4
$16,093
1
$36,650
APPLICATIONS WITHDRAWN
1
$75,990
3
$105,493
8
$81,242
3
$25,330
0
$0
FILES CLOSED FOR INCOMPLETENESS
0
$0
0
$0
1
$72,410
0
$0
0
$0
Aggregated Statistics For Year 2000 (Based on 2 partial tracts)
A) FHA, FSA/RHS & VA Home Purchase Loans
B) Conventional Home Purchase Loans
C) Refinancings
D) Home Improvement Loans
F) Non-occupant Loans on < 5 Family Dwellings (A B C & D)
Number
Average Value
Number
Average Value
Number
Average Value
Number
Average Value
Number
Average Value
LOANS ORIGINATED
6
$89,102
18
$79,019
21
$68,540
8
$14,304
4
$58,780
APPLICATIONS APPROVED, NOT ACCEPTED
0
$0
1
$9,830
9
$59,699
4
$11,398
0
$0
APPLICATIONS DENIED
2
$57,215
3
$54,533
29
$59,528
1
$7,150
1
$58,110
APPLICATIONS WITHDRAWN
1
$67,050
2
$202,045
16
$59,507
2
$17,880
1
$25,930
FILES CLOSED FOR INCOMPLETENESS
0
$0
1
$98,340
0
$0
1
$8,940
0
$0
Aggregated Statistics For Year 1999 (Based on 1 partial tract)
A) FHA, FSA/RHS & VA Home Purchase Loans
B) Conventional Home Purchase Loans
C) Refinancings
D) Home Improvement Loans
F) Non-occupant Loans on < 5 Family Dwellings (A B C & D)


 Nearest zip codes: 12140, 12138, 12180, 12153, 12185, 12018.