| Fire incidents reported |
|---|
| Sreet name | Count |
|---|
| STATE ROUTE 104 HWY | 42 | | COUNTY ROUTE 6 RD | 20 | | COUNTY ROUTE 1 RD | 16 | | STATE ROUTE 104 | 16 | | STATE ROUTE 104B HWY | 14 | | COUNTY ROUTE 64 | 12 | | GREEN ROAD RD | 12 | | LARKIN ROAD RD | 12 | | SUNDOWN RD | 12 | | CATFISH DR | 10 | | COUNTY ROUTE 1 | 10 | | COUNTY ROUTE 51 | 10 | | COUNTY ROUTE 51 RD | 10 | | COUNTY ROUTE 29 | 8 | | COUNTY ROUTE 35 RD | 8 | | COUNTY ROUTE 6 | 8 | | SUNDOWN ROAD RD | 8 | | WEST STONE ROAD RD | 8 | | CO RT 6 | 6 | | COUNTY ROUTE 35 | 6 | | COUNTY ROUTE 51A RD | 6 | | COUNTY ROUTE 64 RD | 6 | | DARROW RD | 6 | | DARROW ROAD RD | 6 | | CATFISH DRIVE | 4 |
| | | Fire incidents reported |
|---|
| Sreet name | Count |
|---|
| CATFISH DRIVE DR | 4 | | CO RT 64 | 4 | | CO. RT. 64 | 4 | | COUNTY ROUTE 176 | 4 | | COUNTY ROUTE 43 | 4 | | COUNTY ROUTE 43 RD | 4 | | COUNTY ROUTE 51A | 4 | | COUNTY RTE 64 | 4 | | JOHNSON ROAD RD | 4 | | LEVITT ROAD RD | 4 | | MIDDLE ROAD RD | 4 | | NINE MILE POINT RD | 4 | | OCONNOR RD | 4 | | POTTER RD | 4 | | ROUTE 64 | 4 | | STATE ROUTE 104B | 4 | | STONE RD | 4 | | WOOLSON ROAD RD | 4 | | ACADEMY STREET | 2 | | ALBRIGHT RD | 2 | | BOOTHE RD | 2 | | BURTON DRIVE DR | 2 | | CHAPMAN RD | 2 | | CHASE DRIVE DR | 2 | | CHURCH STREET | 2 |
|
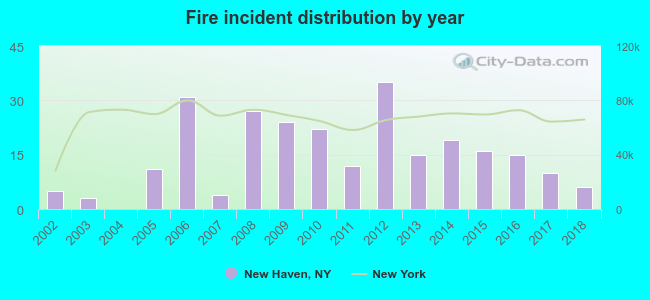 According to the data from the years 2002 - 2018 the average number of fire incidents per year is 15. The highest number of reported fire incidents - 35 took place in 2012, and the least - 0 in 2004. The data has a growing trend.
 31.8% incidents where reported in the morning and 68.2% in the evening. The most fires (18.0%) took place on Thursday, and the least (11.4%) on Friday.
 According to the 255 incident reports from years 2002 - 2018 most fires (20.0%) took place during March, and the least (2.7%) in August.
 Out of all 1,181 cases reported during the years 2002 - 2018, the most belonged to the categories: Rescue & EMS (51.5%), Fire (21.6%), and Hazardous Condition (10.9%).
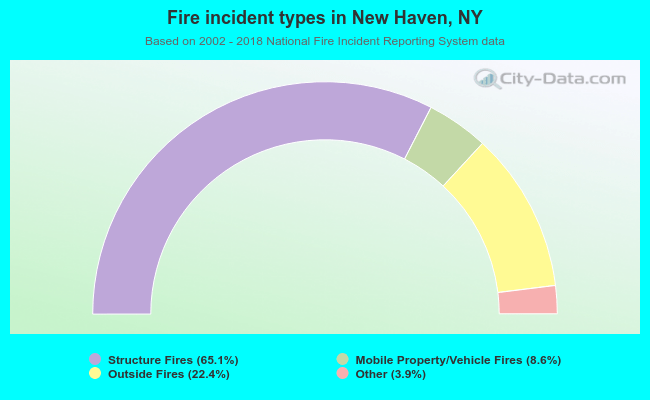 When looking into fire subcategories, the most reports belonged to: Structure Fires (65.1%), and Outside Fires (22.4%).