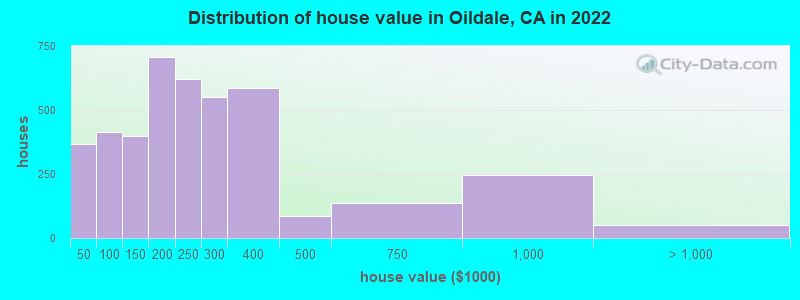
Estimated median house or condo value in 2022: $232,214 (it was $74,100 in 2000)
Oildale:
$232,214
CA:
$715,900
Mean prices in 2022:all housing units: $366,187; detached houses: $384,471; townhouses or other attached units: $303,616; in 2-unit structures: $562,075; in 3-to-4-unit structures: $224,286; in 5-or-more-unit structures: $262,914; mobile homes: $180,289; occupied boats, rvs, vans, etc.: $173,886
Median gross rent in 2022: $1,191.
March 2022 cost of living index in Oildale: 92.3 (less than average, U.S. average is 100)
Percentage of residents living in poverty in 2022: 29.1%
(28.4% for White Non-Hispanic residents, 35.1% for Black residents, 30.2% for Hispanic or Latino residents, 47.1% for American Indian residents, 30.1% for Native Hawaiian and other Pacific Islander residents, 27.6% for other race residents, 26.6% for two or more races residents)
Latest news from Oildale, CA collected exclusively by city-data.com from local newspapers, TV, and radio stations
Ancestries: American (9.3%), English (6.8%), German (4.3%), Scottish (3.8%), Irish (3.7%), Italian (2.2%).
Current Local Time: PST time zone
Elevation: 455 feet
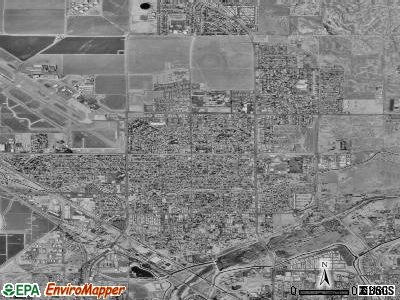
Land area: 6.44 square miles.
Population density: 5,078 people per square mile (average).
2,172 residents are foreign born (4.0% Latin America, 1.5% Asia).
This place:
6.2%
California:
26.5%
Median real estate property taxes paid for housing units with mortgages in 2022: $2,839 (1.0%) Median real estate property taxes paid for housing units with no mortgage in 2022: $1,393 (1.0%)
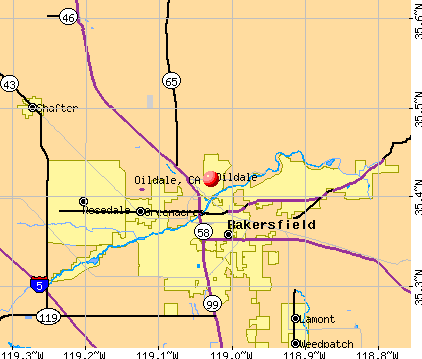
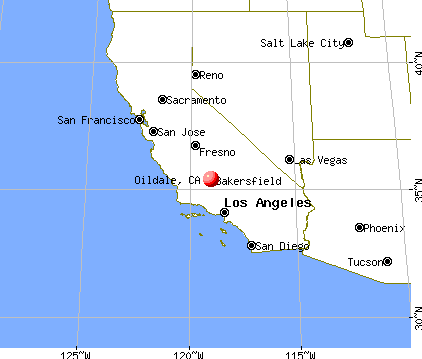
Nearest city with pop. 50,000+: Bakersfield, CA (4.3 miles , pop. 247,057).
Nearest city with pop. 1,000,000+: Los Angeles, CA (99.4 miles , pop. 3,694,820).
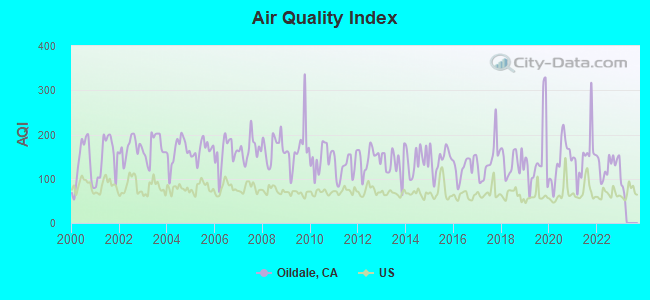
Air Quality Index (AQI) level in 2022 was 130. This is significantly worse than average.
City:
130
U.S.:
73
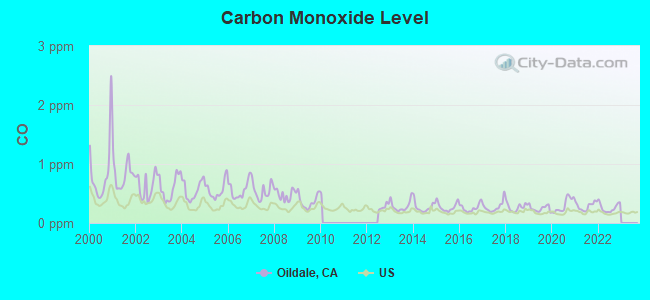
Carbon Monoxide (CO) [ppm] level in 2022 was 0.259. This is about average.Closest monitor was 1.4 miles away from the city center.
City:
0.259
U.S.:
0.251
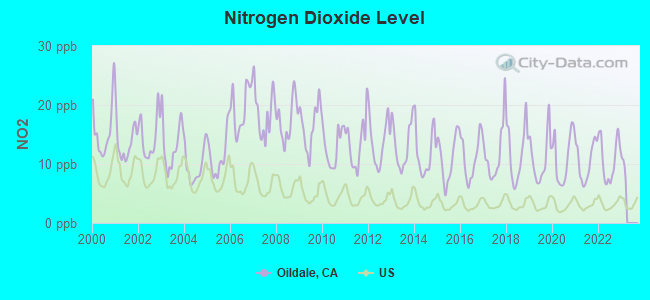
Nitrogen Dioxide (NO2) [ppb] level in 2022 was 10.8. This is significantly worse than average.Closest monitor was 1.3 miles away from the city center.
City:
10.8
U.S.:
5.1
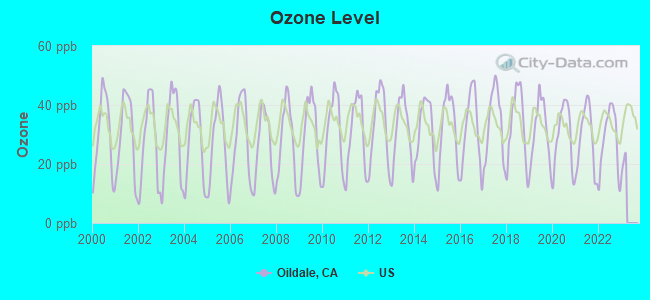
Ozone [ppb] level in 2022 was 28.2. This is about average.Closest monitor was 0.9 miles away from the city center.
City:
28.2
U.S.:
33.3
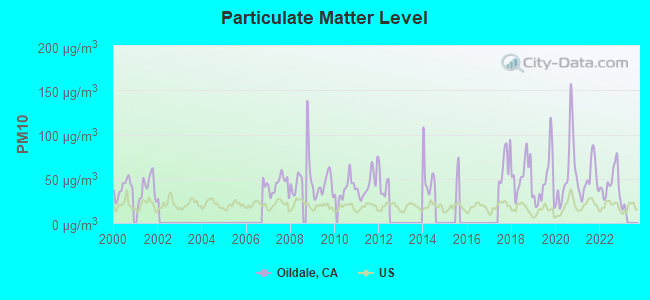
Particulate Matter (PM10) [µg/m3] level in 2022 was 45.0. This is significantly worse than average.Closest monitor was 1.4 miles away from the city center.
City:
45.0
U.S.:
19.2
Particulate Matter (PM2.5) [µg/m3] level in 2022 was 16.0. This is significantly worse than average.Closest monitor was 2.5 miles away from the city center.
City:
16.0
U.S.:
8.1
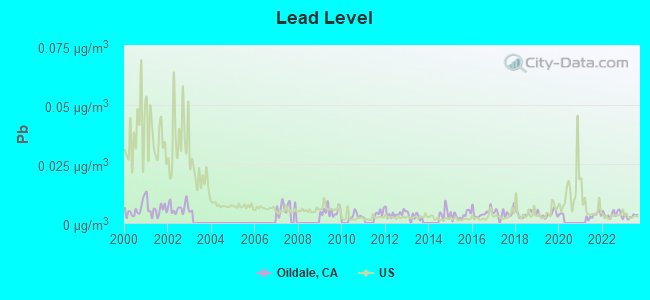
Lead (Pb) [µg/m3] level in 2023 was 0.00287. This is significantly better than average.Closest monitor was 0.9 miles away from the city center.
City:
0.00287
U.S.:
0.00931
Earthquake activity:
Oildale-area historical earthquake activity is significantly above California state average. It is 7811% greater than the overall U.S. average.
On 7/21/1952 at 11:52:14, a magnitude 7.7 (7.7 UK, Class: Major, Intensity: VIII - XII) earthquake occurred 29.1 miles away from Oildale center, causing $50,000,000 total damage On 11/4/1927 at 13:51:53, a magnitude 7.5 (7.5 UK) earthquake occurred 118.5 miles away from the city center On 6/28/1992 at 11:57:34, a magnitude 7.6 (6.2 MB, 7.6 MS, 7.3 MW, Depth: 0.7 mi) earthquake occurred 165.6 miles away from the city center, causing 3 deaths (1 shaking deaths, 2 other deaths) and 400 injuries, causing $100,000,000 total damage and $40,000,000 insured losses On 10/16/1999 at 09:46:44, a magnitude 7.4 (6.3 MB, 7.4 MS, 7.2 MW, 7.3 ML) earthquake occurred 159.8 miles away from the city center On 4/18/1906 at 13:12:21, a magnitude 7.9 (7.9 UK) earthquake occurred 283.4 miles away from the city center, causing $524,000,000 total damage On 1/17/1994 at 12:30:55, a magnitude 6.8 (6.4 MB, 6.8 MS, 6.7 MW, Depth: 11.4 mi, Class: Strong, Intensity: VII - IX) earthquake occurred 91.1 miles away from the city center, causing 60 deaths (60 shaking deaths) and 7000 injuries Magnitude types: body-wave magnitude (MB), local magnitude (ML), surface-wave magnitude (MS), moment magnitude (MW)
Natural disasters:
The number of natural disasters in Kern County (29) is a lot greater than the US average (15). Major Disasters (Presidential) Declared: 14 Emergencies Declared: 3
Causes of natural disasters: Fires: 12, Floods: 12, Storms: 7, Winter Storms: 5, Mudslides: 4, Landslides: 3, Freezes: 2, Drought: 1, Heavy Rain: 1, Hurricane: 1, Snow: 1, Tornado: 1, Wind: 1, Other: 1 (Note: some incidents may be assigned to more than one category).
Hospitals and medical centers near Oildale:
GOOD SAMARITAN HOSPITAL Acute Care Hospitals (about 1 miles away; BAKERSFIELD, CA)
OPTIMAL HOME HEALTH (Home Health Center, about 2 miles away; BAKERSFIELD, CA)
GOLDEN LIVINGCENTER - BAKERSFIELD (Nursing Home, about 3 miles away; BAKERSFIELD, CA)
BAKERSFIELD HEALTHCARE CENTER (Nursing Home, about 3 miles away; BAKERSFIELD, CA)
GOLDEN STATE MANOR CONVALESCENT HOSP (Nursing Home, about 3 miles away; BAKERSFIELD, CA)
PEGASUS DIALYSIS, LLC (Dialysis Facility, about 3 miles away; BAKERSFIELD, CA)
BAKERSFIELD MEMORIAL HOSPITAL Acute Care Hospitals (about 3 miles away; BAKERSFIELD, CA)
Amtrak station near Oildale:
4 miles: BAKERSFIELD (1501 F ST.) . Services: ticket office, partially wheelchair accessible, enclosed waiting area, public restrooms, public payphones, vending machines, free short-term parking, free long-term parking, call for car rental service, call for taxi service, public transit connection.
Colleges/universities with over 2000 students nearest to Oildale:
Bakersfield College (about 4 miles; Bakersfield, CA; Full-time enrollment: 10,325)
California State University-Bakersfield (about 7 miles; Bakersfield, CA; FT enrollment: 7,564)
Taft College (about 31 miles; Taft, CA; FT enrollment: 2,121)
Porterville College (about 44 miles; Porterville, CA; FT enrollment: 2,560)
College of the Sequoias (about 65 miles; Visalia, CA; FT enrollment: 6,982)
San Joaquin Valley College-Visalia (about 66 miles; Visalia, CA; FT enrollment: 2,386)
Antelope Valley College (about 71 miles; Lancaster, CA; FT enrollment: 9,206)
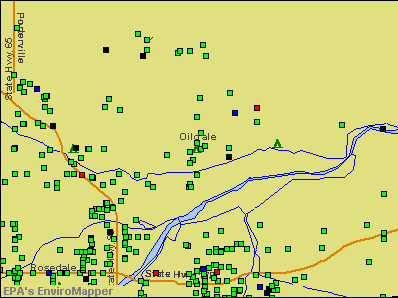
Notable locations in Oildale: Kern County Fire Department Station 64 - River View (A), Kern County Fire Department Station 63 Highland (B), Rathbun Branch Kern County Library (C), Beardsley Elementary School District Office (D). Display/hide their locations on the map
Churches in Oildale include: Calvary Full Gospel Church (A), First Bible Baptist Church (B), Norris Road Christian Church (C), Oildale Church of God (D), Oildale Seventh Day Adventist Church (E), Operation Fresh Start Apostolic Faith Church (F), Riverview Assembly of God Church (G), Riverview Church of Christ (H), Riverview Southern Baptist Church (I). Display/hide their locations on the map
Kern County has a predicted average indoor radon screening level between 2 and 4 pCi/L (pico curies per liter) - Moderate Potential
Average household size:
This place:
2.7 people
California:
2.9 people
Percentage of family households:
This place:
65.9%
Whole state:
68.7%
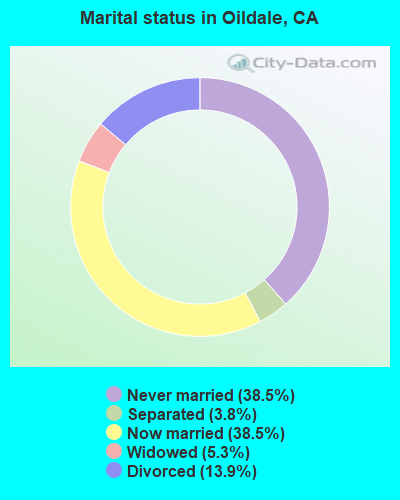
Percentage of households with unmarried partners:
This place:
12.1%
Whole state:
7.2%
Likely homosexual households (counted as self-reported same-sex unmarried-partner households)
Lesbian couples: 0.7% of all households
Gay men: 0.4% of all households
33 people in group homes intended for adults in 2010
15 people in residential treatment centers for adults in 2010
39 people in homes or halfway houses for drug/alcohol abuse in 2000
12 people in other noninstitutional group quarters in 2000
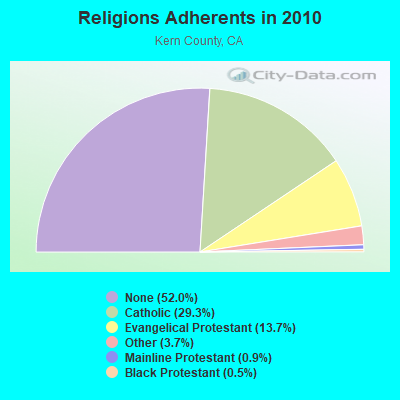
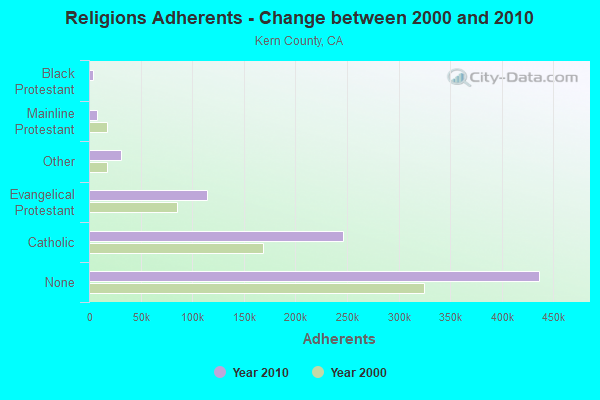
Religion statistics for Oildale, CA (based on Kern County data)
Religion
Adherents
Congregations
Catholic
245,836
30
Evangelical Protestant
114,724
436
Other
30,687
83
Mainline Protestant
7,459
38
Black Protestant
4,026
25
Orthodox
450
3
None
436,449
-
Source: Clifford Grammich, Kirk Hadaway, Richard Houseal, Dale E.Jones, Alexei Krindatch, Richie Stanley and Richard H.Taylor. 2012. 2010 U.S.Religion Census: Religious Congregations & Membership Study. Association of Statisticians of American Religious Bodies. Jones, Dale E., et al. 2002. Congregations and Membership in the United States 2000. Nashville, TN: Glenmary Research Center. Graphs represent county-level data
Call Sign: KB6KUC, Grant Date: 05/09/1996, Expiration Date: 03/06/2000, Cancellation Date: 03/07/2002, Registrant: Jerry L Jessee, 507 Date St, Oildale, CA 93308-4234
Call Sign: KD6QMV, Grant Date: 04/05/1994, Expiration Date: 04/05/2004, Cancellation Date: 04/06/2006, Registrant: Kenneth A Marsalek, 3 Dogwood Ln Trailer, Oildale, CA 93308
Call Sign: KN6ZF, Licensee ID: L00793676, Grant Date: 01/06/2004, Expiration Date: 03/08/2014, Cancellation Date: 03/09/2016, Certifier: Jake W Allison, Registrant: Jake W Allison, 1232 Woodrow, Oildale, CA 93308
Call Sign: WA6RXI, Grant Date: 07/12/1988, Expiration Date: 07/12/1998, Cancellation Date: 07/13/2000, Registrant: Bill L Harvey, 1020 Roberts Ln, Oildale, CA 93308
Call Sign: KG6TBP, Licensee ID: L00770455, Grant Date: 11/20/2003, Expiration Date: 11/20/2013, Cancellation Date: 11/21/2015, Certifier: Wayne F Harms, Registrant: Wayne F Harms, 330 W Harding Ave, Oildale, CA 93308
FAA Registered Aircraft:
3
Aircraft: CESSNA 170B (Category: Land, Seats: 4, Weight: Up to 12,499 Pounds, Speed: 105 mph), Engine: CONT MOTOR C145 SERIES (145 HP) (Reciprocating) N-Number: 1445D, N1445D, N-1445D, Serial Number: 20028, Year manufactured: 1951 Registrant (Partnership): Aero Club Bakersfield, 1309 Yosemite Dr, Oildale, CA 93308 Deregistered:Cancel Date: 03/13/2020
Aircraft: AERONCA 7AC (Category: Land, Seats: 2, Weight: Up to 12,499 Pounds, Speed: 90 mph), Engine: LYCOMING 0-235 SERIES (115 HP) (Reciprocating) N-Number: 83343, N83343, N-83343, Serial Number: 7AC2010, Year manufactured: 1946 Registrant (Individual): S D Gates, 616 Lincoln Ave, Oildale, CA 93308 Deregistered:Cancel Date: 05/16/2019
Aircraft: STINSON 108-1 (Category: Land, Seats: 4, Weight: Up to 12,499 Pounds, Speed: 84 mph), Engine: FRANKLIN 6A4165 SERIES (165 HP) (Reciprocating) N-Number: 887C, N887C, N-887C, Serial Number: 1083887, Year manufactured: 1947 Registrant (Individual): A J Weis, 847 Decatur St, Oildale, CA 93308
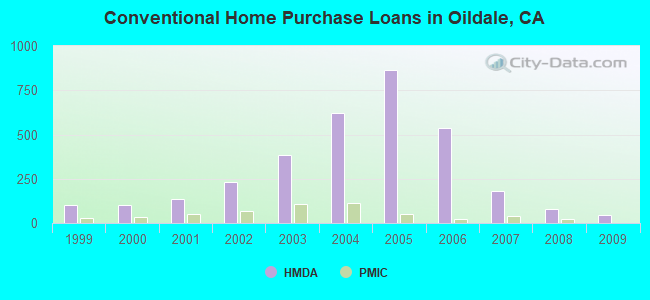
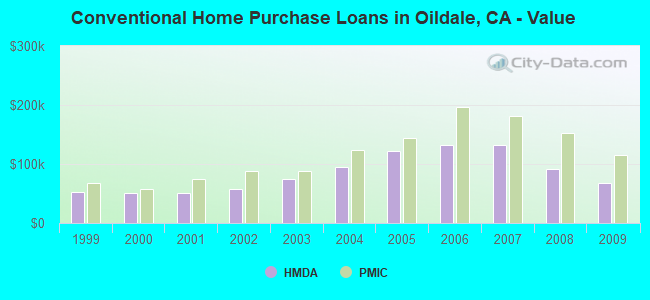
Home Mortgage Disclosure Act Aggregated Statistics For Year 2009 (Based on 3 full and 2 partial tracts)
A) FHA, FSA/RHS & VA Home Purchase Loans
B) Conventional Home Purchase Loans
C) Refinancings
D) Home Improvement Loans
E) Loans on Dwellings For 5+ Families
F) Non-occupant Loans on < 5 Family Dwellings (A B C & D)
G) Loans On Manufactured Home Dwelling (A B C & D)
Number
Average Value
Number
Average Value
Number
Average Value
Number
Average Value
Number
Average Value
Number
Average Value
Number
Average Value
LOANS ORIGINATED
99
$101,287
48
$67,959
55
$137,494
4
$63,250
1
$149,000
46
$75,613
1
$69,310
APPLICATIONS APPROVED, NOT ACCEPTED
8
$89,238
4
$72,795
6
$183,772
1
$20,000
0
$0
4
$178,215
3
$62,543
APPLICATIONS DENIED
11
$112,702
13
$69,398
56
$118,178
15
$30,689
1
$448,010
23
$107,110
3
$19,813
APPLICATIONS WITHDRAWN
21
$98,240
10
$61,248
29
$112,977
3
$54,057
1
$1,576,480
13
$64,223
1
$37,190
FILES CLOSED FOR INCOMPLETENESS
2
$159,430
4
$94,215
10
$118,584
3
$57,843
0
$0
7
$116,097
0
$0
Aggregated Statistics For Year 2008 (Based on 3 full and 2 partial tracts)
A) FHA, FSA/RHS & VA Home Purchase Loans
B) Conventional Home Purchase Loans
C) Refinancings
D) Home Improvement Loans
E) Loans on Dwellings For 5+ Families
F) Non-occupant Loans on < 5 Family Dwellings (A B C & D)
G) Loans On Manufactured Home Dwelling (A B C & D)
Number
Average Value
Number
Average Value
Number
Average Value
Number
Average Value
Number
Average Value
Number
Average Value
Number
Average Value
LOANS ORIGINATED
94
$127,471
80
$90,709
106
$126,795
16
$44,081
1
$308,000
74
$107,832
5
$75,388
APPLICATIONS APPROVED, NOT ACCEPTED
13
$138,243
15
$126,817
30
$142,735
6
$61,013
2
$505,000
22
$151,191
3
$34,757
APPLICATIONS DENIED
10
$132,470
24
$115,735
166
$157,419
34
$40,071
0
$0
54
$151,555
5
$30,938
APPLICATIONS WITHDRAWN
16
$144,646
16
$139,453
53
$153,062
7
$100,280
1
$1,576,480
22
$127,394
0
$0
FILES CLOSED FOR INCOMPLETENESS
2
$177,300
2
$150,555
13
$121,204
1
$31,540
0
$0
3
$142,310
0
$0
Aggregated Statistics For Year 2007 (Based on 3 full and 2 partial tracts)
A) FHA, FSA/RHS & VA Home Purchase Loans
B) Conventional Home Purchase Loans
C) Refinancings
D) Home Improvement Loans
E) Loans on Dwellings For 5+ Families
F) Non-occupant Loans on < 5 Family Dwellings (A B C & D)
G) Loans On Manufactured Home Dwelling (A B C & D)
Number
Average Value
Number
Average Value
Number
Average Value
Number
Average Value
Number
Average Value
Number
Average Value
Number
Average Value
LOANS ORIGINATED
22
$181,141
183
$131,451
420
$150,725
54
$88,890
7
$849,333
167
$150,976
7
$75,739
APPLICATIONS APPROVED, NOT ACCEPTED
2
$190,500
44
$130,718
105
$146,334
18
$91,370
0
$0
37
$146,547
4
$54,625
APPLICATIONS DENIED
7
$188,649
111
$147,062
468
$179,765
60
$88,773
2
$312,910
123
$180,366
10
$29,941
APPLICATIONS WITHDRAWN
1
$303,750
44
$148,831
190
$176,619
22
$99,478
2
$319,100
47
$167,097
2
$76,115
FILES CLOSED FOR INCOMPLETENESS
0
$0
24
$146,155
52
$176,624
4
$154,588
1
$456,460
14
$191,614
0
$0
Aggregated Statistics For Year 2006 (Based on 3 full and 2 partial tracts)
A) FHA, FSA/RHS & VA Home Purchase Loans
B) Conventional Home Purchase Loans
C) Refinancings
D) Home Improvement Loans
E) Loans on Dwellings For 5+ Families
F) Non-occupant Loans on < 5 Family Dwellings (A B C & D)
G) Loans On Manufactured Home Dwelling (A B C & D)
Number
Average Value
Number
Average Value
Number
Average Value
Number
Average Value
Number
Average Value
Number
Average Value
Number
Average Value
LOANS ORIGINATED
10
$188,882
538
$131,360
688
$158,883
96
$103,871
1
$422,650
321
$155,560
12
$55,315
APPLICATIONS APPROVED, NOT ACCEPTED
3
$212,333
108
$137,738
150
$166,217
16
$101,589
0
$0
64
$175,440
2
$34,655
APPLICATIONS DENIED
2
$240,500
233
$144,787
478
$173,551
81
$86,786
0
$0
147
$172,149
10
$87,356
APPLICATIONS WITHDRAWN
2
$235,500
127
$144,132
401
$169,181
26
$115,252
0
$0
79
$164,596
2
$147,195
FILES CLOSED FOR INCOMPLETENESS
1
$140,000
23
$123,462
63
$173,177
2
$137,090
0
$0
12
$176,923
1
$178,000
Aggregated Statistics For Year 2005 (Based on 3 full and 2 partial tracts)
A) FHA, FSA/RHS & VA Home Purchase Loans
B) Conventional Home Purchase Loans
C) Refinancings
D) Home Improvement Loans
E) Loans on Dwellings For 5+ Families
F) Non-occupant Loans on < 5 Family Dwellings (A B C & D)
G) Loans On Manufactured Home Dwelling (A B C & D)
Number
Average Value
Number
Average Value
Number
Average Value
Number
Average Value
Number
Average Value
Number
Average Value
Number
Average Value
LOANS ORIGINATED
13
$161,770
865
$121,523
858
$132,638
131
$98,306
10
$482,317
437
$138,197
11
$44,595
APPLICATIONS APPROVED, NOT ACCEPTED
1
$167,320
130
$117,316
130
$135,389
12
$90,472
0
$0
75
$134,935
3
$63,370
APPLICATIONS DENIED
2
$128,500
287
$125,734
479
$133,471
77
$82,166
3
$379,697
125
$138,730
13
$76,968
APPLICATIONS WITHDRAWN
4
$158,300
166
$128,075
414
$132,274
46
$122,373
1
$308,000
94
$128,172
0
$0
FILES CLOSED FOR INCOMPLETENESS
0
$0
26
$125,781
66
$133,142
5
$70,092
0
$0
20
$146,592
0
$0
Aggregated Statistics For Year 2004 (Based on 3 full and 2 partial tracts)
A) FHA, FSA/RHS & VA Home Purchase Loans
B) Conventional Home Purchase Loans
C) Refinancings
D) Home Improvement Loans
E) Loans on Dwellings For 5+ Families
F) Non-occupant Loans on < 5 Family Dwellings (A B C & D)
G) Loans On Manufactured Home Dwelling (A B C & D)
Number
Average Value
Number
Average Value
Number
Average Value
Number
Average Value
Number
Average Value
Number
Average Value
Number
Average Value
LOANS ORIGINATED
83
$111,773
623
$94,243
629
$99,082
69
$72,358
14
$332,274
356
$99,953
12
$34,598
APPLICATIONS APPROVED, NOT ACCEPTED
3
$97,447
99
$102,938
114
$97,416
10
$55,563
0
$0
56
$99,236
7
$42,036
APPLICATIONS DENIED
12
$102,673
202
$91,157
475
$91,933
85
$43,107
3
$761,143
113
$88,882
9
$38,269
APPLICATIONS WITHDRAWN
14
$106,821
110
$87,701
347
$93,341
15
$64,179
1
$224,000
51
$92,139
1
$5,000
FILES CLOSED FOR INCOMPLETENESS
0
$0
15
$83,457
56
$103,925
7
$39,087
0
$0
10
$120,599
0
$0
Aggregated Statistics For Year 2003 (Based on 3 full and 2 partial tracts)
A) FHA, FSA/RHS & VA Home Purchase Loans
B) Conventional Home Purchase Loans
C) Refinancings
D) Home Improvement Loans
E) Loans on Dwellings For 5+ Families
F) Non-occupant Loans on < 5 Family Dwellings (A B C & D)
Number
Average Value
Number
Average Value
Number
Average Value
Number
Average Value
Number
Average Value
Number
Average Value
LOANS ORIGINATED
189
$90,634
382
$75,057
595
$75,870
16
$31,231
10
$307,526
281
$73,837
APPLICATIONS APPROVED, NOT ACCEPTED
12
$95,863
54
$69,757
106
$76,274
6
$32,155
0
$0
43
$71,000
APPLICATIONS DENIED
9
$86,848
63
$77,960
447
$80,262
53
$34,961
2
$137,495
67
$65,407
APPLICATIONS WITHDRAWN
11
$98,533
50
$82,651
281
$83,957
4
$21,030
0
$0
49
$70,980
FILES CLOSED FOR INCOMPLETENESS
1
$113,600
13
$108,544
31
$93,844
2
$17,410
0
$0
7
$85,259
Aggregated Statistics For Year 2002 (Based on 3 full and 2 partial tracts)
A) FHA, FSA/RHS & VA Home Purchase Loans
B) Conventional Home Purchase Loans
C) Refinancings
D) Home Improvement Loans
E) Loans on Dwellings For 5+ Families
F) Non-occupant Loans on < 5 Family Dwellings (A B C & D)
Number
Average Value
Number
Average Value
Number
Average Value
Number
Average Value
Number
Average Value
Number
Average Value
LOANS ORIGINATED
183
$75,745
231
$58,106
301
$68,491
13
$25,398
5
$204,274
165
$62,503
APPLICATIONS APPROVED, NOT ACCEPTED
8
$100,182
21
$54,069
55
$66,105
3
$23,710
1
$105,000
21
$63,367
APPLICATIONS DENIED
9
$75,093
37
$59,628
282
$70,992
42
$25,785
2
$181,845
39
$61,896
APPLICATIONS WITHDRAWN
21
$78,720
45
$60,726
145
$71,315
1
$72,980
2
$389,855
25
$70,964
FILES CLOSED FOR INCOMPLETENESS
3
$91,283
9
$45,880
31
$76,965
2
$13,455
0
$0
3
$52,400
Aggregated Statistics For Year 2001 (Based on 3 full and 2 partial tracts)
A) FHA, FSA/RHS & VA Home Purchase Loans
B) Conventional Home Purchase Loans
C) Refinancings
D) Home Improvement Loans
E) Loans on Dwellings For 5+ Families
F) Non-occupant Loans on < 5 Family Dwellings (A B C & D)
Number
Average Value
Number
Average Value
Number
Average Value
Number
Average Value
Number
Average Value
Number
Average Value
LOANS ORIGINATED
169
$71,532
137
$50,571
196
$65,591
10
$23,038
0
$0
100
$54,695
APPLICATIONS APPROVED, NOT ACCEPTED
7
$70,043
7
$55,900
33
$58,028
3
$17,953
0
$0
10
$60,571
APPLICATIONS DENIED
9
$84,333
36
$45,021
212
$62,216
28
$16,032
2
$192,500
40
$50,586
APPLICATIONS WITHDRAWN
10
$70,624
21
$60,984
122
$64,663
4
$14,830
0
$0
17
$58,782
FILES CLOSED FOR INCOMPLETENESS
0
$0
2
$70,365
29
$73,288
5
$34,824
0
$0
0
$0
Aggregated Statistics For Year 2000 (Based on 3 full and 2 partial tracts)
A) FHA, FSA/RHS & VA Home Purchase Loans
B) Conventional Home Purchase Loans
C) Refinancings
D) Home Improvement Loans
E) Loans on Dwellings For 5+ Families
F) Non-occupant Loans on < 5 Family Dwellings (A B C & D)
Number
Average Value
Number
Average Value
Number
Average Value
Number
Average Value
Number
Average Value
Number
Average Value
LOANS ORIGINATED
181
$64,337
102
$51,419
82
$46,700
22
$28,060
2
$223,500
57
$47,530
APPLICATIONS APPROVED, NOT ACCEPTED
0
$0
16
$44,942
25
$49,653
12
$21,654
0
$0
11
$42,013
APPLICATIONS DENIED
6
$68,888
44
$51,945
152
$46,883
38
$21,313
0
$0
30
$48,441
APPLICATIONS WITHDRAWN
13
$72,811
21
$53,628
72
$50,070
3
$51,150
0
$0
21
$50,194
FILES CLOSED FOR INCOMPLETENESS
1
$102,700
4
$89,852
14
$49,017
0
$0
0
$0
2
$46,625
Aggregated Statistics For Year 1999 (Based on 3 full and 2 partial tracts)
A) FHA, FSA/RHS & VA Home Purchase Loans
B) Conventional Home Purchase Loans
C) Refinancings
D) Home Improvement Loans
E) Loans on Dwellings For 5+ Families
F) Non-occupant Loans on < 5 Family Dwellings (A B C & D)
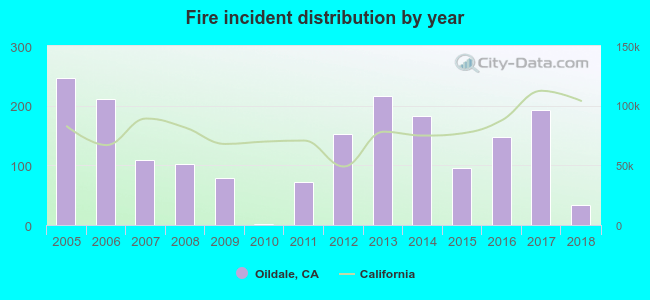
2005 - 2018 National Fire Incident Reporting System (NFIRS) incidents
Based on the data from the years 2005 - 2018 the average number of fires per year is 132. The highest number of reported fire incidents - 247 took place in 2005, and the least - 2 in 2010. The data has a declining trend.
When looking into fire subcategories, the most reports belonged to: Outside Fires (47.4%), and Structure Fires (40.6%).
Fire incident types reported to NFIRS in Oildale, CA
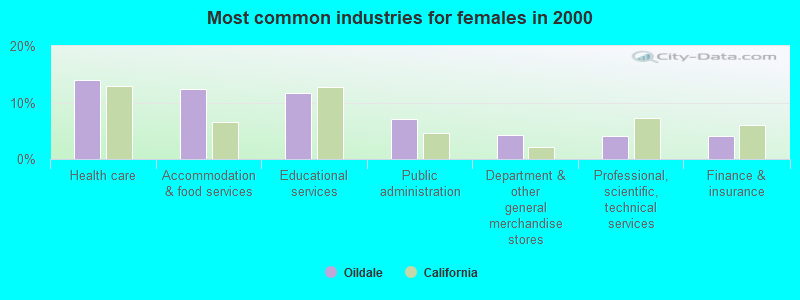
#12 on the list of "Top 101 cities with largest percentage of females in industries: management of companies and enterprises (population 5,000+)"
#35 on the list of "Top 101 cities with the largest percentage of unmarried partner households (population 5,000+)"
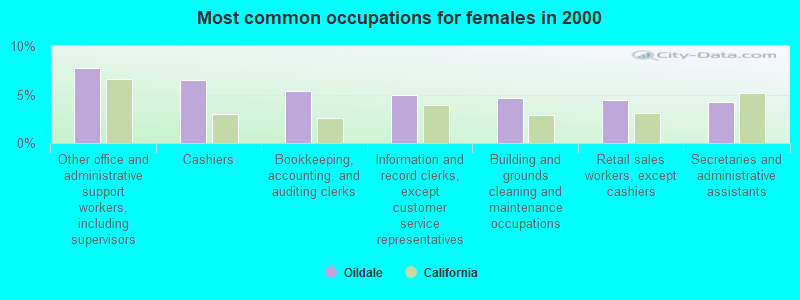
#72 on the list of "Top 101 cities with largest percentage of females in occupations: office and administrative support occupations (population 5,000+)"
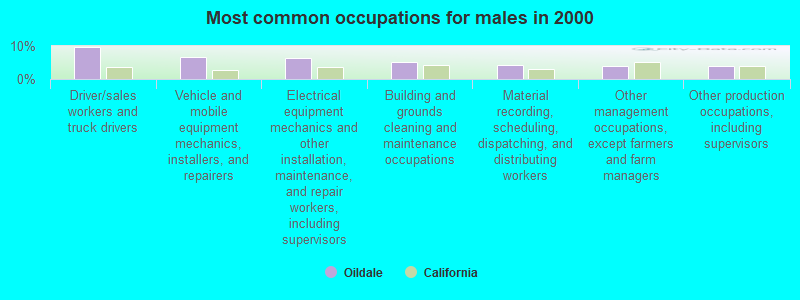
#96 on the list of "Top 101 cities with largest percentage of males in industries: mining, quarrying, and oil and gas extraction (population 5,000+)"
#6 on the list of "Top 101 counties with the highest Particulate Matter (PM10) Annual air pollution readings in 2012 (µg/m3)"
#13 on the list of "Top 101 counties with the highest carbon monoxide air pollution readings in 2012 (ppm)"
#13 on the list of "Top 101 counties with the highest lead air pollution readings in 2012 (µg/m3)"
#13 on the list of "Top 101 counties with the lowest lead air pollution readings in 2012 (µg/m3)"
#17 on the list of "Top 101 counties with the highest ground withdrawal of fresh water for public supply"


 Recent articles from our blog. Our writers, many of them Ph.D. graduates or candidates, create easy-to-read articles on a wide variety of topics.

 (4.3 miles


 Based on the data from the years 2005 - 2018 the average number of fires per year is 132. The highest number of reported fire incidents - 247 took place in 2005, and the least - 2 in 2010. The data has a declining trend.
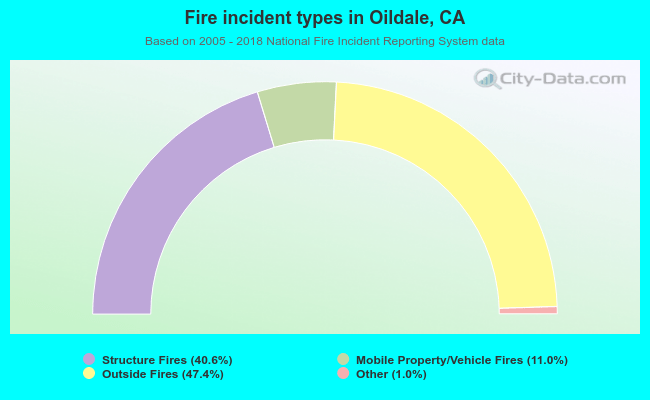 When looking into fire subcategories, the most reports belonged to: Outside Fires (47.4%), and Structure Fires (40.6%).