Forest Grove, Oregon
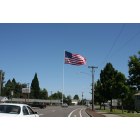
Forest Grove: Flag center of Forest Grove, OR without name title
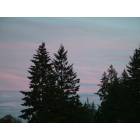
Forest Grove: Sunset outside of house in Forest Grove
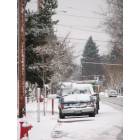
Forest Grove: Snow day Sunday Dec 14th looking off of 19th Ave
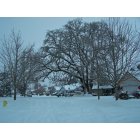
Forest Grove: Looking west on Primrose Ln. Forest Grove, Or

Forest Grove: Sun Flower on the side of the road in Forest Grove
Forest Grove: Trees and clouds outside my house in Forest Grove
Forest Grove: Gales Creek Hwy just before Tom McCall School in Dec. 2008 Snow Storm
Forest Grove: Sunset from the Back Porch in Forest Grove, OR
Forest Grove: Downtown
- add
your
Submit your own pictures of this city and show them to the world
- OSM Map
- General Map
- Google Map
- MSN Map
Population change since 2000: +51.3%
 |
| Males: 12,680 | |
| Females: 14,104 |
| Median resident age: | 36.1 years |
| Oregon median age: | 40.5 years |
Zip codes: 97116.
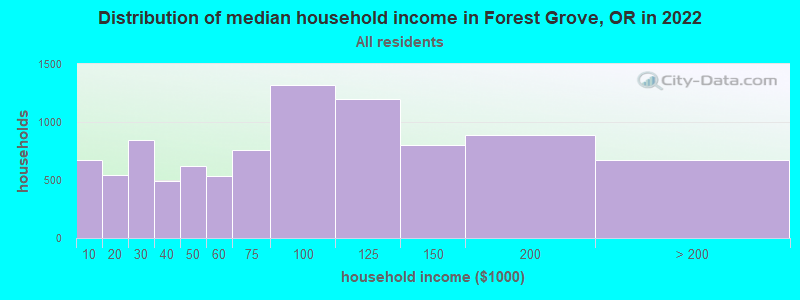
| Forest Grove: | $77,031 |
| OR: | $75,657 |
Estimated per capita income in 2022: $34,289 (it was $16,992 in 2000)
Forest Grove city income, earnings, and wages data
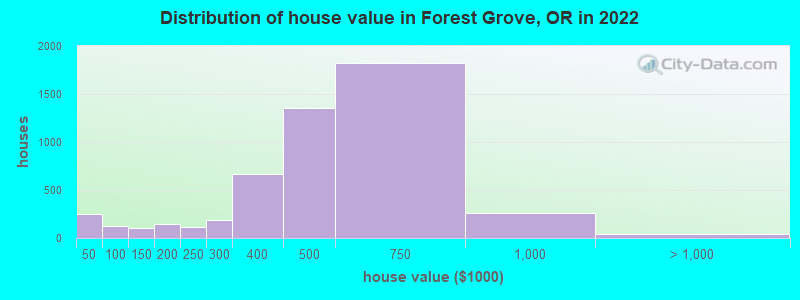
Estimated median house or condo value in 2022: $511,453 (it was $144,800 in 2000)
| Forest Grove: | $511,453 |
| OR: | $475,600 |
Mean prices in 2022: all housing units: $436,861; detached houses: $483,365; townhouses or other attached units: $478,373; in 2-unit structures: $476,026; in 5-or-more-unit structures: $145,461; mobile homes: $64,579
Median gross rent in 2022: $1,283.
(12.4% for White Non-Hispanic residents, 45.3% for Black residents, 14.3% for Hispanic or Latino residents, 10.4% for American Indian residents, 16.1% for other race residents, 14.1% for two or more races residents)
Detailed information about poverty and poor residents in Forest Grove, OR


Compare current foreclosures near Forest Grove, OR:
| Photo | Address | Area | Beds / Baths | Price | Details |
|---|---|---|---|---|---|

|
#1
Fir Rd
Forest Grove, OR 97116
|
1,472 sq. feet
|
2 baths 3 beds |
show details | |

|
#2
B St
Forest Grove, OR 97116
|
- sq. feet
|
2 baths 3 beds |
show details | |

|
#3
SW Plumlee Rd
Forest Grove, OR 97116
|
1,927 sq. feet
|
3 baths 2 beds |
show details | |

|
#4
Leon Dr
Forest Grove, OR 97116
|
1,337 sq. feet
|
2 baths 3 beds |
show details | |

|
#5
21st Ave
Forest Grove, OR 97116
|
1,648 sq. feet
|
2 baths 2 beds |
show details | |

|
#6
33rd Pl
Forest Grove, OR 97116
|
1,478 sq. feet
|
2 baths 3 beds |
show details | |

|
#7
Oakcrest Dr
Forest Grove, OR 97116
|
1,364 sq. feet
|
3 baths 4 beds |
show details | |

|
#8
Oakcrest Dr
Forest Grove, OR 97116
|
1,742 sq. feet
|
2 baths 3 beds |
show details | |

|
#9
NW Highway 47
Forest Grove, OR 97116
|
3,552 sq. feet
|
2 baths 4 beds |
show details | |

|
#10
17th Pl
Forest Grove, OR 97116
|
1,664 sq. feet
|
2 baths 4 beds |
show details |
| Photo | Address | Area | Beds / Baths | Price | Details |
|---|---|---|---|---|---|

|
#11
Kingwood St
Forest Grove, OR 97116
|
1,280 sq. feet
|
2 baths 3 beds |
show details | |

|
#12
Main St Unit 11
Forest Grove, OR 97116
|
1,296 sq. feet
|
2 baths 3 beds |
show details | |

|
#13
18th Ave
Forest Grove, OR 97116
|
1,292 sq. feet
|
3 baths 3 beds |
show details | |

|
#14
Ash St
Forest Grove, OR 97116
|
1,188 sq. feet
|
2 baths 3 beds |
show details | |

|
#15
Thatcher Rd
Forest Grove, OR 97116
|
2,254 sq. feet
|
2 baths 3 beds |
show details | |

|
#16
B St
Forest Grove, OR 97116
|
1,560 sq. feet
|
2 baths - beds |
show details | |

|
#17
25th Ave
Forest Grove, OR 97116
|
- sq. feet
|
- baths - beds |
show details | |

|
#18
25th Ave
Forest Grove, OR 97116
|
- sq. feet
|
- baths - beds |
show details | |

|
#19
Silverstone Dr
Forest Grove, OR 97116
|
- sq. feet
|
- baths - beds |
show details | |

|
#20
Willamina Ave
Forest Grove, OR 97116
|
- sq. feet
|
- baths - beds |
show details |
| Photo | Address | Area | Beds / Baths | Price | Details |
|---|---|---|---|---|---|

|
#21
Brittany Dr
Forest Grove, OR 97116
|
- sq. feet
|
- baths - beds |
show details | |

|
#22
24th Ave Apt 4
Forest Grove, OR 97116
|
- sq. feet
|
- baths - beds |
show details | |

|
#23
A St Apt D
Forest Grove, OR 97116
|
- sq. feet
|
- baths - beds |
show details | |

|
#24
Strasburg Dr
Forest Grove, OR 97116
|
- sq. feet
|
- baths - beds |
show details | |

|
#25
Pacific Ave
Forest Grove, OR 97116
|
3,768 sq. feet
|
- baths - beds |
show details | |

|
#26
Allsyum Ave
Forest Grove, OR 97116
|
- sq. feet
|
- baths - beds |
show details | |

|
#27
NW Kathleen Dr
Portland, OR 97229
|
2,798 sq. feet
|
2 baths 4 beds |
show details | |

|
#28
SW Erin Ter
Beaverton, OR 97003
|
1,338 sq. feet
|
2 baths 3 beds |
show details | |

|
#29
SW Perfecta Ave
Beaverton, OR 97005
|
1,552 sq. feet
|
2 baths 3 beds |
show details | |

|
#30
SW Snowdale St Unit 104
Beaverton, OR 97007
|
655 sq. feet
|
1 baths 1 beds |
show details |
| Photo | Address | Area | Beds / Baths | Price | Details |
|---|---|---|---|---|---|

|
#31
SW 147th Ter # 28-3
Beaverton, OR 97007
|
1,078 sq. feet
|
3 baths 2 beds |
show details | |

|
#32
SW 147th Ter Unit 103
Beaverton, OR 97007
|
1,058 sq. feet
|
3 baths 2 beds |
show details | |

|
#33
NE 66th Ave
Hillsboro, OR 97124
|
1,680 sq. feet
|
3 baths 3 beds |
show details | |

|
#34
SW Sagehen St
Beaverton, OR 97007
|
1,666 sq. feet
|
2 baths 2 beds |
show details | |

|
#35
SW Blakeney St
Beaverton, OR 97008
|
1,982 sq. feet
|
3 baths 3 beds |
show details | |

|
#36
SW Sorrento Rd
Beaverton, OR 97008
|
1,810 sq. feet
|
2 baths 3 beds |
show details | |

|
#37
SE Brookwood Ave Apt 111
Hillsboro, OR 97123
|
- sq. feet
|
2 baths 3 beds |
show details | |

|
#38
SE Brookwood Ave
Hillsboro, OR 97123
|
2,538 sq. feet
|
2 baths 3 beds |
show details | |

|
#39
NW Parkside Ln
Portland, OR 97229
|
4,546 sq. feet
|
4 baths 4 beds |
show details | |

|
#40
SW 130th Ave
Portland, OR 97223
|
1,546 sq. feet
|
2 baths 3 beds |
show details |
| Photo | Address | Area | Beds / Baths | Price | Details |
|---|---|---|---|---|---|

|
#41
NW Phillips Rd
Gaston, OR 97119
|
1,645 sq. feet
|
2 baths 3 beds |
show details | |

|
#42
SE Quail Cir
Hillsboro, OR 97123
|
1,330 sq. feet
|
2 baths 3 beds |
show details | |

|
#43
SE Spruce St
Hillsboro, OR 97123
|
2,026 sq. feet
|
2 baths 3 beds |
show details | |

|
#44
NE Darby St
Hillsboro, OR 97124
|
1,876 sq. feet
|
2 baths 5 beds |
show details | |

|
#45
NW Evergreen St
Portland, OR 97229
|
2,999 sq. feet
|
3 baths 5 beds |
show details | |

|
#46
SW Derby St
Beaverton, OR 97005
|
1,073 sq. feet
|
1 baths 3 beds |
show details | |

|
#47
SW Butternut Dr
Beaverton, OR 97007
|
2,316 sq. feet
|
3 baths 3 beds |
show details | |

|
#48
SW 150th Ct
Beaverton, OR 97007
|
1,360 sq. feet
|
2 baths 3 beds |
show details | |

|
#49
SE 16th Ave
Hillsboro, OR 97123
|
1,044 sq. feet
|
2 baths 4 beds |
show details | |

|
Check over 1 million property listings on Foreclosure.com!
|
browse all offers | |||


- 16,06061.3%White alone
- 7,94930.4%Hispanic
- 1,0554.0%Two or more races
- 6412.4%Asian alone
- 2671.0%Black alone
- 660.3%Other race alone
- 220.08%American Indian alone
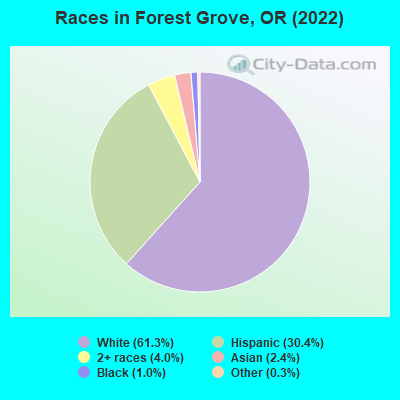
Races in Forest Grove detailed stats: ancestries, foreign born residents, place of birth
According to our research of Oregon and other state lists, there were 10 registered sex offenders living in Forest Grove, Oregon as of June 08, 2024.
The ratio of all residents to sex offenders in Forest Grove is 2,398 to 1.
The ratio of registered sex offenders to all residents in this city is near the state average.
Type |
2009 |
2010 |
2011 |
2012 |
2013 |
2014 |
2015 |
2016 |
2017 |
2018 |
2019 |
2020 |
2021 |
2022 |
|---|---|---|---|---|---|---|---|---|---|---|---|---|---|---|
| Murders (per 100,000) | 2 (9.4) | 0 (0.0) | 2 (9.4) | 0 (0.0) | 0 (0.0) | 0 (0.0) | 0 (0.0) | 0 (0.0) | 1 (4.1) | 1 (4.1) | 0 (0.0) | 0 (0.0) | 0 (0.0) | 1 (3.8) |
| Rapes (per 100,000) | 1 (4.7) | 8 (37.9) | 15 (70.4) | 10 (46.2) | 12 (54.0) | 18 (79.1) | 3 (12.7) | 20 (81.9) | 25 (102.0) | 15 (61.1) | 12 (47.9) | 11 (42.2) | 15 (57.9) | 17 (65.3) |
| Robberies (per 100,000) | 12 (56.3) | 4 (19.0) | 7 (32.9) | 8 (37.0) | 12 (54.0) | 9 (39.6) | 1 (4.2) | 5 (20.5) | 8 (32.6) | 1 (4.1) | 3 (12.0) | 3 (11.5) | 7 (27.0) | 11 (42.3) |
| Assaults (per 100,000) | 22 (103.1) | 41 (194.5) | 28 (131.4) | 65 (300.4) | 52 (233.8) | 49 (215.4) | 6 (25.4) | 27 (110.5) | 28 (114.2) | 26 (105.9) | 45 (179.5) | 43 (165.0) | 54 (208.6) | 60 (230.6) |
| Burglaries (per 100,000) | 112 (525.0) | 129 (611.9) | 83 (389.5) | 104 (480.6) | 85 (382.2) | 117 (514.3) | 30 (127.1) | 87 (356.1) | 53 (216.2) | 44 (179.2) | 60 (239.4) | 88 (337.6) | 51 (197.0) | 58 (222.9) |
| Thefts (per 100,000) | 588 (2,756) | 548 (2,599) | 464 (2,178) | 561 (2,592) | 499 (2,244) | 484 (2,128) | 87 (368.5) | 402 (1,645) | 343 (1,399) | 375 (1,527) | 366 (1,460) | 405 (1,554) | 266 (1,027) | 382 (1,468) |
| Auto thefts (per 100,000) | 17 (79.7) | 23 (109.1) | 26 (122.0) | 46 (212.6) | 29 (130.4) | 50 (219.8) | 16 (67.8) | 40 (163.7) | 38 (155.0) | 33 (134.4) | 44 (175.6) | 37 (142.0) | 65 (251.1) | 44 (169.1) |
| Arson (per 100,000) | 3 (14.1) | 6 (28.5) | 6 (28.2) | 4 (18.5) | 2 (9.0) | 3 (13.2) | 0 (0.0) | 9 (36.8) | 4 (16.3) | 6 (24.4) | 2 (8.0) | 3 (11.5) | 7 (27.0) | 9 (34.6) |
| City-Data.com crime index | 213.4 | 230.5 | 235.4 | 262.5 | 233.1 | 256.9 | 45.6 | 197.6 | 205.8 | 163.8 | 167.0 | 167.4 | 171.1 | 206.6 |
The City-Data.com crime index weighs serious crimes and violent crimes more heavily. Higher means more crime, U.S. average is 246.1. It adjusts for the number of visitors and daily workers commuting into cities.
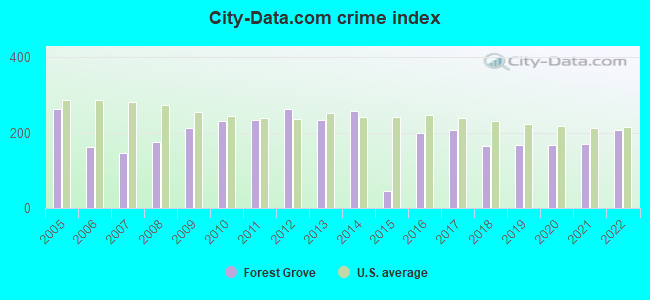
Crime rate in Forest Grove detailed stats: murders, rapes, robberies, assaults, burglaries, thefts, arson
Full-time law enforcement employees in 2021, including police officers: 33 (28 officers - 25 male; 3 female).
| Officers per 1,000 residents here: | 1.08 |
| Oregon average: | 1.48 |
 Recent articles from our blog. Our writers, many of them Ph.D. graduates or candidates, create easy-to-read articles on a wide variety of topics.

 | Moved from SW Portland to Forest Grove (9 replies) |
| Forest Living in Oregon (56 replies) |
| Best City for Us--Forest Grove? (10 replies) |
| recreation in Forest Grove (15 replies) |
| Grants Pass Oregon/ similar places (38 replies) |
| Cornelius Oregon (11 replies) |
Latest news from Forest Grove, OR collected exclusively by city-data.com from local newspapers, TV, and radio stations
Forest Grove, OR City Guides:
Ancestries: American (10.7%), European (7.1%), German (6.6%), English (4.3%), Norwegian (2.1%), Irish (2.0%).
Current Local Time: PST time zone
Elevation: 211 feet
Land area: 4.60 square miles.
Population density: 5,824 people per square mile (average).
3,179 residents are foreign born (9.7% Latin America, 1.3% Asia).
| This city: | 12.1% |
| Oregon: | 9.8% |
Median real estate property taxes paid for housing units with mortgages in 2022: $3,845 (0.7%)
Median real estate property taxes paid for housing units with no mortgage in 2022: $3,689 (0.8%)
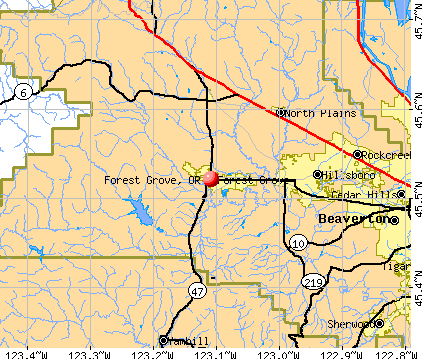
Nearest city with pop. 50,000+: Hillsboro, OR  (8.0 miles , pop. 70,186).
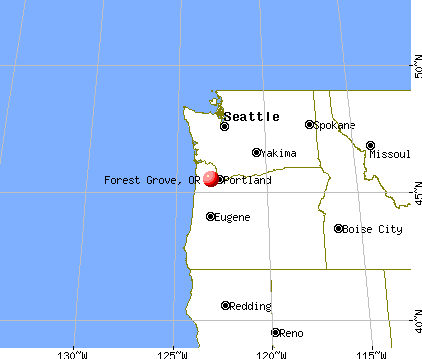
Nearest city with pop. 200,000+: Portland, OR (22.7 miles , pop. 529,121).
Nearest city with pop. 1,000,000+: Los Angeles, CA (829.6 miles , pop. 3,694,820).
Nearest cities:
), ), )Latitude: 45.52 N, Longitude: 123.11 W
Daytime population change due to commuting: -2,560 (-9.8%)
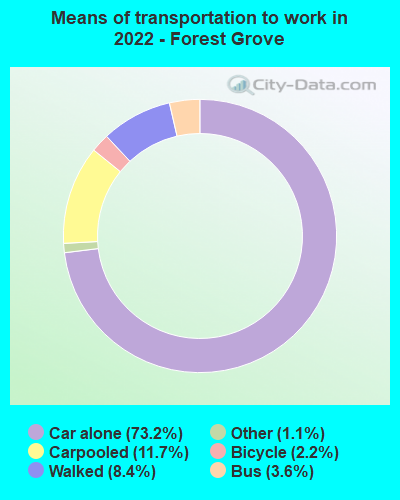
Workers who live and work in this city: 4,839 (37.3%)
Property values in Forest Grove, OR
Forest Grove tourist attractions:
Forest Grove, Oregon accommodation & food services, waste management - Economy and Business Data
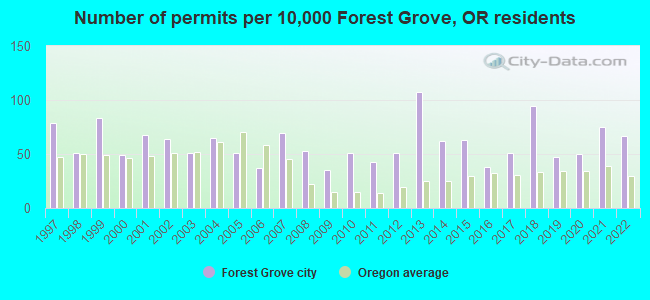
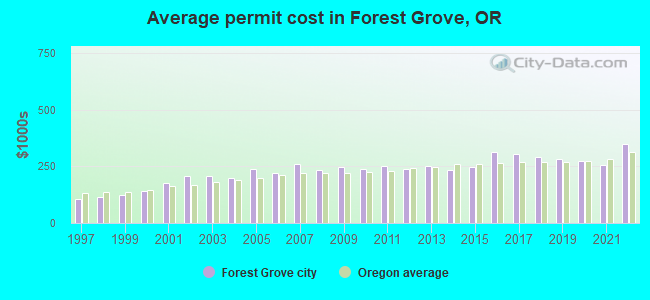
Single-family new house construction building permits:
- 2022: 118 buildings, average cost: $348,700
- 2021: 133 buildings, average cost: $257,100
- 2020: 89 buildings, average cost: $274,000
- 2019: 84 buildings, average cost: $281,000
- 2018: 167 buildings, average cost: $290,600
- 2017: 90 buildings, average cost: $306,700
- 2016: 67 buildings, average cost: $314,300
- 2015: 112 buildings, average cost: $246,800
- 2014: 110 buildings, average cost: $235,400
- 2013: 189 buildings, average cost: $249,500
- 2012: 90 buildings, average cost: $236,700
- 2011: 76 buildings, average cost: $251,300
- 2010: 91 buildings, average cost: $239,100
- 2009: 62 buildings, average cost: $249,100
- 2008: 93 buildings, average cost: $234,500
- 2007: 122 buildings, average cost: $260,300
- 2006: 65 buildings, average cost: $222,100
- 2005: 91 buildings, average cost: $239,700
- 2004: 115 buildings, average cost: $200,100
- 2003: 91 buildings, average cost: $208,500
- 2002: 113 buildings, average cost: $206,200
- 2001: 121 buildings, average cost: $175,900
- 2000: 86 buildings, average cost: $140,900
- 1999: 147 buildings, average cost: $122,300
- 1998: 90 buildings, average cost: $113,500
- 1997: 140 buildings, average cost: $106,300
| Here: | 3.8% |
| Oregon: | 3.9% |
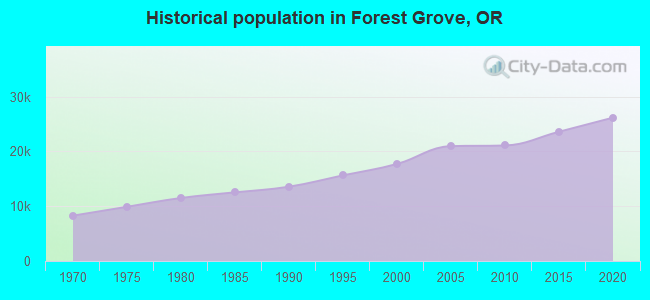
Population change in the 1990s: +3,746 (+26.8%).
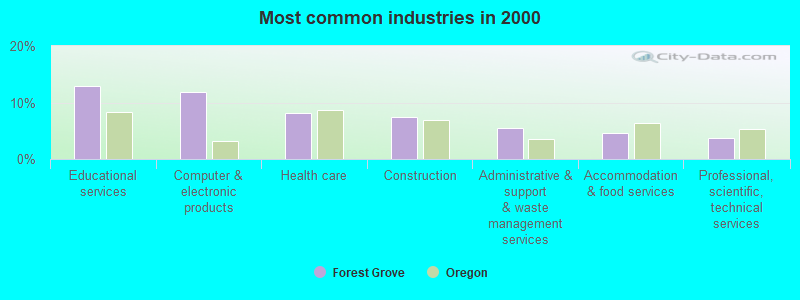
- Educational services (12.9%)
- Computer & electronic products (11.8%)
- Health care (8.1%)
- Construction (7.5%)
- Administrative & support & waste management services (5.5%)
- Accommodation & food services (4.5%)
- Professional, scientific, technical services (3.6%)
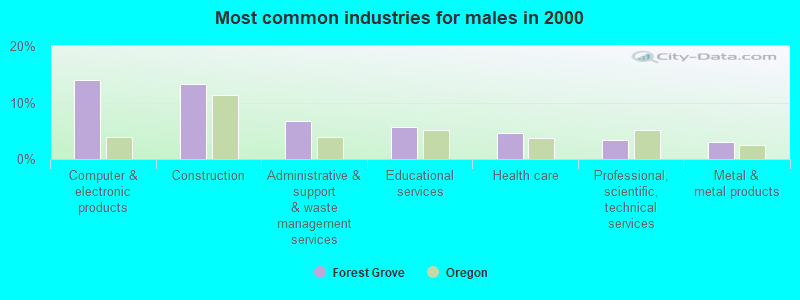
- Computer & electronic products (13.9%)
- Construction (13.3%)
- Administrative & support & waste management services (6.7%)
- Educational services (5.7%)
- Health care (4.6%)
- Professional, scientific, technical services (3.4%)
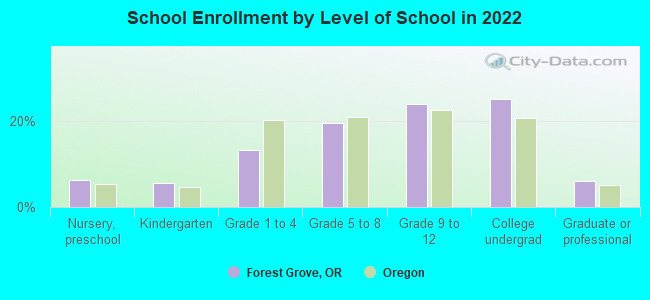
- Metal & metal products (3.0%)
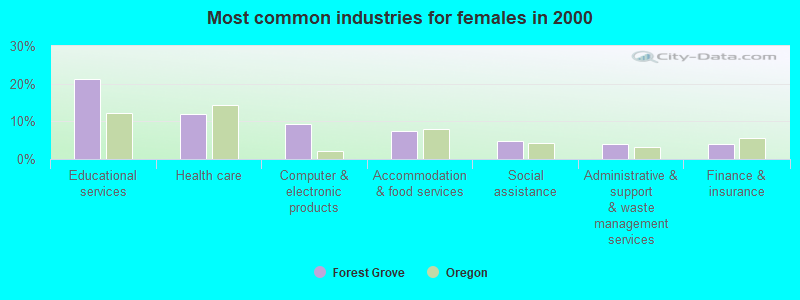
- Educational services (21.1%)
- Health care (12.0%)
- Computer & electronic products (9.4%)
- Accommodation & food services (7.3%)
- Social assistance (4.8%)
- Administrative & support & waste management services (4.1%)
- Finance & insurance (3.9%)
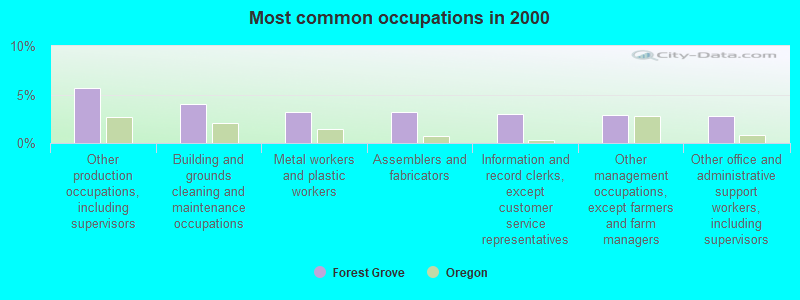
- Other production occupations, including supervisors (5.7%)
- Building and grounds cleaning and maintenance occupations (4.0%)
- Metal workers and plastic workers (3.2%)
- Assemblers and fabricators (3.2%)
- Information and record clerks, except customer service representatives (3.0%)
- Other management occupations, except farmers and farm managers (2.9%)
- Other office and administrative support workers, including supervisors (2.8%)
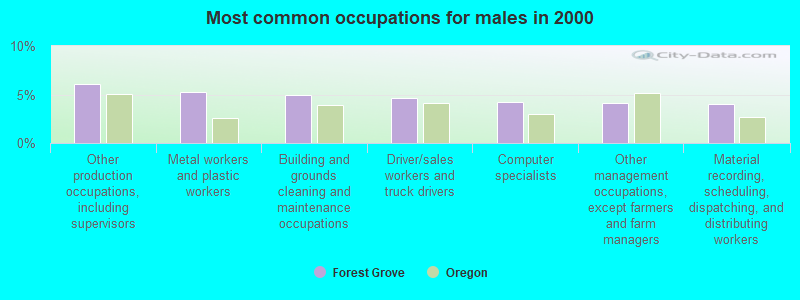
- Other production occupations, including supervisors (6.1%)
- Metal workers and plastic workers (5.3%)
- Building and grounds cleaning and maintenance occupations (5.0%)
- Driver/sales workers and truck drivers (4.7%)
- Computer specialists (4.2%)
- Other management occupations, except farmers and farm managers (4.1%)
- Material recording, scheduling, dispatching, and distributing workers (4.0%)
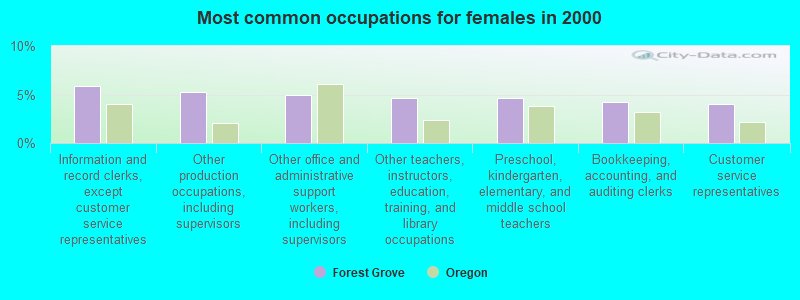
- Information and record clerks, except customer service representatives (5.9%)
- Other production occupations, including supervisors (5.3%)
- Other office and administrative support workers, including supervisors (4.9%)
- Other teachers, instructors, education, training, and library occupations (4.7%)
- Preschool, kindergarten, elementary, and middle school teachers (4.6%)
- Bookkeeping, accounting, and auditing clerks (4.2%)
- Customer service representatives (4.0%)
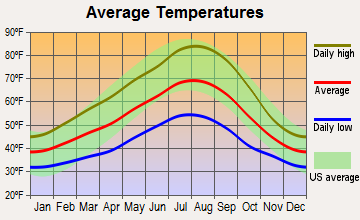
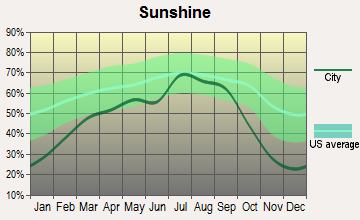
Average climate in Forest Grove, Oregon
Based on data reported by over 4,000 weather stations


|
|


(lower is better)
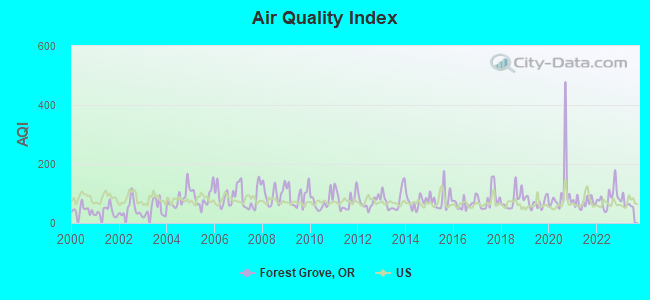
Air Quality Index (AQI) level in 2023 was 66.5. This is about average.
| City: | 66.5 |
| U.S.: | 72.6 |
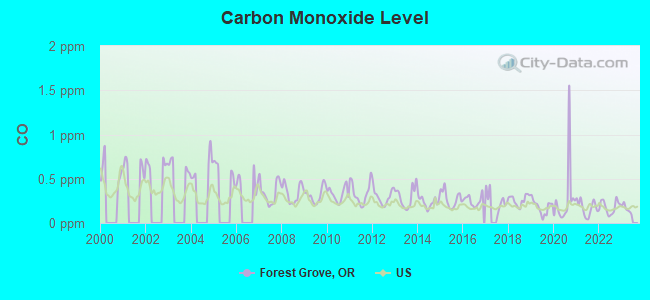
Carbon Monoxide (CO) [ppm] level in 2022 was 0.181. This is better than average. Closest monitor was 20.9 miles away from the city center.
| City: | 0.181 |
| U.S.: | 0.251 |
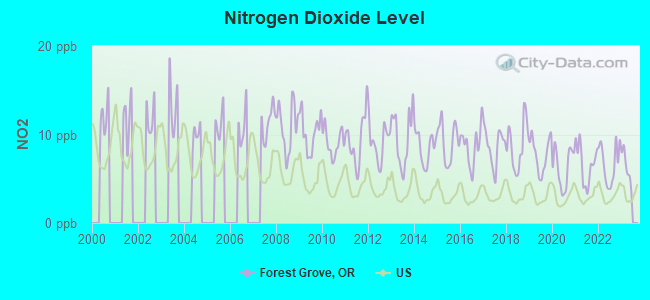
Nitrogen Dioxide (NO2) [ppb] level in 2022 was 6.68. This is worse than average. Closest monitor was 19.7 miles away from the city center.
| City: | 6.68 |
| U.S.: | 5.11 |
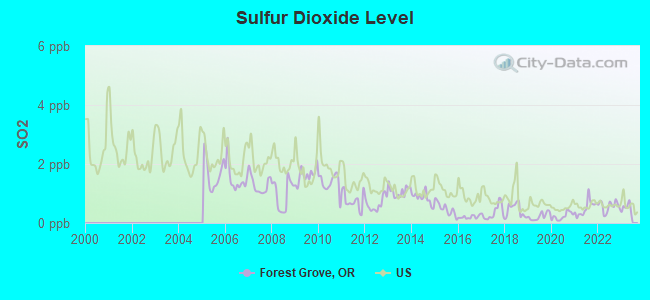
Sulfur Dioxide (SO2) [ppb] level in 2022 was 0.569. This is significantly better than average. Closest monitor was 17.9 miles away from the city center.
| City: | 0.569 |
| U.S.: | 1.515 |
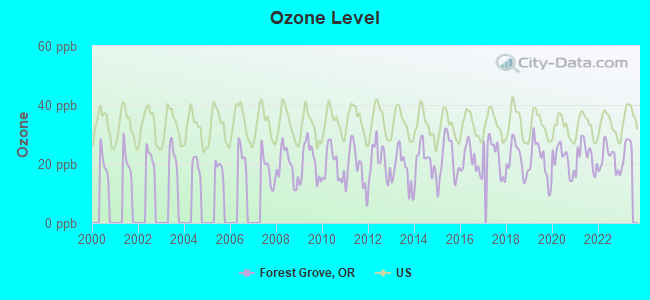
Ozone [ppb] level in 2022 was 21.7. This is significantly better than average. Closest monitor was 20.9 miles away from the city center.
| City: | 21.7 |
| U.S.: | 33.3 |
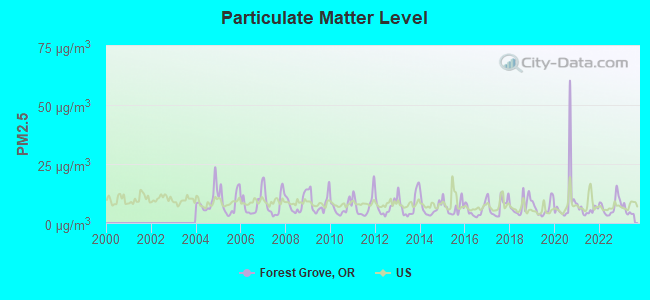
Particulate Matter (PM2.5) [µg/m3] level in 2023 was 5.09. This is significantly better than average. Closest monitor was 6.6 miles away from the city center.
| City: | 5.09 |
| U.S.: | 8.11 |
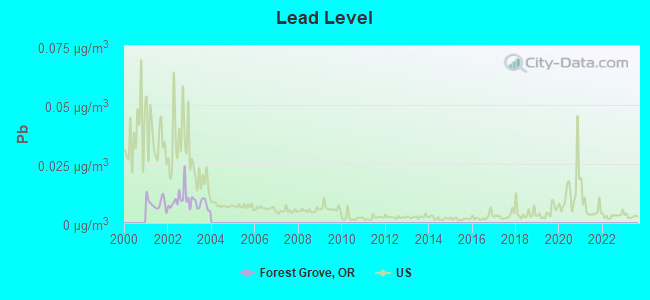
Lead (Pb) [µg/m3] level in 2003 was 0.00810. This is about average. Closest monitor was 10.3 miles away from the city center.
| City: | 0.00810 |
| U.S.: | 0.00931 |
Earthquake activity:
Forest Grove-area historical earthquake activity is significantly above Oregon state average. It is 1421% greater than the overall U.S. average.On 4/13/1949 at 19:55:42, a magnitude 7.0 (7.0 UK, Class: Major, Intensity: VIII - XII) earthquake occurred 123.0 miles away from the city center, causing $80,000,000 total damage
On 2/28/2001 at 18:54:32, a magnitude 6.8 (6.5 MB, 6.6 MS, 6.8 MW, Class: Strong, Intensity: VII - IX) earthquake occurred 111.4 miles away from the city center, causing $2,000,000,000 total damage and $305,000,000 insured losses
On 2/28/2001 at 18:54:32, a magnitude 6.8 (6.8 MD, Depth: 32.2 mi) earthquake occurred 114.0 miles away from the city center
On 4/29/1965 at 15:28:43, a magnitude 6.6 (6.6 UK) earthquake occurred 129.6 miles away from the city center, causing $28,000,000 total damage
On 1/31/1922 at 13:17:28, a magnitude 7.6 (7.6 UK) earthquake occurred 355.5 miles away from Forest Grove center
On 8/17/1991 at 22:17:14, a magnitude 7.1 (6.2 MB, 7.1 MS, 7.1 MW, 6.8 ML, Depth: 8.4 mi) earthquake occurred 288.9 miles away from the city center
Magnitude types: body-wave magnitude (MB), duration magnitude (MD), local magnitude (ML), surface-wave magnitude (MS), moment magnitude (MW)
Natural disasters:
The number of natural disasters in Washington County (12) is smaller than the US average (15).Major Disasters (Presidential) Declared: 10
Emergencies Declared: 1
Causes of natural disasters: Floods: 6, Storms: 5, Landslides: 3, Mudslides: 3, Winds: 3, Snows: 2, Winter Storms: 2, Earthquake: 1, Fire: 1, Heavy Rain: 1, Hurricane: 1, Other: 1 (Note: some incidents may be assigned to more than one category).

Main business address for: MERIX CORP (PRINTED CIRCUIT BOARDS).
Hospitals and medical centers in Forest Grove:
- TUALITY FOREST GROVE HOSPITAL (1809 MAPLE STREET)
- FOREST GROVE REHABILITATION AND CARE CENTER (3900 PACIFIC AVENUE)
- FOREST VIEW CARE CENTER (3300 19TH AVE)
- LOU-DEL HEALTH CARE CENTER (2122 OAK STREET)
- MARQUIS CARE AT FOREST GROVE (3300 19TH AVENUE)
- PNRS RAINES DIALYSIS (1809 MAPLE ST)
- TUALITY HOME HEALTH (3201 19TH AVENUE, SUITE F)
Heliports located in Forest Grove:
See details about Heliports located in Forest Grove, ORCollege/University in Forest Grove:
Other colleges/universities with over 2000 students near Forest Grove:
- George Fox University (about 17 miles; Newberg, OR; Full-time enrollment: 2,954)
- University of Portland (about 19 miles; Portland, OR; FT enrollment: 4,030)
- Portland Community College (about 20 miles; Portland, OR; FT enrollment: 23,600)
- Portland State University (about 21 miles; Portland, OR; FT enrollment: 21,450)
- Pioneer Pacific College (about 22 miles; Wilsonville, OR; FT enrollment: 2,194)
- Lewis & Clark College (about 22 miles; Portland, OR; FT enrollment: 2,864)
- Concordia University-Portland (about 24 miles; Portland, OR; FT enrollment: 3,996)
Public high school in Forest Grove:
- FOREST GROVE HIGH SCHOOL (Students: 1,978, Location: 1401 NICHOLS LN, Grades: 9-12)
Private high school in Forest Grove:
Public elementary/middle schools in Forest Grove:
- NEIL ARMSTRONG MIDDLE SCHOOL (Students: 915, Location: 1777 MT VIEW LN, Grades: 7-8)
- TOM MCCALL UPPER ELEMENTARY (Students: 884, Location: 1341 PACIFIC AVE, Grades: 5-6)
- HARVEY CLARKE ELEMENTARY SCHOOL (Students: 453, Location: 2516 N B ST, Grades: KG-4)
- FERN HILL ELEMENTARY SCHOOL (Students: 328, Location: 4445 HEATHER ST, Grades: KG-4)
- JOSEPH GALE ELEMENTARY SCHOOL (Students: 297, Location: 3130 18TH AVE, Grades: KG-4)
- DILLEY ELEMENTARY SCHOOL (Students: 214, Location: 4115 SW DILLEY RD, Grades: KG-4)
- FOREST GROVE COMMUNITY SCHOOL (Location: 1914 PACIFIC AVENUE, Grades: 1-8, Charter school)
Private elementary/middle school in Forest Grove:
Library in Forest Grove:
Points of interest:
Notable locations in Forest Grove: Pacific University Chuck Bafaro Stadium (A), Pacific University Sherman Larkins Stadium (B), Pacific University Lincoln Stadium (C), Pacific University Pacific Athletics Center (D), Forest Grove Water Treatment Plant (E), Forest Grove Wastewater Treatment Facility (F), Forest Grove City Library (G), Forest Grove Municipal Court (H), Forest Grove City Hall (I), Forest Grove Fire and Rescue Headquarters (J), Theatre in the Grove (K), Forest Grove Public Works (L), Old College Hall (M). Display/hide their locations on the map
Shopping Center: Forest Grove Center Shopping Center (1). Display/hide its location on the map
Main business address in Forest Grove: MERIX CORP (A). Display/hide its location on the map
Churches in Forest Grove include: Saint Anthony's Catholic Church (A), Church of Jesus Christ of Latter Day Saints (B), Saint Bedes Episcopal Church (C). Display/hide their locations on the map
Cemeteries: Forest View Cemetery (1), Mountain View Memorial Gardens (2). Display/hide their locations on the map
Parks in Forest Grove include: Joseph Gale Park (1), Bard Park (2), Lincoln Park (3), Hazel Sills Park (4), Forest Glen Park (5), Rogers Park (6), Knox Ridge City Park (7), Reuter City Park (8), Stites City Park (9). Display/hide their locations on the map
Tourist attractions: Godfather's Pizza (Museums; 2834 Pacific Avenue Suite A), Friends of Historic Forest Grove (Historical Places & Services; 2004 Main Street), Chamber of Commerce - Forest Grove (2417 Pacific Avenue).
Hotels: Grand Lodge (3505 Pacific Avenue), Quality Holiday Motel (3224 Pacific Avenue), Forest Grove Inn (4433 Pacific Avenue), Grand Lodge - Yardhouse (3505 Pacific Avenue), Best Western University Inn (3933 Pacific Avenue), Budget Inn (1925 Centre Street), Forest Grove Travelodge Suites (3306 Pacific Ave).
Birthplace of: Aaron Stark - Sport wrestler and martial artist, Anthony E. Van Dyke - Marine Corps officer, James Paul - Conductor, Richard VanGrunsven - Aerospace engineer, Bryan Herb - Television personality, Norman Ralston - Aviator, Travis Baptist - Baseball player.
Drinking water stations with addresses in Forest Grove and their reported violations in the past:
FOREST GROVE, CITY OF (Population served: 20,775, Surface water):Past monitoring violations:ODF REEHERS CAMPGROUND (Population served: 75, Groundwater):
- Monitoring, Source Water (LT2) - In JAN-01-2008, Contaminant: LT2ESWTR. Follow-up actions: Fed Compliance achieved (JAN-15-2008)
- 2 regular monitoring violations
Past health violations:ODF BROWNS CAMP FORREST PARK (Population served: 41, Groundwater):Past monitoring violations:
- MCL, Monthly (TCR) - Between OCT-2007 and DEC-2007, Contaminant: Coliform. Follow-up actions: St Compliance achieved (MAR-25-2008)
- One routine major monitoring violation
- One regular monitoring violation
Past health violations:SUNSET GROVE GOLF CLUB (Population served: 25, Groundwater):Past monitoring violations:
- MCL, Monthly (TCR) - Between OCT-2012 and DEC-2012, Contaminant: Coliform. Follow-up actions: St Public Notif requested (DEC-21-2012), St Violation/Reminder Notice (DEC-31-2012), St Public Notif received (JAN-30-2013), St Compliance achieved (APR-18-2013)
- One routine major monitoring violation
- One regular monitoring violation
Past monitoring violations:ODF ELK CREEK CG (Population served: 25, Groundwater):
- Monitoring, Repeat Major (TCR) - Between JUL-2007 and SEP-2007, Contaminant: Coliform (TCR). Follow-up actions: St Compliance achieved (APR-09-2008)
Past health violations:ODF GALES CREEK CAMPGROUND (Population served: 25, Groundwater):Past monitoring violations:
- MCL, Acute (TCR) - Between APR-2012 and JUN-2012, Contaminant: Coliform. Follow-up actions: St Violation/Reminder Notice (JUL-30-2012), St Public Notif received (FEB-22-2013), St Public Notif requested (FEB-22-2013), St Compliance achieved (MAR-12-2013)
- 2 routine major monitoring violations
- One regular monitoring violation
Past health violations:Past monitoring violations:
- MCL, Monthly (TCR) - Between JUL-2013 and SEP-2013, Contaminant: Coliform. Follow-up actions: St Public Notif received (SEP-17-2013), St Public Notif requested (OCT-11-2013), St Compliance achieved (OCT-21-2013)
- One routine major monitoring violation
- One regular monitoring violation
| This city: | 2.7 people |
| Oregon: | 2.5 people |
| This city: | 66.0% |
| Whole state: | 63.4% |
| This city: | 6.6% |
| Whole state: | 8.0% |
Likely homosexual households (counted as self-reported same-sex unmarried-partner households)
- Lesbian couples: 0.3% of all households
- Gay men: 0.2% of all households
People in group quarters in Forest Grove in 2010:
- 822 people in college/university student housing
- 116 people in nursing facilities/skilled-nursing facilities
- 54 people in group homes intended for adults
- 54 people in residential treatment centers for adults
- 5 people in workers' group living quarters and job corps centers
People in group quarters in Forest Grove in 2000:
- 642 people in college dormitories (includes college quarters off campus)
- 172 people in nursing homes
- 110 people in other noninstitutional group quarters
- 22 people in homes for the mentally retarded
- 12 people in other group homes
Banks with branches in Forest Grove (2011 data):
- Wells Fargo Bank, National Association: Forest Grove Branch at 1905 Pacific Aveenue, branch established on 1999/11/03. Info updated 2011/04/05: Bank assets: $1,161,490.0 mil, Deposits: $905,653.0 mil, headquarters in Sioux Falls, SD, positive income, 6395 total offices, Holding Company: Wells Fargo & Company
- Bank of the West: Forest Grove Branch at 1926 Pacific Avenue, branch established on 1925/01/01. Info updated 2009/11/16: Bank assets: $62,408.3 mil, Deposits: $43,995.2 mil, headquarters in San Francisco, CA, positive income, 647 total offices, Holding Company: Bnp Paribas
- U.S. Bank National Association: Forest Grove Branch at 1940 Pacific Avenue, branch established on 1907/03/01. Info updated 2012/01/30: Bank assets: $330,470.8 mil, Deposits: $236,091.5 mil, headquarters in Cincinnati, OH, positive income, 3121 total offices, Holding Company: U.S. Bancorp
- Columbia Community Bank: Forest Grove Branch at 2811 19th Avaenue, Suite A, branch established on 2002/04/02. Info updated 2006/11/03: Bank assets: $352.2 mil, Deposits: $239.3 mil, headquarters in Hillsboro, OR, positive income, Commercial Lending Specialization, 4 total offices, Holding Company: Columbia Commercial Bancorp
- West Coast Bank: Forest Grove Branch at 4110 Pacific Avenue, branch established on 1981/01/02. Info updated 2010/09/16: Bank assets: $2,424.8 mil, Deposits: $1,925.6 mil, headquarters in Lake Oswego, OR, positive income, Commercial Lending Specialization, 63 total offices, Holding Company: West Coast Bancorp
For population 15 years and over in Forest Grove:
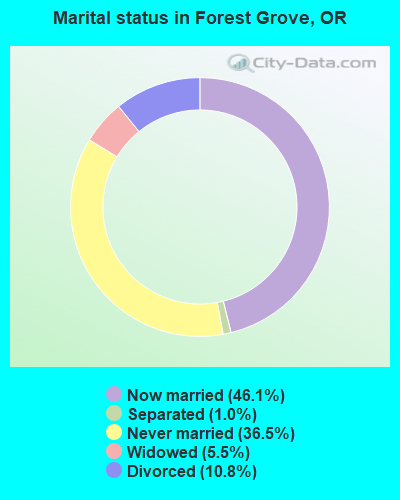
- Never married: 36.5%
- Now married: 46.1%
- Separated: 1.0%
- Widowed: 5.5%
- Divorced: 10.8%
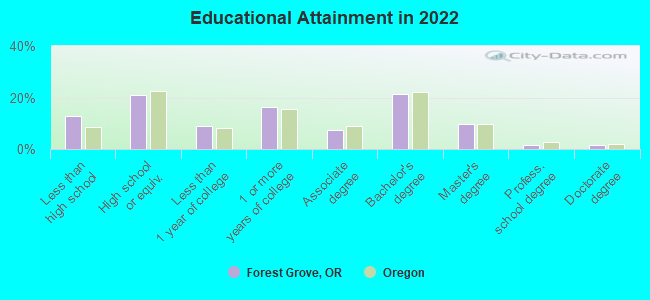
For population 25 years and over in Forest Grove:
- High school or higher: 88.1%
- Bachelor's degree or higher: 33.4%
- Graduate or professional degree: 12.4%
- Unemployed: 8.0%
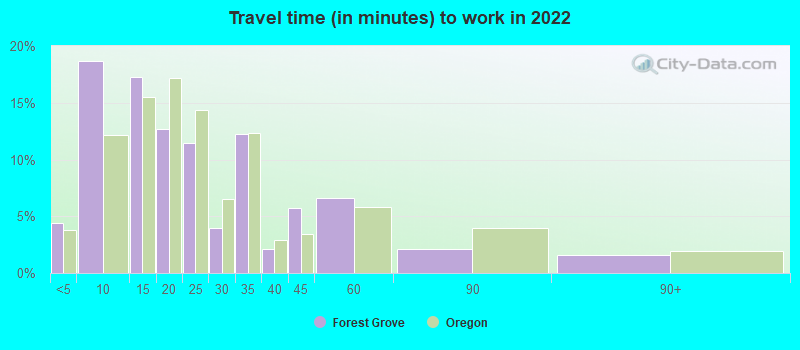
- Mean travel time to work (commute): 23.2 minutes
| Here: | 14.2 |
| Oregon average: | 11.6 |
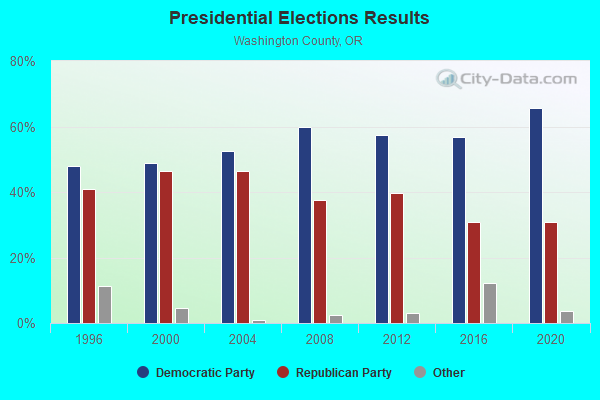
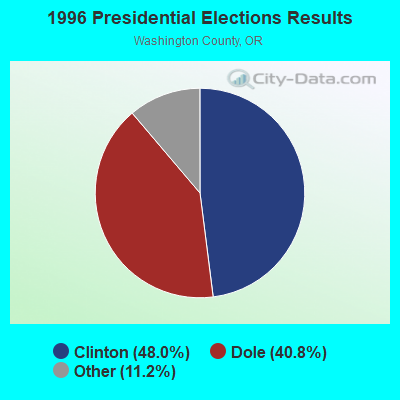
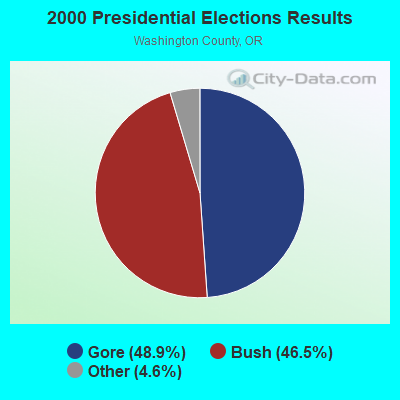
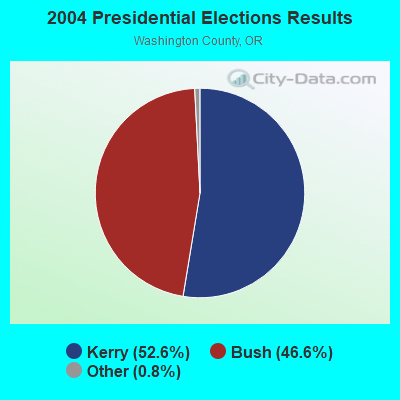
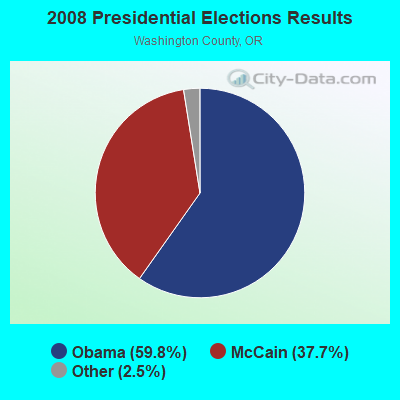
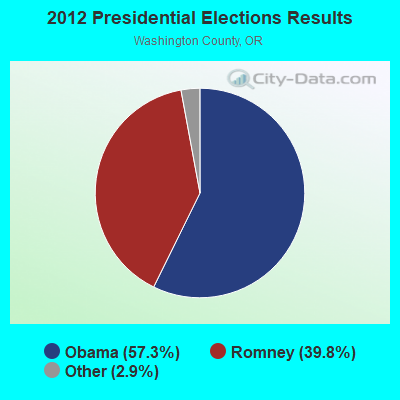
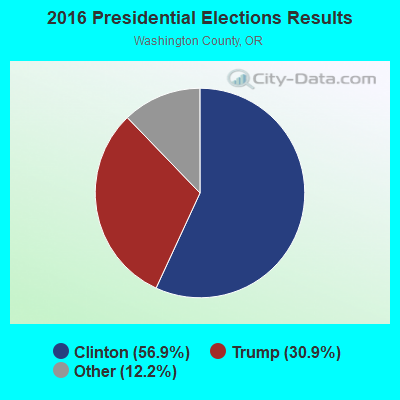
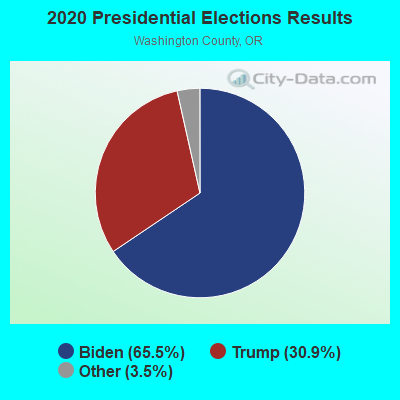
Graphs represent county-level data. Detailed 2008 Election Results
Religion statistics for Forest Grove, OR (based on Washington County data)
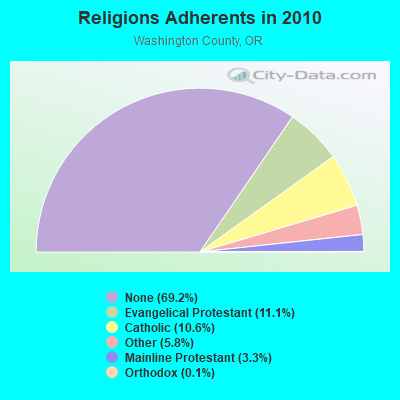
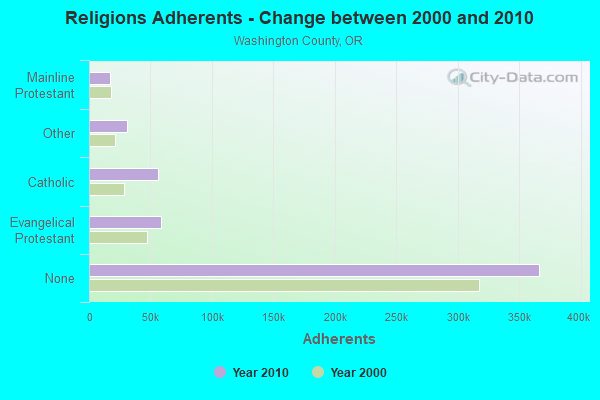
| Religion | Adherents | Congregations |
|---|---|---|
| Evangelical Protestant | 58,752 | 200 |
| Catholic | 55,886 | 11 |
| Other | 30,823 | 77 |
| Mainline Protestant | 17,404 | 53 |
| Orthodox | 550 | 1 |
| None | 366,295 | - |
Food Environment Statistics:
| Here: | 1.44 / 10,000 pop. |
| Oregon: | 2.03 / 10,000 pop. |
| Here: | 0.33 / 10,000 pop. |
| State: | 0.33 / 10,000 pop. |
| Washington County: | 1.42 / 10,000 pop. |
| State: | 2.01 / 10,000 pop. |
| Here: | 0.90 / 10,000 pop. |
| Oregon: | 1.69 / 10,000 pop. |
| Washington County: | 7.35 / 10,000 pop. |
| State: | 9.93 / 10,000 pop. |
| Washington County: | 6.5% |
| State: | 7.4% |
| This county: | 24.0% |
| Oregon: | 25.6% |
| Washington County: | 13.8% |
| Oregon: | 14.2% |
Health and Nutrition:
| Forest Grove: | 48.0% |
| State: | 49.6% |
| Forest Grove: | 45.7% |
| Oregon: | 46.8% |
| This city: | 28.3 |
| Oregon: | 28.5 |
| This city: | 21.0% |
| Oregon: | 21.2% |
| Here: | 11.1% |
| Oregon: | 10.1% |
| Forest Grove: | 6.8 |
| Oregon: | 6.8 |
| Here: | 32.1% |
| Oregon: | 33.3% |
| Forest Grove: | 56.0% |
| Oregon: | 56.5% |
| Forest Grove: | 79.3% |
| Oregon: | 78.7% |
More about Health and Nutrition of Forest Grove, OR Residents
| Local government employment and payroll (March 2022) | |||||
| Function | Full-time employees | Monthly full-time payroll | Average yearly full-time wage | Part-time employees | Monthly part-time payroll |
|---|---|---|---|---|---|
| Other Government Administration | 26 | $138,572 | $63,956 | 0 | $0 |
| Police Protection - Officers | 24 | $186,383 | $93,192 | 1 | $810 |
| Firefighters | 17 | $163,642 | $115,512 | 19 | $1,511 |
| Electric Power | 17 | $150,600 | $106,306 | 0 | $0 |
| Water Supply | 16 | $86,304 | $64,728 | 0 | $0 |
| Other and Unallocable | 16 | $113,712 | $85,284 | 0 | $0 |
| Financial Administration | 12 | $81,486 | $81,486 | 0 | $0 |
| Parks and Recreation | 12 | $73,355 | $73,355 | 23 | $18,151 |
| Local Libraries | 9 | $55,486 | $73,981 | 4 | $10,713 |
| Police - Other | 8 | $59,347 | $89,021 | 0 | $0 |
| Fire - Other | 5 | $44,906 | $107,774 | 0 | $0 |
| Judicial and Legal | 2 | $11,105 | $66,630 | 0 | $0 |
| Solid Waste Management | 1 | $5,100 | $61,200 | 0 | $0 |
| Sewerage | 1 | $6,269 | $75,228 | 0 | $0 |
| Streets and Highways | 1 | $5,972 | $71,664 | 0 | $0 |
| Totals for Government | 167 | $1,182,238 | $84,951 | 47 | $31,185 |
Forest Grove government finances - Expenditure in 2021 (per resident):
- Construction - Parks and Recreation: $1,315,000 ($49.10)
Regular Highways: $511,000 ($19.08)
Electric Utilities: $352,000 ($13.14)
Water Utilities: $328,000 ($12.25)
Sewerage: $171,000 ($6.38)
Central Staff Services: $148,000 ($5.53)
Police Protection: $33,000 ($1.23)
- Current Operations - Electric Utilities: $18,938,000 ($707.06)
Police Protection: $6,105,000 ($227.93)
Local Fire Protection: $5,125,000 ($191.35)
Financial Administration: $3,277,000 ($122.35)
Water Utilities: $2,944,000 ($109.92)
Central Staff Services: $2,250,000 ($84.01)
Regular Highways: $2,132,000 ($79.60)
Sewerage: $2,072,000 ($77.36)
General - Other: $1,748,000 ($65.26)
Parks and Recreation: $1,381,000 ($51.56)
Libraries: $1,311,000 ($48.95)
Protective Inspection and Regulation - Other: $741,000 ($27.67)
Judicial and Legal Services: $342,000 ($12.77)
Housing and Community Development: $101,000 ($3.77)
- Electric Utilities - Interest on Debt: $71,000 ($2.65)
- Intergovernmental to Local - Other - Local Fire Protection: $58,000 ($2.17)
Other - Water Utilities: $27,000 ($1.01)
Other - Police Protection: $24,000 ($0.90)
Other - General - Other: $24,000 ($0.90)
Other - Judicial and Legal Services: $22,000 ($0.82)
Other - Regular Highways: $8,000 ($0.30)
Other - Parks and Recreation: $1,000 ($0.04)
Other - Electric Utilities: $1,000 ($0.04)
- Intergovernmental to State - Protective Inspection and Regulations - Other: $156,000 ($5.82)
Water Utilities: $47,000 ($1.75)
Regular Highways: $12,000 ($0.45)
Financial Administration: $5,000 ($0.19)
Central Staff Services: $1,000 ($0.04)
Electric Utilities: $1,000 ($0.04)
- Other Capital Outlay - Local Fire Protection: $2,999,000 ($111.97)
Electric Utilities: $712,000 ($26.58)
Central Staff Services: $297,000 ($11.09)
Parks and Recreation: $234,000 ($8.74)
Police Protection: $155,000 ($5.79)
Water Utilities: $151,000 ($5.64)
Financial Administration: $61,000 ($2.28)
Sewerage: $11,000 ($0.41)
Libraries: $6,000 ($0.22)
- Total Salaries and Wages: $14,563,000 ($543.72)
- Water Utilities - Interest on Debt: $59,000 ($2.20)
Forest Grove government finances - Revenue in 2021 (per resident):
- Charges - Other: $2,184,000 ($81.54)
Sewerage: $1,678,000 ($62.65)
- Federal Intergovernmental - Other: $2,793,000 ($104.28)
- Local Intergovernmental - General Local Government Support: $1,760,000 ($65.71)
Other: $916,000 ($34.20)
- Miscellaneous - General Revenue - Other: $2,798,000 ($104.47)
Interest Earnings: $652,000 ($24.34)
Fines and Forfeits: $476,000 ($17.77)
Donations From Private Sources: $453,000 ($16.91)
Sale of Property: $113,000 ($4.22)
- Revenue - Electric Utilities: $20,607,000 ($769.38)
Water Utilities: $6,637,000 ($247.80)
- State Intergovernmental - General Local Government Support: $3,176,000 ($118.58)
Other: $408,000 ($15.23)
- Tax - Property: $10,372,000 ($387.25)
Other License: $5,563,000 ($207.70)
Public Utilities Sales: $597,000 ($22.29)
Other Selective Sales: $194,000 ($7.24)
Occupation and Business License - Other: $68,000 ($2.54)
Forest Grove government finances - Debt in 2021 (per resident):
- Long Term Debt - Beginning Outstanding - Public Debt for Private Purpose: $92,612,000 ($3457.74)
Outstanding Nonguaranteed - Industrial Revenue: $84,377,000 ($3150.28)
Retired Nonguaranteed - Public Debt for Private Purpose: $8,235,000 ($307.46)
Outstanding Unspecified Public Purpose: $5,196,000 ($194.00)
Beginning Outstanding - Unspecified Public Purpose: $4,848,000 ($181.00)
Issue, Unspecified Public Purpose: $1,016,000 ($37.93)
Retired Unspecified Public Purpose: $669,000 ($24.98)
Forest Grove government finances - Cash and Securities in 2021 (per resident):
- Other Funds - Cash and Securities: $69,425,000 ($2592.03)
- Sinking Funds - Cash and Securities: $84,377,000 ($3150.28)
8.36% of this county's 2021 resident taxpayers lived in other counties in 2020 ($73,593 average adjusted gross income)
| Here: | 8.36% |
| Oregon average: | 8.20% |
0.01% of residents moved from foreign countries ($84 average AGI)
Washington County: 0.01% Oregon average: 0.01%
Top counties from which taxpayers relocated into this county between 2020 and 2021:
| from Multnomah County, OR | |
| from Clackamas County, OR | |
| from Clark County, WA |
8.64% of this county's 2020 resident taxpayers moved to other counties in 2021 ($92,423 average adjusted gross income)
| Here: | 8.64% |
| Oregon average: | 8.24% |
0.01% of residents moved to foreign countries ($83 average AGI)
Washington County: 0.01% Oregon average: 0.00%
Top counties to which taxpayers relocated from this county between 2020 and 2021:
| to Multnomah County, OR | |
| to Clackamas County, OR | |
| to Clark County, WA |
| Businesses in Forest Grove, OR | ||||
| Name | Count | Name | Count | |
|---|---|---|---|---|
| 7-Eleven | 1 | H&R Block | 1 | |
| Ace Hardware | 1 | McDonald's | 1 | |
| AutoZone | 1 | Quiznos | 1 | |
| Best Western | 1 | Starbucks | 1 | |
| Curves | 1 | Taco Bell | 1 | |
| Domino's Pizza | 1 | UPS | 1 | |
| FedEx | 2 | Vons | 1 | |
| Ford | 1 | |||
Strongest AM radio stations in Forest Grove:
- KPOJ (620 AM; 50 kW; PORTLAND, OR; Owner: CITICASTERS LICENSES, L.P.)
- KPAM (860 AM; 50 kW; TROUTDALE, OR; Owner: PAMPLIN BROADCASTING-OREGON, INC.)
- KXL (750 AM; 50 kW; PORTLAND, OR; Owner: ROSE CITY RADIO CORPORATION)
- KEX (1190 AM; 50 kW; PORTLAND, OR; Owner: CITICASTERS LICENSES, L.P.)
- KOTK (1080 AM; 50 kW; PORTLAND, OR; Owner: FISHER BROADCASTING - PORTLAND RADIO, L.L.C.)
- KKSN (1520 AM; 50 kW; OREGON CITY, OR; Owner: ENTERCOM PORTLAND LICENSE, LLC)
- KUIK (1360 AM; 5 kW; HILLSBORO, OR; Owner: DOLPHIN COMMUNICATIONS, INC.)
- KKAD (1550 AM; 50 kW; VANCOUVER, WA; Owner: PAMPLIN BROADCASTING-WASHINGTON, INC)
- KUPL (970 AM; 5 kW; PORTLAND, OR; Owner: INFINITY RADIO OPERATIONS INC.)
- KFXX (910 AM; 10 kW; VANCOUVER, WA; Owner: ENTERCOM PORTLAND LICENSE, LLC (DE))
- KKSL (1290 AM; 10 kW; LAKE OSWEGO, OR; Owner: ABC, INC.)
- KDZR (1640 AM; 10 kW; LAKE OSWEGO, OR; Owner: ABC, INC.)
- KBNP (1410 AM; 5 kW; PORTLAND, OR; Owner: KBNP RADIO, INC.)
Strongest FM radio stations in Forest Grove:
- KINK (101.9 FM; PORTLAND, OR; Owner: INFINITY RADIO OPERATIONS INC.)
- K225AI (92.9 FM; PORTLAND, OR; Owner: EDUCATIONAL MEDIA FOUNDATION)
- KKCW (103.3 FM; BEAVERTON, OR; Owner: CITICASTERS LICENSES, L.P.)
- KPDQ-FM (93.7 FM; PORTLAND, OR; Owner: SALEM MEDIA OF OREGON, INC.)
- KKRZ (100.3 FM; PORTLAND, OR; Owner: CITICASTERS LICENSES, L.P.)
- KOPB-FM (91.5 FM; PORTLAND, OR; Owner: OREGON PUBLIC BROADCASTING)
- KRVO (105.9 FM; VANCOUVER, WA; Owner: CITICASTERS LICENSES, L.P.)
- KMHD (89.1 FM; GRESHAM, OR; Owner: MT. HOOD COMMUNITY COLLEGE DISTRICT)
- KVMX (107.5 FM; BANKS, OR; Owner: INFINITY RADIO OPERATIONS INC.)
- KLTH (106.7 FM; LAKE OSWEGO, OR; Owner: INIFINITY RADIO OF PORTLAND INC.)
- KUPL-FM (98.7 FM; PORTLAND, OR; Owner: INFINITY RADIO OF PORTLAND INC.)
- KUFO-FM (101.1 FM; PORTLAND, OR; Owner: INFINITY RADIO OPERATIONS INC.)
- KBVM (88.3 FM; PORTLAND, OR; Owner: CATHOLIC BROADCASTING NORTHWEST, INC)
- KBPS-FM (89.9 FM; PORTLAND, OR; Owner: SCHOOL DISTRICT #1, MULTNOMAH COUNTY, OR)
- KNRK (94.7 FM; CAMAS, WA; Owner: ENTERCOM PORTLAND LICENSE, LLC (DE))
- KBOO (90.7 FM; PORTLAND, OR; Owner: THE KBOO FOUNDATION)
- KWJJ-FM (99.5 FM; PORTLAND, OR; Owner: FISHER BROADCASTING - PORTLAND RADIO, L.L.C.)
- KFIS (104.1 FM; SCAPPOOSE, OR; Owner: CARON BROADCASTING, INC.)
- KGON (92.3 FM; PORTLAND, OR; Owner: ENTERCOM PORTLAND LICENSE, LLC (DE))
- KKSN-FM (97.1 FM; PORTLAND, OR; Owner: ENTERCOM PORTLAND LICENSE, LLC (DE))
TV broadcast stations around Forest Grove:
- KATU (Channel 2; PORTLAND, OR; Owner: FISHER BROADCASTING - PORTLAND TV, L.L.C.)
- KPDX (Channel 49; VANCOUVER, WA; Owner: MEREDITH CORPORATION)
- KPTV (Channel 12; PORTLAND, OR; Owner: MEREDITH CORPORATION)
- K57IF (Channel 57; SALEM, OR; Owner: LaGRANDE BROADCASTING, INC.)
- KWBP-LP (Channel 4; PORTLAND, OR; Owner: TRIBUNE BROADCASTING HOLDINGS, INC.)
- KNMT (Channel 24; PORTLAND, OR; Owner: NATIONAL MINORITY T.V., INC.)
- KOIN (Channel 6; PORTLAND, OR; Owner: EMMIS TELEVISION LICENSE CORPORATION)
- KGW (Channel 8; PORTLAND, OR; Owner: KING BROADCASTING COMPANY)
- KOPB-TV (Channel 10; PORTLAND, OR; Owner: OREGON PUBLIC BROADCASTING)
- K18EL (Channel 18; NEWBERG/TIGARD, OR; Owner: MEREDITH CORPORATION)
- KPXG-LP (Channel 54; PORTLAND, OR; Owner: PAXSON COMMUNICATIONS LICENSE COMPANY, LLC)
- K14HN (Channel 14; VANCOUVER/CAMAS, WA; Owner: MEREDITH CORPORATION)
- KPXG (Channel 22; SALEM, OR; Owner: PAXSON SALEM LICENSE, INC.)
- KOXO-CA (Channel 51; NEWBERG, OR; Owner: WATCHTV, INC.)
- National Bridge Inventory (NBI) Statistics
- 22Number of bridges
- 240ft / 72.5mTotal length
- $1,373,000Total costs
- 114,683Total average daily traffic
- 17,810Total average daily truck traffic
- 183,880Total future (year 2025) average daily traffic
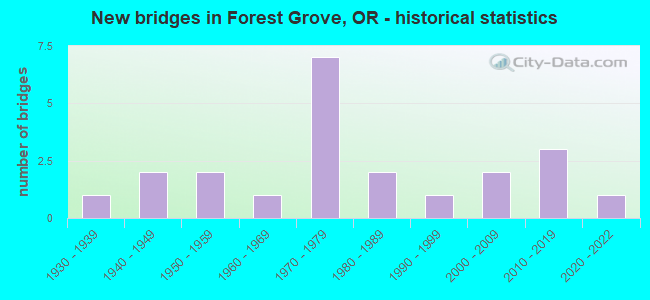
- New bridges - historical statistics
- 11930-1939
- 21940-1949
- 21950-1959
- 11960-1969
- 71970-1979
- 21980-1989
- 11990-1999
- 22000-2009
- 32010-2019
- 12020-2022
FCC Registered Antenna Towers: 31 (See the full list of FCC Registered Antenna Towers)
FCC Registered Private Land Mobile Towers: 2 (See the full list of FCC Registered Private Land Mobile Towers in Forest Grove, OR)
FCC Registered Broadcast Land Mobile Towers: 20 (See the full list of FCC Registered Broadcast Land Mobile Towers)
FCC Registered Microwave Towers: 26 (See the full list of FCC Registered Microwave Towers in this town)
FCC Registered Amateur Radio Licenses: 236 (See the full list of FCC Registered Amateur Radio Licenses in Forest Grove)
FAA Registered Aircraft: 19 (See the full list of FAA Registered Aircraft in Forest Grove)
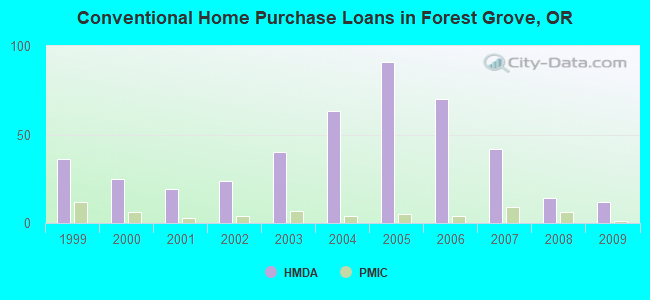
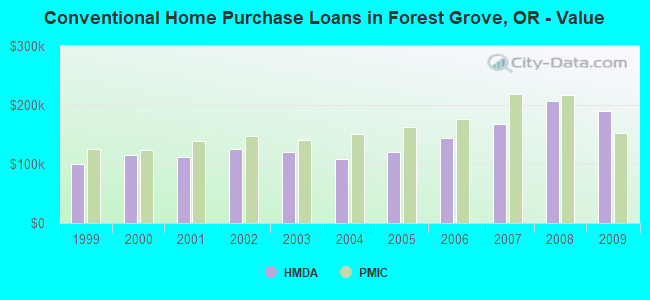
| Home Mortgage Disclosure Act Aggregated Statistics For Year 2009 (Based on 3 partial tracts) | ||||||||||||
| A) FHA, FSA/RHS & VA Home Purchase Loans | B) Conventional Home Purchase Loans | C) Refinancings | D) Home Improvement Loans | F) Non-occupant Loans on < 5 Family Dwellings (A B C & D) | G) Loans On Manufactured Home Dwelling (A B C & D) | |||||||
|---|---|---|---|---|---|---|---|---|---|---|---|---|
| Number | Average Value | Number | Average Value | Number | Average Value | Number | Average Value | Number | Average Value | Number | Average Value | |
| LOANS ORIGINATED | 13 | $194,545 | 12 | $189,712 | 46 | $188,980 | 1 | $111,150 | 4 | $182,778 | 1 | $68,330 |
| APPLICATIONS APPROVED, NOT ACCEPTED | 0 | $0 | 1 | $96,680 | 8 | $185,885 | 0 | $0 | 1 | $153,320 | 0 | $0 |
| APPLICATIONS DENIED | 2 | $197,420 | 1 | $152,120 | 25 | $181,174 | 2 | $81,745 | 3 | $173,227 | 0 | $0 |
| APPLICATIONS WITHDRAWN | 2 | $156,030 | 2 | $172,075 | 16 | $185,059 | 0 | $0 | 1 | $186,500 | 0 | $0 |
| FILES CLOSED FOR INCOMPLETENESS | 1 | $104,870 | 0 | $0 | 5 | $213,050 | 0 | $0 | 0 | $0 | 0 | $0 |
Detailed HMDA statistics for the following Tracts: 0329.02 , 0331.00, 0332.00
| Private Mortgage Insurance Companies Aggregated Statistics For Year 2009 (Based on 3 partial tracts) | ||||
| A) Conventional Home Purchase Loans | B) Refinancings | |||
|---|---|---|---|---|
| Number | Average Value | Number | Average Value | |
| LOANS ORIGINATED | 1 | $152,130 | 1 | $148,210 |
| APPLICATIONS APPROVED, NOT ACCEPTED | 0 | $0 | 1 | $118,160 |
| APPLICATIONS DENIED | 0 | $0 | 1 | $166,230 |
| APPLICATIONS WITHDRAWN | 0 | $0 | 0 | $0 |
| FILES CLOSED FOR INCOMPLETENESS | 0 | $0 | 0 | $0 |
Detailed PMIC statistics for the following Tracts: 0329.02 , 0331.00, 0332.00
2002 - 2018 National Fire Incident Reporting System (NFIRS) incidents
- Fire incident types reported to NFIRS in Forest Grove, OR
- 92446.2%Structure Fires
- 78139.0%Outside Fires
- 20510.2%Mobile Property/Vehicle Fires
- 914.5%Other
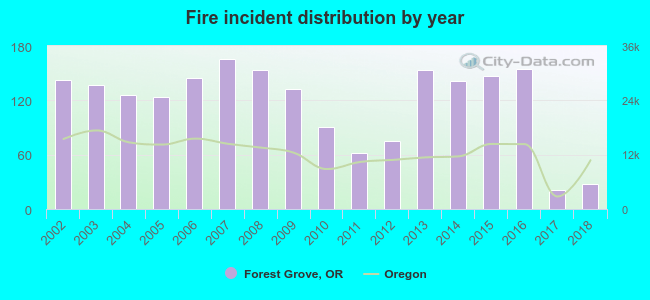 According to the data from the years 2002 - 2018 the average number of fires per year is 118. The highest number of fires - 166 took place in 2007, and the least - 21 in 2017. The data has a declining trend.
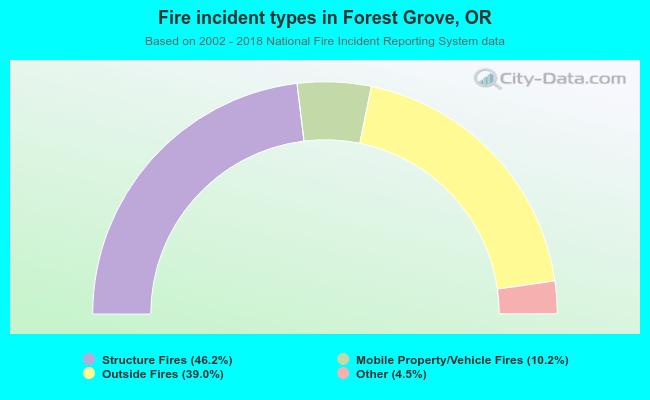 When looking into fire subcategories, the most incidents belonged to: Structure Fires (46.2%), and Outside Fires (39.0%).
Fire-safe hotels and motels in Forest Grove, Oregon:
- Best Western University Inn & Suites, 3933 Pacific Ave, Forest Grove, Oregon 97116 , Phone: (503) 992-8888, Fax: (503) 992-8444
- Mcmenamins Grand Lodge, 3505 Pacific Ave, Forest Grove, Oregon 97116 , Phone: (503) 992-9533, Fax: (503) 992-3444
- Americas Best Value Inn & Suites, 3306 Pacific Ave, Forest Grove, Oregon 97116 , Phone: (503) 357-9000, Fax: (503) 359-4134
| Most common first names in Forest Grove, OR among deceased individuals | ||
| Name | Count | Lived (average) |
|---|---|---|
| Mary | 114 | 83.2 years |
| William | 109 | 80.7 years |
| John | 103 | 79.6 years |
| Robert | 84 | 75.4 years |
| James | 74 | 75.0 years |
| George | 72 | 78.0 years |
| Helen | 71 | 83.2 years |
| Margaret | 60 | 83.3 years |
| Charles | 57 | 75.1 years |
| Ruth | 55 | 80.4 years |
| Most common last names in Forest Grove, OR among deceased individuals | ||
| Last name | Count | Lived (average) |
|---|---|---|
| Smith | 60 | 77.4 years |
| Johnson | 48 | 82.7 years |
| Anderson | 31 | 84.7 years |
| Wilson | 31 | 77.5 years |
| Jones | 30 | 78.1 years |
| Vanderzanden | 29 | 82.2 years |
| Brown | 28 | 78.8 years |
| Miller | 28 | 77.4 years |
| Davis | 25 | 80.1 years |
| Thompson | 24 | 75.5 years |
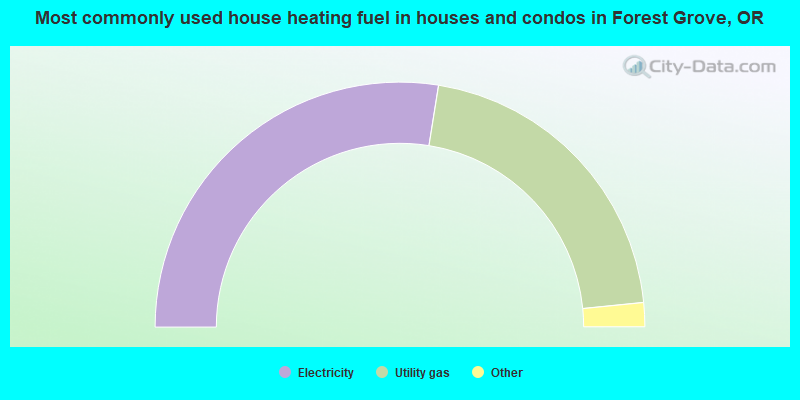
- 55.1%Electricity
- 41.8%Utility gas
- 1.4%Fuel oil, kerosene, etc.
- 0.9%Wood
- 0.6%No fuel used
- 0.3%Bottled, tank, or LP gas
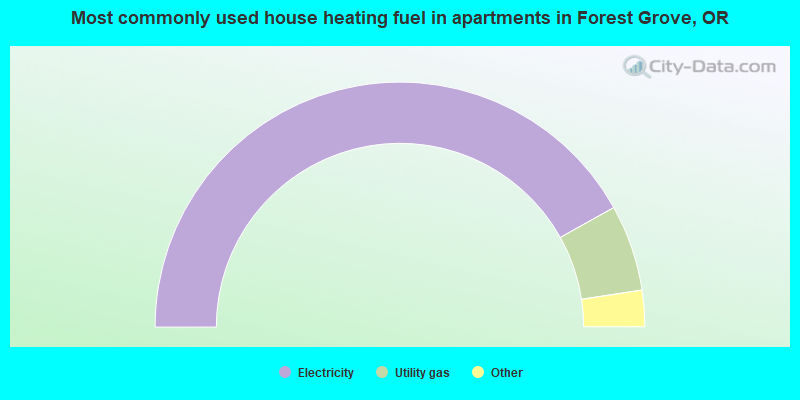
- 83.8%Electricity
- 11.4%Utility gas
- 2.3%Wood
- 1.4%No fuel used
- 0.6%Fuel oil, kerosene, etc.
- 0.5%Bottled, tank, or LP gas
Forest Grove compared to Oregon state average:
- Unemployed percentage below state average.
- Hispanic race population percentage significantly above state average.
- Median age below state average.
- Foreign-born population percentage above state average.
- Length of stay since moving in significantly above state average.
- Number of college students above state average.
Forest Grove on our top lists:
- #75 on the list of "Top 101 cities with largest percentage of females in occupations: installation, maintenance, and repair occupations (population 5,000+)"
- #9 on the list of "Top 101 counties with the highest percentage of residents that exercised in the past month"
- #32 on the list of "Top 101 counties with the largest increase in the number of infant deaths per 1000 residents 2000-2006 to 2007-2013 (pop. 50,000+)"
- #42 on the list of "Top 101 counties with the largest number of children under 18 without health insurance coverage in 2000 (pop. 50,000+)"
- #47 on the list of "Top 101 counties with the lowest number of infant deaths per 1000 residents 2007-2013 (pop. 50,000+)"
- #49 on the list of "Top 101 counties with the lowest percentage of residents that smoked 100+ cigarettes in their lives"

|
|
Total of 386 patent applications in 2008-2024.