Ashland, Kentucky Submit your own pictures of this city and show them to the world
OSM Map
General Map
Google Map
MSN Map
OSM Map
General Map
Google Map
MSN Map
OSM Map
General Map
Google Map
MSN Map
OSM Map
General Map
Google Map
MSN Map
Please wait while loading the map...
Population in 2022: 21,342 (100% urban, 0% rural). Population change since 2000: -2.9%Males: 9,673 Females: 11,669
March 2022 cost of living index in Ashland: 81.7 (low, U.S. average is 100) Percentage of residents living in poverty in 2022: 21.1%for White Non-Hispanic residents , 24.1% for Black residents , 7.7% for other race residents , 58.9% for two or more races residents )
Profiles of local businesses
Business Search - 14 Million verified businesses
Data:
Median household income ($)
Median household income (% change since 2000)
Household income diversity
Ratio of average income to average house value (%)
Ratio of average income to average rent
Median household income ($) - White
Median household income ($) - Black or African American
Median household income ($) - Asian
Median household income ($) - Hispanic or Latino
Median household income ($) - American Indian and Alaska Native
Median household income ($) - Multirace
Median household income ($) - Other Race
Median household income for houses/condos with a mortgage ($)
Median household income for apartments without a mortgage ($)
Races - White alone (%)
Races - White alone (% change since 2000)
Races - Black alone (%)
Races - Black alone (% change since 2000)
Races - American Indian alone (%)
Races - American Indian alone (% change since 2000)
Races - Asian alone (%)
Races - Asian alone (% change since 2000)
Races - Hispanic (%)
Races - Hispanic (% change since 2000)
Races - Native Hawaiian and Other Pacific Islander alone (%)
Races - Native Hawaiian and Other Pacific Islander alone (% change since 2000)
Races - Two or more races (%)
Races - Two or more races (% change since 2000)
Races - Other race alone (%)
Races - Other race alone (% change since 2000)
Racial diversity
Unemployment (%)
Unemployment (% change since 2000)
Unemployment (%) - White
Unemployment (%) - Black or African American
Unemployment (%) - Asian
Unemployment (%) - Hispanic or Latino
Unemployment (%) - American Indian and Alaska Native
Unemployment (%) - Multirace
Unemployment (%) - Other Race
Population density (people per square mile)
Population - Males (%)
Population - Females (%)
Population - Males (%) - White
Population - Males (%) - Black or African American
Population - Males (%) - Asian
Population - Males (%) - Hispanic or Latino
Population - Males (%) - American Indian and Alaska Native
Population - Males (%) - Multirace
Population - Males (%) - Other Race
Population - Females (%) - White
Population - Females (%) - Black or African American
Population - Females (%) - Asian
Population - Females (%) - Hispanic or Latino
Population - Females (%) - American Indian and Alaska Native
Population - Females (%) - Multirace
Population - Females (%) - Other Race
Coronavirus confirmed cases (Jun 08, 2024)
Deaths caused by coronavirus (Jun 08, 2024)
Coronavirus confirmed cases (per 100k population) (Jun 08, 2024)
Deaths caused by coronavirus (per 100k population) (Jun 08, 2024)
Daily increase in number of cases (Jun 08, 2024)
Weekly increase in number of cases (Jun 08, 2024)
Cases doubled (in days) (Jun 08, 2024)
Hospitalized patients (Apr 18, 2022)
Negative test results (Apr 18, 2022)
Total test results (Apr 18, 2022)
COVID Vaccine doses distributed (per 100k population) (Sep 19, 2023)
COVID Vaccine doses administered (per 100k population) (Sep 19, 2023)
COVID Vaccine doses distributed (Sep 19, 2023)
COVID Vaccine doses administered (Sep 19, 2023)
Likely homosexual households (%)
Likely homosexual households (% change since 2000)
Likely homosexual households - Lesbian couples (%)
Likely homosexual households - Lesbian couples (% change since 2000)
Likely homosexual households - Gay men (%)
Likely homosexual households - Gay men (% change since 2000)
Cost of living index
Median gross rent ($)
Median contract rent ($)
Median monthly housing costs ($)
Median house or condo value ($)
Median house or condo value ($ change since 2000)
Mean house or condo value by units in structure - 1, detached ($)
Mean house or condo value by units in structure - 1, attached ($)
Mean house or condo value by units in structure - 2 ($)
Mean house or condo value by units in structure by units in structure - 3 or 4 ($)
Mean house or condo value by units in structure - 5 or more ($)
Mean house or condo value by units in structure - Boat, RV, van, etc. ($)
Mean house or condo value by units in structure - Mobile home ($)
Median house or condo value ($) - White
Median house or condo value ($) - Black or African American
Median house or condo value ($) - Asian
Median house or condo value ($) - Hispanic or Latino
Median house or condo value ($) - American Indian and Alaska Native
Median house or condo value ($) - Multirace
Median house or condo value ($) - Other Race
Median resident age
Resident age diversity
Median resident age - Males
Median resident age - Females
Median resident age - White
Median resident age - Black or African American
Median resident age - Asian
Median resident age - Hispanic or Latino
Median resident age - American Indian and Alaska Native
Median resident age - Multirace
Median resident age - Other Race
Median resident age - Males - White
Median resident age - Males - Black or African American
Median resident age - Males - Asian
Median resident age - Males - Hispanic or Latino
Median resident age - Males - American Indian and Alaska Native
Median resident age - Males - Multirace
Median resident age - Males - Other Race
Median resident age - Females - White
Median resident age - Females - Black or African American
Median resident age - Females - Asian
Median resident age - Females - Hispanic or Latino
Median resident age - Females - American Indian and Alaska Native
Median resident age - Females - Multirace
Median resident age - Females - Other Race
Commute - mean travel time to work (minutes)
Travel time to work - Less than 5 minutes (%)
Travel time to work - Less than 5 minutes (% change since 2000)
Travel time to work - 5 to 9 minutes (%)
Travel time to work - 5 to 9 minutes (% change since 2000)
Travel time to work - 10 to 19 minutes (%)
Travel time to work - 10 to 19 minutes (% change since 2000)
Travel time to work - 20 to 29 minutes (%)
Travel time to work - 20 to 29 minutes (% change since 2000)
Travel time to work - 30 to 39 minutes (%)
Travel time to work - 30 to 39 minutes (% change since 2000)
Travel time to work - 40 to 59 minutes (%)
Travel time to work - 40 to 59 minutes (% change since 2000)
Travel time to work - 60 to 89 minutes (%)
Travel time to work - 60 to 89 minutes (% change since 2000)
Travel time to work - 90 or more minutes (%)
Travel time to work - 90 or more minutes (% change since 2000)
Marital status - Never married (%)
Marital status - Now married (%)
Marital status - Separated (%)
Marital status - Widowed (%)
Marital status - Divorced (%)
Median family income ($)
Median family income (% change since 2000)
Median non-family income ($)
Median non-family income (% change since 2000)
Median per capita income ($)
Median per capita income (% change since 2000)
Median family income ($) - White
Median family income ($) - Black or African American
Median family income ($) - Asian
Median family income ($) - Hispanic or Latino
Median family income ($) - American Indian and Alaska Native
Median family income ($) - Multirace
Median family income ($) - Other Race
Median year house/condo built
Median year apartment built
Year house built - Built 2005 or later (%)
Year house built - Built 2000 to 2004 (%)
Year house built - Built 1990 to 1999 (%)
Year house built - Built 1980 to 1989 (%)
Year house built - Built 1970 to 1979 (%)
Year house built - Built 1960 to 1969 (%)
Year house built - Built 1950 to 1959 (%)
Year house built - Built 1940 to 1949 (%)
Year house built - Built 1939 or earlier (%)
Average household size
Household density (households per square mile)
Average household size - White
Average household size - Black or African American
Average household size - Asian
Average household size - Hispanic or Latino
Average household size - American Indian and Alaska Native
Average household size - Multirace
Average household size - Other Race
Occupied housing units (%)
Vacant housing units (%)
Owner occupied housing units (%)
Renter occupied housing units (%)
Vacancy status - For rent (%)
Vacancy status - For sale only (%)
Vacancy status - Rented or sold, not occupied (%)
Vacancy status - For seasonal, recreational, or occasional use (%)
Vacancy status - For migrant workers (%)
Vacancy status - Other vacant (%)
Residents with income below the poverty level (%)
Residents with income below 50% of the poverty level (%)
Children below poverty level (%)
Poor families by family type - Married-couple family (%)
Poor families by family type - Male, no wife present (%)
Poor families by family type - Female, no husband present (%)
Poverty status for native-born residents (%)
Poverty status for foreign-born residents (%)
Poverty among high school graduates not in families (%)
Poverty among people who did not graduate high school not in families (%)
Residents with income below the poverty level (%) - White
Residents with income below the poverty level (%) - Black or African American
Residents with income below the poverty level (%) - Asian
Residents with income below the poverty level (%) - Hispanic or Latino
Residents with income below the poverty level (%) - American Indian and Alaska Native
Residents with income below the poverty level (%) - Multirace
Residents with income below the poverty level (%) - Other Race
Air pollution - Air Quality Index (AQI)
Air pollution - CO
Air pollution - NO2
Air pollution - SO2
Air pollution - Ozone
Air pollution - PM10
Air pollution - PM25
Air pollution - Pb
Crime - Murders per 100,000 population
Crime - Rapes per 100,000 population
Crime - Robberies per 100,000 population
Crime - Assaults per 100,000 population
Crime - Burglaries per 100,000 population
Crime - Thefts per 100,000 population
Crime - Auto thefts per 100,000 population
Crime - Arson per 100,000 population
Crime - City-data.com crime index
Crime - Violent crime index
Crime - Property crime index
Crime - Murders per 100,000 population (5 year average)
Crime - Rapes per 100,000 population (5 year average)
Crime - Robberies per 100,000 population (5 year average)
Crime - Assaults per 100,000 population (5 year average)
Crime - Burglaries per 100,000 population (5 year average)
Crime - Thefts per 100,000 population (5 year average)
Crime - Auto thefts per 100,000 population (5 year average)
Crime - Arson per 100,000 population (5 year average)
Crime - City-data.com crime index (5 year average)
Crime - Violent crime index (5 year average)
Crime - Property crime index (5 year average)
1996 Presidential Elections Results (%) - Democratic Party (Clinton)
1996 Presidential Elections Results (%) - Republican Party (Dole)
1996 Presidential Elections Results (%) - Other
2000 Presidential Elections Results (%) - Democratic Party (Gore)
2000 Presidential Elections Results (%) - Republican Party (Bush)
2000 Presidential Elections Results (%) - Other
2004 Presidential Elections Results (%) - Democratic Party (Kerry)
2004 Presidential Elections Results (%) - Republican Party (Bush)
2004 Presidential Elections Results (%) - Other
2008 Presidential Elections Results (%) - Democratic Party (Obama)
2008 Presidential Elections Results (%) - Republican Party (McCain)
2008 Presidential Elections Results (%) - Other
2012 Presidential Elections Results (%) - Democratic Party (Obama)
2012 Presidential Elections Results (%) - Republican Party (Romney)
2012 Presidential Elections Results (%) - Other
2016 Presidential Elections Results (%) - Democratic Party (Clinton)
2016 Presidential Elections Results (%) - Republican Party (Trump)
2016 Presidential Elections Results (%) - Other
2020 Presidential Elections Results (%) - Democratic Party (Biden)
2020 Presidential Elections Results (%) - Republican Party (Trump)
2020 Presidential Elections Results (%) - Other
Ancestries Reported - Arab (%)
Ancestries Reported - Czech (%)
Ancestries Reported - Danish (%)
Ancestries Reported - Dutch (%)
Ancestries Reported - English (%)
Ancestries Reported - French (%)
Ancestries Reported - French Canadian (%)
Ancestries Reported - German (%)
Ancestries Reported - Greek (%)
Ancestries Reported - Hungarian (%)
Ancestries Reported - Irish (%)
Ancestries Reported - Italian (%)
Ancestries Reported - Lithuanian (%)
Ancestries Reported - Norwegian (%)
Ancestries Reported - Polish (%)
Ancestries Reported - Portuguese (%)
Ancestries Reported - Russian (%)
Ancestries Reported - Scotch-Irish (%)
Ancestries Reported - Scottish (%)
Ancestries Reported - Slovak (%)
Ancestries Reported - Subsaharan African (%)
Ancestries Reported - Swedish (%)
Ancestries Reported - Swiss (%)
Ancestries Reported - Ukrainian (%)
Ancestries Reported - United States (%)
Ancestries Reported - Welsh (%)
Ancestries Reported - West Indian (%)
Ancestries Reported - Other (%)
Educational Attainment - No schooling completed (%)
Educational Attainment - Less than high school (%)
Educational Attainment - High school or equivalent (%)
Educational Attainment - Less than 1 year of college (%)
Educational Attainment - 1 or more years of college (%)
Educational Attainment - Associate degree (%)
Educational Attainment - Bachelor's degree (%)
Educational Attainment - Master's degree (%)
Educational Attainment - Professional school degree (%)
Educational Attainment - Doctorate degree (%)
School Enrollment - Nursery, preschool (%)
School Enrollment - Kindergarten (%)
School Enrollment - Grade 1 to 4 (%)
School Enrollment - Grade 5 to 8 (%)
School Enrollment - Grade 9 to 12 (%)
School Enrollment - College undergrad (%)
School Enrollment - Graduate or professional (%)
School Enrollment - Not enrolled in school (%)
School enrollment - Public schools (%)
School enrollment - Private schools (%)
School enrollment - Not enrolled (%)
Median number of rooms in houses and condos
Median number of rooms in apartments
Housing units lacking complete plumbing facilities (%)
Housing units lacking complete kitchen facilities (%)
Density of houses
Urban houses (%)
Rural houses (%)
Households with people 60 years and over (%)
Households with people 65 years and over (%)
Households with people 75 years and over (%)
Households with one or more nonrelatives (%)
Households with no nonrelatives (%)
Population in households (%)
Family households (%)
Nonfamily households (%)
Population in families (%)
Family households with own children (%)
Median number of bedrooms in owner occupied houses
Mean number of bedrooms in owner occupied houses
Median number of bedrooms in renter occupied houses
Mean number of bedrooms in renter occupied houses
Median number of vehichles in owner occupied houses
Mean number of vehichles in owner occupied houses
Median number of vehichles in renter occupied houses
Mean number of vehichles in renter occupied houses
Mortgage status - with mortgage (%)
Mortgage status - with second mortgage (%)
Mortgage status - with home equity loan (%)
Mortgage status - with both second mortgage and home equity loan (%)
Mortgage status - without a mortgage (%)
Average family size
Average family size - White
Average family size - Black or African American
Average family size - Asian
Average family size - Hispanic or Latino
Average family size - American Indian and Alaska Native
Average family size - Multirace
Average family size - Other Race
Geographical mobility - Same house 1 year ago (%)
Geographical mobility - Moved within same county (%)
Geographical mobility - Moved from different county within same state (%)
Geographical mobility - Moved from different state (%)
Geographical mobility - Moved from abroad (%)
Place of birth - Born in state of residence (%)
Place of birth - Born in other state (%)
Place of birth - Native, outside of US (%)
Place of birth - Foreign born (%)
Housing units in structures - 1, detached (%)
Housing units in structures - 1, attached (%)
Housing units in structures - 2 (%)
Housing units in structures - 3 or 4 (%)
Housing units in structures - 5 to 9 (%)
Housing units in structures - 10 to 19 (%)
Housing units in structures - 20 to 49 (%)
Housing units in structures - 50 or more (%)
Housing units in structures - Mobile home (%)
Housing units in structures - Boat, RV, van, etc. (%)
House/condo owner moved in on average (years ago)
Renter moved in on average (years ago)
Year householder moved into unit - Moved in 1999 to March 2000 (%)
Year householder moved into unit - Moved in 1995 to 1998 (%)
Year householder moved into unit - Moved in 1990 to 1994 (%)
Year householder moved into unit - Moved in 1980 to 1989 (%)
Year householder moved into unit - Moved in 1970 to 1979 (%)
Year householder moved into unit - Moved in 1969 or earlier (%)
Means of transportation to work - Drove car alone (%)
Means of transportation to work - Carpooled (%)
Means of transportation to work - Public transportation (%)
Means of transportation to work - Bus or trolley bus (%)
Means of transportation to work - Streetcar or trolley car (%)
Means of transportation to work - Subway or elevated (%)
Means of transportation to work - Railroad (%)
Means of transportation to work - Ferryboat (%)
Means of transportation to work - Taxicab (%)
Means of transportation to work - Motorcycle (%)
Means of transportation to work - Bicycle (%)
Means of transportation to work - Walked (%)
Means of transportation to work - Other means (%)
Working at home (%)
Industry diversity
Most Common Industries - Agriculture, forestry, fishing and hunting, and mining (%)
Most Common Industries - Agriculture, forestry, fishing and hunting (%)
Most Common Industries - Mining, quarrying, and oil and gas extraction (%)
Most Common Industries - Construction (%)
Most Common Industries - Manufacturing (%)
Most Common Industries - Wholesale trade (%)
Most Common Industries - Retail trade (%)
Most Common Industries - Transportation and warehousing, and utilities (%)
Most Common Industries - Transportation and warehousing (%)
Most Common Industries - Utilities (%)
Most Common Industries - Information (%)
Most Common Industries - Finance and insurance, and real estate and rental and leasing (%)
Most Common Industries - Finance and insurance (%)
Most Common Industries - Real estate and rental and leasing (%)
Most Common Industries - Professional, scientific, and management, and administrative and waste management services (%)
Most Common Industries - Professional, scientific, and technical services (%)
Most Common Industries - Management of companies and enterprises (%)
Most Common Industries - Administrative and support and waste management services (%)
Most Common Industries - Educational services, and health care and social assistance (%)
Most Common Industries - Educational services (%)
Most Common Industries - Health care and social assistance (%)
Most Common Industries - Arts, entertainment, and recreation, and accommodation and food services (%)
Most Common Industries - Arts, entertainment, and recreation (%)
Most Common Industries - Accommodation and food services (%)
Most Common Industries - Other services, except public administration (%)
Most Common Industries - Public administration (%)
Occupation diversity
Most Common Occupations - Management, business, science, and arts occupations (%)
Most Common Occupations - Management, business, and financial occupations (%)
Most Common Occupations - Management occupations (%)
Most Common Occupations - Business and financial operations occupations (%)
Most Common Occupations - Computer, engineering, and science occupations (%)
Most Common Occupations - Computer and mathematical occupations (%)
Most Common Occupations - Architecture and engineering occupations (%)
Most Common Occupations - Life, physical, and social science occupations (%)
Most Common Occupations - Education, legal, community service, arts, and media occupations (%)
Most Common Occupations - Community and social service occupations (%)
Most Common Occupations - Legal occupations (%)
Most Common Occupations - Education, training, and library occupations (%)
Most Common Occupations - Arts, design, entertainment, sports, and media occupations (%)
Most Common Occupations - Healthcare practitioners and technical occupations (%)
Most Common Occupations - Health diagnosing and treating practitioners and other technical occupations (%)
Most Common Occupations - Health technologists and technicians (%)
Most Common Occupations - Service occupations (%)
Most Common Occupations - Healthcare support occupations (%)
Most Common Occupations - Protective service occupations (%)
Most Common Occupations - Fire fighting and prevention, and other protective service workers including supervisors (%)
Most Common Occupations - Law enforcement workers including supervisors (%)
Most Common Occupations - Food preparation and serving related occupations (%)
Most Common Occupations - Building and grounds cleaning and maintenance occupations (%)
Most Common Occupations - Personal care and service occupations (%)
Most Common Occupations - Sales and office occupations (%)
Most Common Occupations - Sales and related occupations (%)
Most Common Occupations - Office and administrative support occupations (%)
Most Common Occupations - Natural resources, construction, and maintenance occupations (%)
Most Common Occupations - Farming, fishing, and forestry occupations (%)
Most Common Occupations - Construction and extraction occupations (%)
Most Common Occupations - Installation, maintenance, and repair occupations (%)
Most Common Occupations - Production, transportation, and material moving occupations (%)
Most Common Occupations - Production occupations (%)
Most Common Occupations - Transportation occupations (%)
Most Common Occupations - Material moving occupations (%)
People in Group quarters - Institutionalized population (%)
People in Group quarters - Correctional institutions (%)
People in Group quarters - Federal prisons and detention centers (%)
People in Group quarters - Halfway houses (%)
People in Group quarters - Local jails and other confinement facilities (including police lockups) (%)
People in Group quarters - Military disciplinary barracks (%)
People in Group quarters - State prisons (%)
People in Group quarters - Other types of correctional institutions (%)
People in Group quarters - Nursing homes (%)
People in Group quarters - Hospitals/wards, hospices, and schools for the handicapped (%)
People in Group quarters - Hospitals/wards and hospices for chronically ill (%)
People in Group quarters - Hospices or homes for chronically ill (%)
People in Group quarters - Military hospitals or wards for chronically ill (%)
People in Group quarters - Other hospitals or wards for chronically ill (%)
People in Group quarters - Hospitals or wards for drug/alcohol abuse (%)
People in Group quarters - Mental (Psychiatric) hospitals or wards (%)
People in Group quarters - Schools, hospitals, or wards for the mentally retarded (%)
People in Group quarters - Schools, hospitals, or wards for the physically handicapped (%)
People in Group quarters - Institutions for the deaf (%)
People in Group quarters - Institutions for the blind (%)
People in Group quarters - Orthopedic wards and institutions for the physically handicapped (%)
People in Group quarters - Wards in general hospitals for patients who have no usual home elsewhere (%)
People in Group quarters - Wards in military hospitals for patients who have no usual home elsewhere (%)
People in Group quarters - Juvenile institutions (%)
People in Group quarters - Long-term care (%)
People in Group quarters - Homes for abused, dependent, and neglected children (%)
People in Group quarters - Residential treatment centers for emotionally disturbed children (%)
People in Group quarters - Training schools for juvenile delinquents (%)
People in Group quarters - Short-term care, detention or diagnostic centers for delinquent children (%)
People in Group quarters - Type of juvenile institution unknown (%)
People in Group quarters - Noninstitutionalized population (%)
People in Group quarters - College dormitories (includes college quarters off campus) (%)
People in Group quarters - Military quarters (%)
People in Group quarters - On base (%)
People in Group quarters - Barracks, unaccompanied personnel housing (UPH), (Enlisted/Officer), ;and similar group living quarters for military personnel (%)
People in Group quarters - Transient quarters for temporary residents (%)
People in Group quarters - Military ships (%)
People in Group quarters - Group homes (%)
People in Group quarters - Homes or halfway houses for drug/alcohol abuse (%)
People in Group quarters - Homes for the mentally ill (%)
People in Group quarters - Homes for the mentally retarded (%)
People in Group quarters - Homes for the physically handicapped (%)
People in Group quarters - Other group homes (%)
People in Group quarters - Religious group quarters (%)
People in Group quarters - Dormitories (%)
People in Group quarters - Agriculture workers' dormitories on farms (%)
People in Group quarters - Job Corps and vocational training facilities (%)
People in Group quarters - Other workers' dormitories (%)
People in Group quarters - Crews of maritime vessels (%)
People in Group quarters - Other nonhousehold living situations (%)
People in Group quarters - Other noninstitutional group quarters (%)
Residents speaking English at home (%)
Residents speaking English at home - Born in the United States (%)
Residents speaking English at home - Native, born elsewhere (%)
Residents speaking English at home - Foreign born (%)
Residents speaking Spanish at home (%)
Residents speaking Spanish at home - Born in the United States (%)
Residents speaking Spanish at home - Native, born elsewhere (%)
Residents speaking Spanish at home - Foreign born (%)
Residents speaking other language at home (%)
Residents speaking other language at home - Born in the United States (%)
Residents speaking other language at home - Native, born elsewhere (%)
Residents speaking other language at home - Foreign born (%)
Class of Workers - Employee of private company (%)
Class of Workers - Self-employed in own incorporated business (%)
Class of Workers - Private not-for-profit wage and salary workers (%)
Class of Workers - Local government workers (%)
Class of Workers - State government workers (%)
Class of Workers - Federal government workers (%)
Class of Workers - Self-employed workers in own not incorporated business and Unpaid family workers (%)
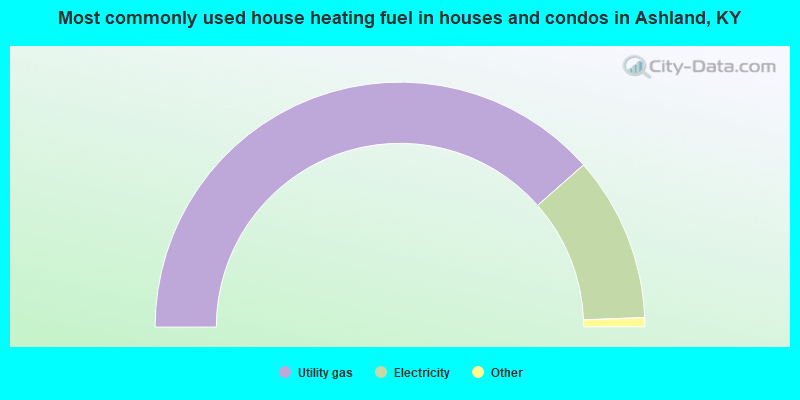
House heating fuel used in houses and condos - Utility gas (%)
House heating fuel used in houses and condos - Bottled, tank, or LP gas (%)
House heating fuel used in houses and condos - Electricity (%)
House heating fuel used in houses and condos - Fuel oil, kerosene, etc. (%)
House heating fuel used in houses and condos - Coal or coke (%)
House heating fuel used in houses and condos - Wood (%)
House heating fuel used in houses and condos - Solar energy (%)
House heating fuel used in houses and condos - Other fuel (%)
House heating fuel used in houses and condos - No fuel used (%)
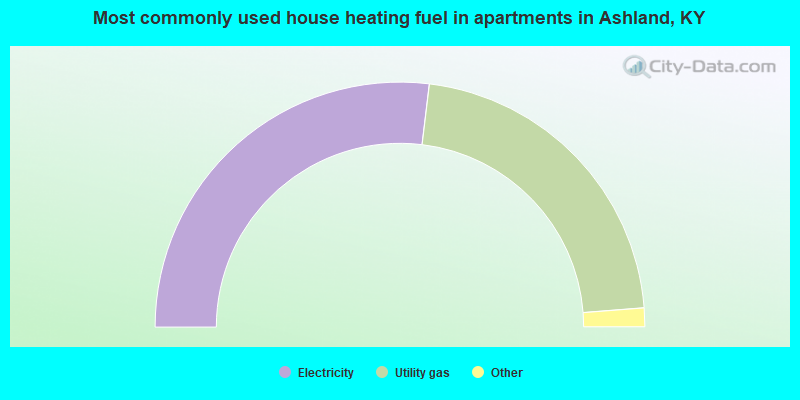
House heating fuel used in apartments - Utility gas (%)
House heating fuel used in apartments - Bottled, tank, or LP gas (%)
House heating fuel used in apartments - Electricity (%)
House heating fuel used in apartments - Fuel oil, kerosene, etc. (%)
House heating fuel used in apartments - Coal or coke (%)
House heating fuel used in apartments - Wood (%)
House heating fuel used in apartments - Solar energy (%)
House heating fuel used in apartments - Other fuel (%)
House heating fuel used in apartments - No fuel used (%)
Armed forces status - In Armed Forces (%)
Armed forces status - Civilian (%)
Armed forces status - Civilian - Veteran (%)
Armed forces status - Civilian - Nonveteran (%)
Fatal accidents locations in years 2005-2021
Fatal accidents locations in 2005
Fatal accidents locations in 2006
Fatal accidents locations in 2007
Fatal accidents locations in 2008
Fatal accidents locations in 2009
Fatal accidents locations in 2010
Fatal accidents locations in 2011
Fatal accidents locations in 2012
Fatal accidents locations in 2013
Fatal accidents locations in 2014
Fatal accidents locations in 2015
Fatal accidents locations in 2016
Fatal accidents locations in 2017
Fatal accidents locations in 2018
Fatal accidents locations in 2019
Fatal accidents locations in 2020
Fatal accidents locations in 2021
Alcohol use - People drinking some alcohol every month (%)
Alcohol use - People not drinking at all (%)
Alcohol use - Average days/month drinking alcohol
Alcohol use - Average drinks/week
Alcohol use - Average days/year people drink much
Audiometry - Average condition of hearing (%)
Audiometry - People that can hear a whisper from across a quiet room (%)
Audiometry - People that can hear normal voice from across a quiet room (%)
Audiometry - Ears ringing, roaring, buzzing (%)
Audiometry - Had a job exposure to loud noise (%)
Audiometry - Had off-work exposure to loud noise (%)
Blood Pressure & Cholesterol - Has high blood pressure (%)
Blood Pressure & Cholesterol - Checking blood pressure at home (%)
Blood Pressure & Cholesterol - Frequently checking blood cholesterol (%)
Blood Pressure & Cholesterol - Has high cholesterol level (%)
Consumer Behavior - Money monthly spent on food at supermarket/grocery store
Consumer Behavior - Money monthly spent on food at other stores
Consumer Behavior - Money monthly spent on eating out
Consumer Behavior - Money monthly spent on carryout/delivered foods
Consumer Behavior - Income spent on food at supermarket/grocery store (%)
Consumer Behavior - Income spent on food at other stores (%)
Consumer Behavior - Income spent on eating out (%)
Consumer Behavior - Income spent on carryout/delivered foods (%)
Current Health Status - General health condition (%)
Current Health Status - Blood donors (%)
Current Health Status - Has blood ever tested for HIV virus (%)
Current Health Status - Left-handed people (%)
Dermatology - People using sunscreen (%)
Diabetes - Diabetics (%)
Diabetes - Had a blood test for high blood sugar (%)
Diabetes - People taking insulin (%)
Diet Behavior & Nutrition - Diet health (%)
Diet Behavior & Nutrition - Milk product consumption (# of products/month)
Diet Behavior & Nutrition - Meals not home prepared (#/week)
Diet Behavior & Nutrition - Meals from fast food or pizza place (#/week)
Diet Behavior & Nutrition - Ready-to-eat foods (#/month)
Diet Behavior & Nutrition - Frozen meals/pizza (#/month)
Drug Use - People that ever used marijuana or hashish (%)
Drug Use - Ever used hard drugs (%)
Drug Use - Ever used any form of cocaine (%)
Drug Use - Ever used heroin (%)
Drug Use - Ever used methamphetamine (%)
Health Insurance - People covered by health insurance (%)
Kidney Conditions-Urology - Avg. # of times urinating at night
Medical Conditions - People with asthma (%)
Medical Conditions - People with anemia (%)
Medical Conditions - People with psoriasis (%)
Medical Conditions - People with overweight (%)
Medical Conditions - Elderly people having difficulties in thinking or remembering (%)
Medical Conditions - People who ever received blood transfusion (%)
Medical Conditions - People having trouble seeing even with glass/contacts (%)
Medical Conditions - People with arthritis (%)
Medical Conditions - People with gout (%)
Medical Conditions - People with congestive heart failure (%)
Medical Conditions - People with coronary heart disease (%)
Medical Conditions - People with angina pectoris (%)
Medical Conditions - People who ever had heart attack (%)
Medical Conditions - People who ever had stroke (%)
Medical Conditions - People with emphysema (%)
Medical Conditions - People with thyroid problem (%)
Medical Conditions - People with chronic bronchitis (%)
Medical Conditions - People with any liver condition (%)
Medical Conditions - People who ever had cancer or malignancy (%)
Mental Health - People who have little interest in doing things (%)
Mental Health - People feeling down, depressed, or hopeless (%)
Mental Health - People who have trouble sleeping or sleeping too much (%)
Mental Health - People feeling tired or having little energy (%)
Mental Health - People with poor appetite or overeating (%)
Mental Health - People feeling bad about themself (%)
Mental Health - People who have trouble concentrating on things (%)
Mental Health - People moving or speaking slowly or too fast (%)
Mental Health - People having thoughts they would be better off dead (%)
Oral Health - Average years since last visit a dentist
Oral Health - People embarrassed because of mouth (%)
Oral Health - People with gum disease (%)
Oral Health - General health of teeth and gums (%)
Oral Health - Average days a week using dental floss/device
Oral Health - Average days a week using mouthwash for dental problem
Oral Health - Average number of teeth
Pesticide Use - Households using pesticides to control insects (%)
Pesticide Use - Households using pesticides to kill weeds (%)
Physical Activity - People doing vigorous-intensity work activities (%)
Physical Activity - People doing moderate-intensity work activities (%)
Physical Activity - People walking or bicycling (%)
Physical Activity - People doing vigorous-intensity recreational activities (%)
Physical Activity - People doing moderate-intensity recreational activities (%)
Physical Activity - Average hours a day doing sedentary activities
Physical Activity - Average hours a day watching TV or videos
Physical Activity - Average hours a day using computer
Physical Functioning - People having limitations keeping them from working (%)
Physical Functioning - People limited in amount of work they can do (%)
Physical Functioning - People that need special equipment to walk (%)
Physical Functioning - People experiencing confusion/memory problems (%)
Physical Functioning - People requiring special healthcare equipment (%)
Prescription Medications - Average number of prescription medicines taking
Preventive Aspirin Use - Adults 40+ taking low-dose aspirin (%)
Reproductive Health - Vaginal deliveries (%)
Reproductive Health - Cesarean deliveries (%)
Reproductive Health - Deliveries resulted in a live birth (%)
Reproductive Health - Pregnancies resulted in a delivery (%)
Reproductive Health - Women breastfeeding newborns (%)
Reproductive Health - Women that had a hysterectomy (%)
Reproductive Health - Women that had both ovaries removed (%)
Reproductive Health - Women that have ever taken birth control pills (%)
Reproductive Health - Women taking birth control pills (%)
Reproductive Health - Women that have ever used Depo-Provera or injectables (%)
Reproductive Health - Women that have ever used female hormones (%)
Sexual Behavior - People 18+ that ever had sex (vaginal, anal, or oral) (%)
Sexual Behavior - Males 18+ that ever had vaginal sex with a woman (%)
Sexual Behavior - Males 18+ that ever performed oral sex on a woman (%)
Sexual Behavior - Males 18+ that ever had anal sex with a woman (%)
Sexual Behavior - Males 18+ that ever had any sex with a man (%)
Sexual Behavior - Females 18+ that ever had vaginal sex with a man (%)
Sexual Behavior - Females 18+ that ever performed oral sex on a man (%)
Sexual Behavior - Females 18+ that ever had anal sex with a man (%)
Sexual Behavior - Females 18+ that ever had any kind of sex with a woman (%)
Sexual Behavior - Average age people first had sex
Sexual Behavior - Average number of female sex partners in lifetime (males 18+)
Sexual Behavior - Average number of female vaginal sex partners in lifetime (males 18+)
Sexual Behavior - Average age people first performed oral sex on a woman (18+)
Sexual Behavior - Average number of woman performed oral sex on in lifetime (18+)
Sexual Behavior - Average number of male sex partners in lifetime (males 18+)
Sexual Behavior - Average number of male anal sex partners in lifetime (males 18+)
Sexual Behavior - Average age people first performed oral sex on a man (18+)
Sexual Behavior - Average number of male oral sex partners in lifetime (18+)
Sexual Behavior - People using protection when performing oral sex (%)
Sexual Behavior - Average number of times people have vaginal or anal sex a year
Sexual Behavior - People having sex without condom (%)
Sexual Behavior - Average number of male sex partners in lifetime (females 18+)
Sexual Behavior - Average number of male vaginal sex partners in lifetime (females 18+)
Sexual Behavior - Average number of female sex partners in lifetime (females 18+)
Sexual Behavior - Circumcised males 18+ (%)
Sleep Disorders - Average hours sleeping at night
Sleep Disorders - People that has trouble sleeping (%)
Smoking-Cigarette Use - People smoking cigarettes (%)
Taste & Smell - People 40+ having problems with smell (%)
Taste & Smell - People 40+ having problems with taste (%)
Taste & Smell - People 40+ that ever had wisdom teeth removed (%)
Taste & Smell - People 40+ that ever had tonsils teeth removed (%)
Taste & Smell - People 40+ that ever had a loss of consciousness because of a head injury (%)
Taste & Smell - People 40+ that ever had a broken nose or other serious injury to face or skull (%)
Taste & Smell - People 40+ that ever had two or more sinus infections (%)
Weight - Average height (inches)
Weight - Average weight (pounds)
Weight - Average BMI
Weight - People that are obese (%)
Weight - People that ever were obese (%)
Weight - People trying to lose weight (%)
Officers per 1,000 residents here:
2.31Kentucky average:
1.89
Latest news from Ashland, KY collected exclusively by city-data.com from local newspapers, TV, and radio stations
Ancestries: American (33.7%), English (17.5%), Irish (7.2%), German (7.1%), Scotch-Irish (6.3%), European (2.1%).
Current Local Time:
Incorporated on 02/23/1856
Land area: 11.1 square miles.
Population density: 1,927 people per square mile (low).
312 residents are foreign born
This city:
1.4%Kentucky:
4.1%
Median real estate property taxes paid for housing units with mortgages in 2022: $1,254 (0.8%)Median real estate property taxes paid for housing units with no mortgage in 2022: $1,017 (0.9%)
Nearest city with pop. 50,000+: Huntington, WV
Nearest city with pop. 200,000+: Fayette, KY
Nearest city with pop. 1,000,000+: Chicago, IL
Nearest cities:
Latitude: 38.46 N, Longitude: 82.64 W
Daytime population change due to commuting: +6,816 (+31.6%)Workers who live and work in this city: 4,873 (56.2%)
Ashland tourist attractions:
Single-family new house construction building permits:
2022: 1 building , cost: $125,0002020: 3 buildings , average cost: $173,0002019: 2 buildings , average cost: $173,0002018: 2 buildings , average cost: $173,0002017: 2 buildings , average cost: $173,0002014: 3 buildings , average cost: $82,9002013: 1 building , cost: $75,0002012: 2 buildings , average cost: $215,0002011: 5 buildings , average cost: $110,4002010: 13 buildings , average cost: $148,9002009: 9 buildings , average cost: $88,8002008: 15 buildings , average cost: $90,3002007: 11 buildings , average cost: $92,3002006: 4 buildings , average cost: $93,8002005: 4 buildings , average cost: $93,8002004: 19 buildings , average cost: $121,4002003: 15 buildings , average cost: $140,3002002: 9 buildings , average cost: $118,2002001: 11 buildings , average cost: $119,0002000: 18 buildings , average cost: $102,3001999: 12 buildings , average cost: $124,5001998: 7 buildings , average cost: $80,2001997: 24 buildings , average cost: $98,000Unemployment in December 2023:
Most common occupations in Ashland, KY (%)
Both Males Females
Other sales and related occupations, including supervisors (4.7%)
Other office and administrative support workers, including supervisors (4.1%)
Building and grounds cleaning and maintenance occupations (3.8%)
Other management occupations, except farmers and farm managers (3.6%)
Retail sales workers, except cashiers (3.3%)
Registered nurses (3.2%)
Preschool, kindergarten, elementary, and middle school teachers (3.2%)
Electrical equipment mechanics and other installation, maintenance, and repair workers, including supervisors (5.3%)
Driver/sales workers and truck drivers (4.6%)
Other management occupations, except farmers and farm managers (4.4%)
Other sales and related occupations, including supervisors (4.2%)
Building and grounds cleaning and maintenance occupations (3.9%)
Other production occupations, including supervisors (3.8%)
Material recording, scheduling, dispatching, and distributing workers (3.5%)
Registered nurses (6.7%)
Cashiers (5.8%)
Secretaries and administrative assistants (5.8%)
Other office and administrative support workers, including supervisors (5.7%)
Other sales and related occupations, including supervisors (5.2%)
Preschool, kindergarten, elementary, and middle school teachers (5.0%)
Retail sales workers, except cashiers (4.6%)
Tornado activity:
Ashland-area historical tornado activity is significantly below Kentucky state average. It is 51% smaller than the overall U.S. average.
On 4/23/1968, a category F5 (max. wind speeds 261-318 mph) tornado 18.4 miles away from the Ashland city center killed 7 people and injured 93 people and caused between $500,000 and $5,000,000 in damages.
On 4/8/1965, a category F3 (max. wind speeds 158-206 mph) tornado 6.5 miles away from the city center injured 3 people and caused between $50,000 and $500,000 in damages.
Earthquake activity:
Ashland-area historical earthquake activity is significantly above Kentucky state average. It is 12% greater than the overall U.S. average. On 7/27/1980 at 18:52:21, a magnitude 5.2 (5.1 MB, 4.7 MS, 5.0 UK, 5.2 UK, Class: Moderate, Intensity: VI - VII) earthquake occurred 72.8 miles away from the city center On 8/23/2011 at 17:51:04, a magnitude 5.8 (5.8 MW, Depth: 3.7 mi) earthquake occurred 258.6 miles away from Ashland center On 8/9/2020 at 12:07:37, a magnitude 5.1 (5.1 MW, Depth: 4.7 mi) earthquake occurred 161.7 miles away from the city center On 9/7/1988 at 02:28:09, a magnitude 4.6 (4.5 MB, 4.6 LG, Class: Light, Intensity: IV - V) earthquake occurred 70.7 miles away from the city center On 9/25/1998 at 19:52:52, a magnitude 5.2 (4.8 MB, 4.3 MS, 5.2 LG, 4.5 MW, Depth: 3.1 mi) earthquake occurred 240.8 miles away from Ashland center On 4/18/2008 at 09:36:59, a magnitude 5.4 (5.1 MB, 4.8 MS, 5.4 MW, 5.2 MW) earthquake occurred 284.0 miles away from the city center Magnitude types: regional Lg-wave magnitude (LG), body-wave magnitude (MB), surface-wave magnitude (MS), moment magnitude (MW) Natural disasters: The number of natural disasters in Boyd County (24) is greater than the US average (15).Major Disasters (Presidential) Declared: 18Emergencies Declared: 3Floods: 17, Storms: 15, Mudslides: 7, Tornadoes: 7, Winter Storms: 6, Landslides: 5, Snowstorms: 2, Blizzard: 1, Hurricane: 1, Snowfall: 1, Wind: 1, Other: 1 (Note: some incidents may be assigned to more than one category). Main business address for: KENTUCKY POWER CO ELECTRIC & OTHER SERVICES COMBINED ).
Hospitals in Ashland: COMMUNITY HOSPICE (1538CENTRAL AVENUE) KING'S DAUGHTERS' MEDICAL CENTER (Voluntary non-profit - Private, provides emergency services, 2201 LEXINGTON AVENUE) OUR LADY OF BELLEFONTE HOSPITAL (Voluntary non-profit - Private, 1000 SAINT CHRISTOPHER DRIVE) Nursing Homes in Ashland: BOYD NURSING AND REHABILITATION CENTER (12800 PRINCELAND DRIVE) KINGSBROOK LIFECARE CENTER (2500 STATE ROUTE 5) SUNRISE NURSG AND REHABILITATION CTR INC (5400 APPLE BLOSSOM LANE) WOODLAND OAKS (1820 OAKVIEW ROAD) Dialysis Facilities in Ashland: FMC - ASHLAND (432 16TH STREET, SUITE A) FMC - CENTRAL ASHLAND (424 RIVER HILL DRIVE) Home Health Centers in Ashland: AMEDISYS HOME HEALTH (1212 BATH AVENUE) KING'S DAUGHTERS' MED. CTR. HHA (1701 CENTRAL AVENUE, SUITE 500) Heliports located in Ashland: Amtrak station: ASHLAND (99 15TH ST.)
.
Services: fully wheelchair accessible, enclosed waiting area, public restrooms, public payphones, vending machines, free short-term parking, free long-term parking, call for taxi service, public transit connection.
College/University in Ashland: Ashland Community and Technical College Full-time enrollment: 2,482; Location: 1400 College Drive; Public; Website: www.ashland.kctcs.edu/)
Other colleges/universities with over 2000 students near Ashland:
Marshall University (about 12 miles; Huntington, WV ; Full-time enrollment: 11,450)
Shawnee State University (about 27 miles; Portsmouth, OH ; FT enrollment: 4,160)
Morehead State University (about 47 miles; Morehead, KY ; FT enrollment: 7,523)
West Virginia State University (about 48 miles; Institute, WV ; FT enrollment: 2,133)
Big Sandy Community and Technical College (about 55 miles; Prestonsburg, KY ; FT enrollment: 2,660)
Maysville Community and Technical College (about 64 miles; Maysville, KY ; FT enrollment: 2,969)
Ohio University-Main Campus (about 67 miles; Athens, OH ; FT enrollment: 26,181)
Public high schools in Ashland: BOYD COUNTY HIGH SCHOOL Students: 976, Location: 14375 LIONS LANE, Grades: 9-12)PAUL G. BLAZER HIGH SCHOOL Students: 966, Location: 1500 BLAZER BLVD, Grades: 9-12)FAIRVIEW HIGH SCHOOL Students: 480, Location: 2123 MAIN ST W, Grades: 6-12)BOYD COUNTY CENTRAL Location: 12307 MIDLAND TRAIL RD., Grades: 6-11)
ASHLAND DAY TREATMENT Location: 1539 GREENUP AVE, Grades: 8-12)
BOYD REGIONAL JUVENILE DETENTION CENTER Location: 2420 ROBERTS DR, Grades: 6-12)
Private high school in Ashland: ROSE HILL CHRISTIAN SCHOOL Students: 187, Location: 1001 WINSLOW RD, Grades: PK-12)
Biggest public elementary/middle schools in Ashland: BOYD COUNTY MIDDLE SCHOOL Students: 727, Location: 1226 SUMMIT ROAD, Grades: 6-8)SUMMIT ELEMENTARY SCHOOL Students: 487, Location: 830 STATE RT 716, Grades: KG-5)OAKVIEW ELEMENTARY SCHOOL Students: 432, Location: 3111 BLACKBURN AVE, Grades: KG-6)HAGER ELEMENTARY SCHOOL Students: 330, Location: 1600 BLACKBURN AVE, Grades: KG-6)CHARLES RUSSELL ELEMENTARY SCHOOL Students: 297, Location: 1100 RUSSELL ST, Grades: KG-6)CANNONSBURG ELEMENTARY SCHOOL Students: 293, Location: 12219 MIDLAND TRAIL RD, Grades: KG-5)FAIRVIEW ELEMENTARY SCHOOL Students: 292, Location: 258 MCKNIGHT ST WW, Grades: PK-5)CRABBE ELEMENTARY SCHOOL Students: 255, Location: 520 17TH ST, Grades: KG-6)POAGE ELEMENTARY SCHOOL Students: 182, Location: 3215 S 29TH ST, Grades: KG-6)ASHLAND MIDDLE SCHOOL Location: 2800 KANSAS ST, Grades: 7-8)
Private elementary/middle school in Ashland: HOLY FAMILY SCHOOL Students: 146, Location: 932 WINCHESTER AVE, Grades: PK-8)
See full list of schools located in Ashland Library in Ashland: BOYD COUNTY PUBLIC LIBRARY Operating income: $3,102,580; Location: 1740 CENTRAL AVENUE; 118,587 books ; 4,317 e-books ; 5,916 audio materials ; 8,033 video materials ; 1 local licensed databases ; 71 state licensed databases ; 1 other licensed databases ; 298 print serial subscriptions ; 9,763 electronic serial subscriptions )
Notable locations in Ashland: (A) , Boyd County Emergency Ambulance Service (B) , Ashland Fire Department Station 3 (C) , Ashland Fire Department Station 2 (D) , Ashland Fire Department (E) . Display/hide their locations on the map
Main business address in Ashland: (A) . Display/hide its location on the map
Churches in Ashland include: (A) , Rose Hill Church (B) . Display/hide their locations on the map
Cemeteries: (1) , William Cemetery (2) , Rose Hill Burial Park (3) . Display/hide their locations on the map
Reservoir: (A) . Display/hide its location on the map
Streams, rivers, and creeks: (A) , Keys Creek (B) , Hurricane Fork (C) , Hood Creek (D) . Display/hide their locations on the map
Park in Ashland: (1) . Display/hide its location on the map
Tourist attractions:
Hotels:
Courts:
Birthplace of: Jillian Hall - Professional wrestler, Allison Anders - Director, Alberta Vaughn - Actress, Brandon Webb - 2005 Major League Baseball player (Arizona Diamondbacks, born : May 9, 1979), Megan Neyer - College diver, Paul Fannin - Politician, Terrence Mann - Baritone, Trace Cyrus - Musician, Bob Gallion - Country singer, Noah Adams - Essayist.
Boyd County has a predicted average indoor radon screening level between 2 and 4 pCi/L (pico curies per liter) - Moderate Potential Drinking water stations with addresses in Ashland and their reported violations in the past:
ASHLAND WATER WORKS (Population served: 44,402, Surface water):
Past health violations:
MCL, Average - Between OCT-2011 and DEC-2011, Contaminant: TTHM. Follow-up actions: St Public Notif requested (JAN-30-2012), St Formal NOV issued (JAN-30-2012), St Public Notif received (MAR-02-2012), St Compliance achieved (MAY-14-2012), St AO (w/penalty) issued (JUL-03-2012)
MCL, Average - Between JUL-2011 and SEP-2011, Contaminant: TTHM. Follow-up actions: St Public Notif requested (NOV-03-2011), St Formal NOV issued (NOV-03-2011), St Public Notif received (DEC-20-2011), St Compliance achieved (MAY-14-2012), St AO (w/penalty) issued (JUL-03-2012)
MCL, Average - Between APR-2011 and JUN-2011, Contaminant: TTHM. Follow-up actions: St Public Notif requested (AUG-09-2011), St Formal NOV issued (AUG-09-2011), St Public Notif received (SEP-15-2011), St Compliance achieved (MAY-14-2012), St AO (w/penalty) issued (JUL-03-2012)
Past monitoring violations:
Monitoring of Treatment (SWTR-Filter) - In JUL-2012. Follow-up actions: St Public Notif requested (SEP-30-2012), St Formal NOV issued (SEP-30-2012), St Compliance achieved (OCT-23-2012), St Public Notif received (APR-24-2014)
Follow-up Or Routine LCR Tap M/R - In OCT-01-2004, Contaminant: Lead and Copper Rule. Follow-up actions: St Public Notif requested (MAR-31-2005), St Formal NOV issued (MAR-31-2005), St Public Notif received (MAR-31-2005), St Compliance achieved (DEC-14-2005)
One minor monitoring violation
2 regular monitoring violations
Population served: 9,911, Purch surface water):
Past health violations:
MCL, Monthly (TCR) - In JUL-2006, Contaminant: Coliform. Follow-up actions: St Public Notif requested (NOV-28-2006), St Formal NOV issued (NOV-28-2006), St Public Notif received (JAN-03-2007), St Compliance achieved (FEB-15-2007)
Past monitoring violations:
Monitoring of Treatment (SWTR-Filter) - In MAY-2008. Follow-up actions: St Public Notif requested (JUL-27-2008), St Formal NOV issued (JUL-27-2008), St Public Notif received (JUN-26-2009), St Compliance achieved (OCT-29-2009)
Average household size: This city:
2.3 peopleKentucky:
2.5 people
Percentage of family households: This city:
61.2%Whole state:
66.9%
Percentage of households with unmarried partners: This city:
6.3%Whole state:
6.4%
Likely homosexual households (counted as self-reported same-sex unmarried-partner households)
Lesbian couples: 0.4% of all households Gay men: 0.3% of all households
People in group quarters in Ashland in 2010:
149 people in nursing facilities/skilled-nursing facilities
47 people in other noninstitutional facilities
24 people in correctional facilities intended for juveniles
23 people in emergency and transitional shelters (with sleeping facilities) for people experiencing homelessness
22 people in group homes intended for adults
21 people in residential treatment centers for adults
3 people in in-patient hospice facilities
People in group quarters in Ashland in 2000:
143 people in nursing homes
115 people in other noninstitutional group quarters
43 people in halfway houses
35 people in other nonhousehold living situations
21 people in hospitals or wards for drug/alcohol abuse
10 people in other group homes
6 people in unknown juvenile institutions
4 people in homes or halfway houses for drug/alcohol abuse
Banks with most branches in Ashland (2011 data):
PNC Bank, National Association: Carter Avenue Branch, Russell Road Branch, Midtown @ Krogers, Summit Branch, Kings Daughter Branch, Blackburn Avenue Branch. Info updated 2012/03/20: Bank assets: $263,309.6 mil, Deposits: $197,343.0 mil, headquarters in Wilmington, DE, positive income , Commercial Lending Specialization, 3085 total offices , Holding Company: Pnc Financial Services Group, Inc., The
Community Trust Bank, Inc.: Ashland Branch, Ashland South Branch, Ashland Summit Branch, Ashland Westwood Branch. Info updated 2011/03/25: Bank assets: $3,573.0 mil, Deposits: $2,890.4 mil, headquarters in Pikeville, KY, positive income , Commercial Lending Specialization, 80 total offices , Holding Company: Community Trust Bancorp, Inc.
City National Bank of West Virginia: Ashland Branch, Cedar Knoll Branch, Ashland Wal-Mart Branch. Info updated 2008/01/10: Bank assets: $2,753.2 mil, Deposits: $2,223.1 mil, headquarters in Charleston, WV, positive income , Commercial Lending Specialization, 68 total offices , Holding Company: City Holding Company
Town Square Bank, Inc.: at 9431 U.S. Route 60, Messenger Service At Ashland, Midtown Branch. Info updated 2006/11/03: Bank assets: $177.2 mil, Deposits: $143.3 mil, local headquarters , positive income , Commercial Lending Specialization, 5 total offices , Holding Company: Town Square Financial Corporation
Peoples Bank, National Association: Ashland Branch at 1999 Winchester Avenue, branch established on 1977/03/28; Summitt Branch at 6601 U.S. Route 60, branch established on 1992/10/01. Info updated 2006/11/29: Bank assets: $1,788.7 mil, Deposits: $1,356.7 mil, headquarters in Marietta, OH, positive income , Commercial Lending Specialization, 45 total offices , Holding Company: Peoples Bancorp Inc.
RBS Citizens, National Association: Ashland Ky Lpo Branch at 332 15th Street, branch established on 2002/07/01. Info updated 2007/09/19: Bank assets: $106,940.6 mil, Deposits: $75,690.2 mil, headquarters in Providence, RI, positive income , 1135 total offices , Holding Company: Uk Financial Investments Limited
Home Federal Savings and Loan Association: Home Federal Savings And Loan Associ at 1500 Carter Ave, branch established on 1889/01/01. Info updated 2011/09/28: Bank assets: $319.3 mil, Deposits: $249.5 mil, local headquarters , positive income , Mortgage Lending Specialization, 6 total offices
Fifth Third Bank: Ashland/Winchester Branch at 1422 Winchester Avenue, branch established on 1966/05/23. Info updated 2009/10/05: Bank assets: $114,540.4 mil, Deposits: $89,689.1 mil, headquarters in Cincinnati, OH, positive income , Commercial Lending Specialization, 1378 total offices , Holding Company: Fifth Third Bancorp
Kentucky Farmers Bank Corporation: Ashland Office Branch at 835 Carter Avenue, branch established on 2004/09/20. Info updated 2010/09/10: Bank assets: $170.4 mil, Deposits: $131.1 mil, headquarters in Catlettsburg, KY, positive income , 3 total offices
For population 15 years and over in Ashland:
Never married: 27.2%Now married: 45.3%Separated: 2.9%Widowed: 7.1%Divorced: 17.4% For population 25 years and over in Ashland:
High school or higher: 89.7%Bachelor's degree or higher: 25.2%Graduate or professional degree: 13.3%Unemployed: 8.7%Mean travel time to work (commute): 19.1 minutes
Education Gini index (Inequality in education) Here:
10.5Kentucky average:
11.7
Religion statistics for Ashland, KY (based on Boyd County data)
Religion Adherents Congregations Evangelical Protestant 21,279 85 Mainline Protestant 5,660 20 Catholic 1,950 1 Black Protestant 120 2 Other 3 1 None 20,530 -
Source: Clifford Grammich, Kirk Hadaway, Richard Houseal, Dale E.Jones, Alexei Krindatch, Richie Stanley and Richard H.Taylor. 2012. 2010 U.S.Religion Census: Religious Congregations & Membership Study. Association of Statisticians of American Religious Bodies. Jones, Dale E., et al. 2002. Congregations and Membership in the United States 2000. Nashville, TN: Glenmary Research Center. Graphs represent county-level data
Food Environment Statistics: Number of grocery stores : 11Boyd County :
2.27 / 10,000 pop.Kentucky :
2.19 / 10,000 pop.
Number of supercenters and club stores : 1This county :
0.21 / 10,000 pop.State :
0.25 / 10,000 pop.
Number of convenience stores (no gas) : 1Boyd County :
0.21 / 10,000 pop.Kentucky :
0.74 / 10,000 pop.
Number of convenience stores (with gas) : 30Boyd County :
6.19 / 10,000 pop.State :
4.36 / 10,000 pop.
Number of full-service restaurants : 33Here :
6.81 / 10,000 pop.State :
5.74 / 10,000 pop.
Adult diabetes rate : This county :
12.7%Kentucky :
11.0%
Adult obesity rate : Boyd County :
32.2%Kentucky :
30.0%
Low-income preschool obesity rate : This county :
15.4%State :
15.9%
Health and Nutrition: Healthy diet rate : Ashland:
58.8%Kentucky:
49.9%
Average overall health of teeth and gums : This city:
60.0%Kentucky:
47.0%
People feeling badly about themselves : This city:
17.4%State:
21.0%
People not drinking alcohol at all : Ashland:
6.9%Kentucky:
10.1%
Average hours sleeping at night : This city:
7.0Kentucky:
6.8
Overweight people : This city:
34.4%Kentucky:
33.8%
General health condition : Average condition of hearing : Ashland:
80.9%Kentucky:
78.9%
More about Health and Nutrition of Ashland, KY Residents
Local government employment and payroll (March 2022)
Function
Full-time employees
Monthly full-time payroll
Average yearly full-time wage
Part-time employees
Monthly part-time payroll
Firefighters
48 $306,858 $76,715 0 $0 Police Protection - Officers
43 $256,133 $71,479 0 $0 Water Supply
39 $163,277 $50,239 0 $0 Sewerage
27 $103,471 $45,987 0 $0 Streets and Highways
22 $73,508 $40,095 0 $0 Solid Waste Management
18 $53,958 $35,972 3 $4,052 Other and Unallocable
18 $69,429 $46,286 0 $0 Financial Administration
17 $91,100 $64,306 2 $2,994 Other Government Administration
15 $80,983 $64,786 5 $2,359 Parks and Recreation
10 $38,359 $46,031 0 $0 Police - Other
7 $39,585 $67,860 0 $0 Transit
5 $20,183 $48,439 9 $22,448 Fire - Other
5 $15,918 $38,203 0 $0 Welfare
4 $15,124 $45,372 3 $3,347 Judicial and Legal
3 $26,257 $105,028 0 $0 Natural Resources
2 $5,937 $35,622 0 $0 Health
1 $3,897 $46,764 0 $0
Totals for Government
284 $1,363,975 $57,633 22 $35,200
Ashland government finances - Expenditure in 2021 (per resident):
Construction - Housing and Community Development: $940,000 ($44.04)
Regular Highways: $221,000 ($10.36)Central Staff Services: $81,000 ($3.80)Water Utilities: $3,000 ($0.14)Current Operations - Water Utilities: $11,131,000 ($521.55)
Local Fire Protection: $3,933,000 ($184.28)Financial Administration: $3,727,000 ($174.63)Police Protection: $3,327,000 ($155.89)Housing and Community Development: $3,286,000 ($153.97)Sewerage: $2,512,000 ($117.70)Regular Highways: $2,163,000 ($101.35)Central Staff Services: $1,695,000 ($79.42)Transit Utilities: $1,019,000 ($47.75)Solid Waste Management: $955,000 ($44.75)Parks and Recreation: $811,000 ($38.00)Protective Inspection and Regulation - Other: $354,000 ($16.59)Miscellaneous Commercial Activities - Other: $183,000 ($8.57)Sea and Inland Port Facilities: $142,000 ($6.65)General - Other: $107,000 ($5.01)Natural Resources - Other: $46,000 ($2.16)Public Welfare - Other: $2,000 ($0.09)Other Capital Outlay - Local Fire Protection: $522,000 ($24.46)
Regular Highways: $451,000 ($21.13)Central Staff Services: $54,000 ($2.53)Police Protection: $10,000 ($0.47)Sea and Inland Port Facilities: $5,000 ($0.23)Total Salaries and Wages: $14,987,000 ($702.23)
Ashland government finances - Revenue in 2021 (per resident):
Charges - Sewerage: $7,889,000 ($369.65)
Solid Waste Management: $2,289,000 ($107.25)Parks and Recreation: $206,000 ($9.65)Other: $94,000 ($4.40)Parking Facilities: $11,000 ($0.52)Federal Intergovernmental - Housing and Community Development: $4,444,000 ($208.23)
Transit Utilities: $1,172,000 ($54.92)Other: $491,000 ($23.01)Highways: $263,000 ($12.32)Local Intergovernmental - Other: $188,000 ($8.81)
General Local Government Support: $76,000 ($3.56)Miscellaneous - Special Assessments: $165,000 ($7.73)
Donations From Private Sources: $71,000 ($3.33)Interest Earnings: $62,000 ($2.91)General Revenue - Other: $54,000 ($2.53)Rents: $46,000 ($2.16)Fines and Forfeits: $45,000 ($2.11)Sale of Property: $19,000 ($0.89)Revenue - Water Utilities: $9,801,000 ($459.24)
Transit Utilities: $34,000 ($1.59)State Intergovernmental - Other: $1,072,000 ($50.23)
Highways: $428,000 ($20.05)Transit Utilities: $17,000 ($0.80)Tax - Individual Income: $11,140,000 ($521.98)
Property: $6,560,000 ($307.38)Insurance Premiums Sales: $4,258,000 ($199.51)Corporation Net Income: $2,028,000 ($95.02)Public Utilities Sales: $1,295,000 ($60.68)Alcoholic Beverage License: $724,000 ($33.92)Other License: $68,000 ($3.19)
Ashland government finances - Debt in 2021 (per resident):
Long Term Debt - Beginning Outstanding - Public Debt for Private Purpose: $126,995,000 ($5950.47)
Outstanding Nonguaranteed - Industrial Revenue: $126,995,000 ($5950.47)Beginning Outstanding - Unspecified Public Purpose: $12,414,000 ($581.67)Outstanding Unspecified Public Purpose: $8,471,000 ($396.92)Retired Unspecified Public Purpose: $3,982,000 ($186.58)Issue, Unspecified Public Purpose: $39,000 ($1.83)Short Term Debt Outstanding - End of Fiscal Year: $7,000 ($0.33)
Beginning: $3,000 ($0.14)
Ashland government finances - Cash and Securities in 2021 (per resident):
Bond Funds - Cash and Securities: $8,347,000 ($391.11)
Other Funds - Cash and Securities: $24,637,000 ($1154.39)
Sinking Funds - Cash and Securities: $126,995,000 ($5950.47)
Businesses in Ashland, KY
Name Count Name Count
ALDI 1 Lane Furniture 2 AT&T 2 Little Caesars Pizza 1 Advance Auto Parts 2 Long John Silver's 1 Aeropostale 1 Lowe's 1 American Eagle Outfitters 1 Marriott 1 Applebee's 1 MasterBrand Cabinets 3 Arby's 3 Maurices 1 AutoZone 1 Mazda 1 Baskin-Robbins 1 McDonald's 5 Bath & Body Works 1 Nike 2 Best Western 1 Nissan 1 Blockbuster 1 OfficeMax 1 Burger King 2 Outback 1 CVS 1 Outback Steakhouse 1 Carson Pirie Scott 1 Pac Sun 1 Chevrolet 1 Panera Bread 1 Chick-Fil-A 1 Papa John's Pizza 1 Cold Stone Creamery 1 Payless 2 Curves 1 Penske 1 Dairy Queen 1 Pizza Hut 1 Days Inn 1 Quality 1 Fashion Bug 1 RadioShack 2 FedEx 8 Rite Aid 2 Finish Line 1 Ruby Tuesday 1 Firestone Complete Auto Care 1 Rue21 1 Ford 1 Sears 2 GNC 1 Sephora 1 GameStop 2 Spencer Gifts 1 Goodwill 2 Sprint Nextel 1 H&R Block 2 Starbucks 1 Hilton 1 Subway 6 Hobby Lobby 1 T.J.Maxx 1 Holiday Inn 1 Taco Bell 3 Honda 1 Tim Hortons 2 Hyundai 1 Toyota 1 IHOP 1 Toys"R"Us 1 JCPenney 1 True Value 1 Jones New York 2 U-Haul 3 Journeys 1 UPS 10 Justice 1 Vans 2 KFC 3 Verizon Wireless 2 Kincaid 1 Victoria's Secret 1 Knights Inn 1 Waffle House 1 Kroger 2 Walmart 2 La-Z-Boy 3 Wendy's 3 Lane Bryant 1 YMCA 1
Strongest AM radio stations in Ashland:
WTCR (1420 AM; 5 kW; KENOVA, WV; Owner: CAPSTAR TX LIMITED PARTNERSHIP)
WCMI (1340 AM; 1 kW; ASHLAND, KY; Owner: FIFTH AVENUE BROADCASTING CO., INC)
WOKT (1040 AM; daytime; 2 kW; CANNONSBURG, KY; Owner: BIG RIVER RADIO, INC.-KY)
WRVC (930 AM; 5 kW; HUNTINGTON, WV; Owner: FIFTH AVENUE BROADCASTING COMPANY, INC.)
WVHU (800 AM; 5 kW; HUNTINGTON, WV; Owner: CAPSTAR TX LIMITED PARTNERSHIP)
WHRD (1470 AM; 5 kW; HUNTINGTON, WV; Owner: CONCORD MEDIA GROUP, INC.)
WIRO (1230 AM; 1 kW; IRONTON, OH; Owner: CAPSTAR TX LIMITED PARTNERSHIP)
WLGC (1520 AM; daytime; 5 kW; GREENUP, KY; Owner: GREENUP COUNTY BROADCASTING, INC.)
WTVN (610 AM; 50 kW; COLUMBUS, OH; Owner: CITICASTERS LICENSES, L.P.)
WGOH (1370 AM; 5 kW; GRAYSON, KY; Owner: CARTER COUNTY BROADCASTING CO., INC.)
WBGS (1030 AM; daytime; 10 kW; POINT PLEASANT, WV; Owner: BIG RIVER RADIO, INC.)
WLW (700 AM; 50 kW; CINCINNATI, OH; Owner: JACOR BROADCASTING CORPORATION)
WNXT (1260 AM; 5 kW; PORTSMOUTH, OH; Owner: HOMETOWN B/C OF PORTSMOUTH, INC.)
Strongest FM radio stations in Ashland:
WBVB (97.1 FM; COAL GROVE, OH; Owner: CAPSTAR TX LIMITED PARTNERSHIP)
WRVC-FM (92.7 FM; CATLETTSBURG, KY; Owner: FIFTH AVENUE BROADCASTING CO., INC)
W216AT (91.1 FM; ASHLAND, KY; Owner: AMERICAN FAMILY ASSOCIATION)
WBKS (107.1 FM; IRONTON, OH; Owner: CAPSTAR TX LIMITED PARTNERSHIP)
WDGG (93.7 FM; ASHLAND, KY; Owner: FIFTH AVENUE B/CASTING COMPANY, INC.)
WOUL-FM (89.1 FM; IRONTON, OH; Owner: OHIO UNIVERSITY)
WKEE-FM (100.5 FM; HUNTINGTON, WV; Owner: CAPSTAR TX LIMITED PARTNERSHIP)
WRYV-FM1 (101.5 FM; HUNTINGTON, WV; Owner: LEGEND COMMUNICATIONS OF OHIO, LLC)
WPAY-FM (104.1 FM; PORTSMOUTH, OH; Owner: RADIO STATIONS WPAY/WPFB, INC.)
WVWV (89.9 FM; HUNTINGTON, WV; Owner: WEST VIRGINIA EDUCATIONAL BROADCASTING AUTHORITY)
WAMX (106.3 FM; MILTON, WV; Owner: CAPSTAR TX LIMITED PARTNERSHIP)
WTCR-FM (103.3 FM; HUNTINGTON, WV; Owner: CAPSTAR TX LIMITED PARTNERSHIP)
WLGC-FM (105.7 FM; GREENUP, KY; Owner: GREENUP COUNTY BROADCASTING, INC.)
WOSP (91.5 FM; PORTSMOUTH, OH; Owner: THE OHIO STATE UNIVERSITY)
WKLC-FM (105.1 FM; ST. ALBANS, WV; Owner: WKLC, INC.)
WMEJ (91.9 FM; PROCTORVILLE, OH; Owner: MARANATHA BROADCASTING INC.)
WEMM (107.9 FM; HUNTINGTON, WV; Owner: MORTENSON BROADCASTING CO. OF WEST VIRGINIA, LLC)
WOHP (88.3 FM; PORTSMOUTH, OH; Owner: THE CEDARVILLE UNIVERSITY)
WZAQ (92.3 FM; LOUISA, KY; Owner: LOUISA COMMUNICATIONS, INC.)
WNXT-FM (99.3 FM; PORTSMOUTH, OH; Owner: HOMETOWN B/C OF PORTSMOUTH, INC.)
TV broadcast stations around Ashland:
WKAS (Channel 25; ASHLAND, KY; Owner: KENTUCKY AUTHORITY FOR EDUCATIONAL TV)
W49BN (Channel 49; HUNTINGTON, WV; Owner: PAXSON COMMUNCATIONS LPTV, INC.)
WPBY-TV (Channel 33; HUNTINGTON, WV; Owner: WEST VIRGINIA EDUCATIONAL BROADCASTING AUTHORITY)
WSAZ-TV (Channel 3; HUNTINGTON, WV; Owner: EMMIS TELEVISION LICENSE CORPORATION)
W05CB (Channel 5; BURLINGTON, OH; Owner: VEARL R. PENNINGTON)
WOWK-TV (Channel 13; HUNTINGTON, WV; Owner: WEST VIRGINIA MEDIA HOLDINGS, LLC)
W14CU (Channel 14; HUNTINGTON, WV; Owner: VENTANA TELEVISION, INC.)
WVAH-TV (Channel 11; CHARLESTON, WV; Owner: WVAH LICENSEE, LLC)
WTSF (Channel 61; ASHLAND, KY; Owner: TRI STATE FAMILY BROADCASTING, INC.)
WCHS-TV (Channel 8; CHARLESTON, WV; Owner: WCHS LICENSEE, LLC)
WPBO (Channel 42; PORTSMOUTH, OH; Owner: THE OHIO STATE UNIVERSITY)
WHCP (Channel 30; PORTSMOUTH, OH; Owner: TELEVISION PROPERTIES, INC.)
W55AT (Channel 55; HUNTINGTON, WV; Owner: CHANNEL AMERICA LPTV LIC. SUBSIDIARY)
W36CR (Channel 36; HUNTINGTON, WV; Owner: NATIONAL MINORITY T.V., INC.)
W66CZ (Channel 66; PORTSMOUTH, OH; Owner: TRINITY BROADCASTING NETWORK)
National Bridge Inventory (NBI) Statistics 19 Number of bridges679ft / 207m Total length $18,313,000 Total costs95,151 Total average daily traffic6,608 Total average daily truck traffic
New bridges - historical statistics
3 1930-1939 2 1960-1969 3 1980-1989 6 1990-1999 3 2000-2009 2 2010-2019
See full National Bridge Inventory statistics for Ashland, KY
Home Mortgage Disclosure Act Aggregated Statistics For Year 2009(Based on 4 full and 3 partial tracts) A) FHA, FSA/RHS & VA B) Conventional C) Refinancings D) Home Improvement Loans E) Loans on Dwellings For 5+ Families F) Non-occupant Loans on G) Loans On Manufactured Number Average Value Number Average Value Number Average Value Number Average Value Number Average Value Number Average Value Number Average Value
LOANS ORIGINATED 64 $87,943 137 $89,685 362 $111,849 45 $37,900 3 $795,223 71 $76,768 2 $62,625 APPLICATIONS APPROVED, NOT ACCEPTED 9 $82,992 13 $77,453 54 $122,177 9 $39,428 0 $0 4 $41,252 1 $48,230 APPLICATIONS DENIED 9 $74,120 24 $55,952 151 $92,797 38 $29,604 0 $0 11 $61,422 1 $36,170 APPLICATIONS WITHDRAWN 9 $74,316 19 $75,312 101 $115,894 4 $31,802 0 $0 7 $57,890 0 $0 FILES CLOSED FOR INCOMPLETENESS 3 $92,320 0 $0 12 $132,694 0 $0 0 $0 1 $139,000 0 $0
Aggregated Statistics For Year 2008(Based on 4 full and 3 partial tracts) A) FHA, FSA/RHS & VA B) Conventional C) Refinancings D) Home Improvement Loans E) Loans on Dwellings For 5+ Families F) Non-occupant Loans on G) Loans On Manufactured Number Average Value Number Average Value Number Average Value Number Average Value Number Average Value Number Average Value Number Average Value
LOANS ORIGINATED 78 $97,781 185 $94,711 310 $99,557 53 $38,319 1 $169,790 94 $62,325 2 $44,360 APPLICATIONS APPROVED, NOT ACCEPTED 18 $82,533 18 $105,043 32 $101,266 10 $63,825 0 $0 7 $74,281 4 $52,750 APPLICATIONS DENIED 31 $86,704 38 $76,456 190 $77,840 40 $39,951 0 $0 18 $57,962 7 $61,031 APPLICATIONS WITHDRAWN 8 $103,339 24 $106,655 55 $94,019 5 $62,954 0 $0 7 $72,531 0 $0 FILES CLOSED FOR INCOMPLETENESS 0 $0 4 $52,055 19 $90,187 1 $132,000 0 $0 1 $37,000 0 $0
Aggregated Statistics For Year 2007(Based on 4 full and 3 partial tracts) A) FHA, FSA/RHS & VA B) Conventional C) Refinancings D) Home Improvement Loans E) Loans on Dwellings For 5+ Families F) Non-occupant Loans on G) Loans On Manufactured Number Average Value Number Average Value Number Average Value Number Average Value Number Average Value Number Average Value Number Average Value
LOANS ORIGINATED 67 $73,008 256 $85,470 293 $85,431 83 $39,162 3 $502,977 93 $62,310 2 $54,490 APPLICATIONS APPROVED, NOT ACCEPTED 2 $63,280 19 $92,976 58 $81,612 15 $33,383 0 $0 8 $33,142 2 $50,390 APPLICATIONS DENIED 18 $82,189 60 $74,959 240 $81,241 51 $37,896 0 $0 25 $45,246 7 $30,524 APPLICATIONS WITHDRAWN 7 $59,997 23 $81,400 68 $95,537 8 $65,402 0 $0 5 $96,900 1 $15,500 FILES CLOSED FOR INCOMPLETENESS 1 $104,950 19 $63,851 36 $93,694 1 $50,000 0 $0 5 $47,594 0 $0
Aggregated Statistics For Year 2006(Based on 4 full and 3 partial tracts) A) FHA, FSA/RHS & VA B) Conventional C) Refinancings D) Home Improvement Loans E) Loans on Dwellings For 5+ Families F) Non-occupant Loans on G) Loans On Manufactured Number Average Value Number Average Value Number Average Value Number Average Value Number Average Value Number Average Value Number Average Value
LOANS ORIGINATED 57 $86,953 265 $80,830 268 $79,968 95 $32,261 1 $349,830 97 $63,683 5 $30,396 APPLICATIONS APPROVED, NOT ACCEPTED 8 $77,689 34 $78,878 60 $72,401 25 $59,194 0 $0 19 $55,556 5 $42,848 APPLICATIONS DENIED 9 $65,661 82 $64,349 254 $75,901 76 $31,513 1 $391,850 40 $51,464 23 $47,227 APPLICATIONS WITHDRAWN 6 $54,683 26 $75,353 76 $90,442 9 $31,466 0 $0 5 $104,600 0 $0 FILES CLOSED FOR INCOMPLETENESS 1 $100,000 14 $74,955 33 $149,774 3 $76,493 0 $0 1 $34,980 0 $0
Aggregated Statistics For Year 2005(Based on 4 full and 3 partial tracts) A) FHA, FSA/RHS & VA B) Conventional C) Refinancings D) Home Improvement Loans E) Loans on Dwellings For 5+ Families F) Non-occupant Loans on G) Loans On Manufactured Number Average Value Number Average Value Number Average Value Number Average Value Number Average Value Number Average Value Number Average Value
LOANS ORIGINATED 36 $83,180 358 $75,383 321 $79,701 80 $35,344 2 $449,500 98 $49,428 3 $24,710 APPLICATIONS APPROVED, NOT ACCEPTED 9 $78,147 43 $59,137 54 $77,983 10 $40,095 0 $0 10 $69,979 6 $47,872 APPLICATIONS DENIED 16 $73,382 96 $65,680 281 $79,621 75 $30,907 0 $0 26 $49,781 25 $52,548 APPLICATIONS WITHDRAWN 10 $84,167 32 $76,502 90 $94,932 18 $135,585 0 $0 9 $57,821 0 $0 FILES CLOSED FOR INCOMPLETENESS 0 $0 22 $81,486 19 $129,891 2 $33,705 0 $0 3 $87,283 0 $0
Aggregated Statistics For Year 2004(Based on 4 full and 3 partial tracts) A) FHA, FSA/RHS & VA B) Conventional C) Refinancings D) Home Improvement Loans E) Loans on Dwellings For 5+ Families F) Non-occupant Loans on G) Loans On Manufactured Number Average Value Number Average Value Number Average Value Number Average Value Number Average Value Number Average Value Number Average Value
LOANS ORIGINATED 29 $77,602 310 $78,925 406 $82,750 58 $39,199 4 $585,438 126 $51,072 2 $33,240 APPLICATIONS APPROVED, NOT ACCEPTED 5 $62,128 50 $69,328 71 $73,375 5 $39,018 0 $0 12 $45,282 12 $51,162 APPLICATIONS DENIED 11 $83,663 89 $75,598 208 $68,220 55 $38,433 0 $0 22 $47,080 21 $41,277 APPLICATIONS WITHDRAWN 1 $44,000 26 $131,368 148 $93,540 9 $77,667 0 $0 9 $123,834 0 $0 FILES CLOSED FOR INCOMPLETENESS 1 $84,000 21 $70,671 24 $83,221 2 $51,490 0 $0 5 $68,400 0 $0
Aggregated Statistics For Year 2003(Based on 4 full and 3 partial tracts) A) FHA, FSA/RHS & VA B) Conventional C) Refinancings D) Home Improvement Loans E) Loans on Dwellings For 5+ Families F) Non-occupant Loans on Number Average Value Number Average Value Number Average Value Number Average Value Number Average Value Number Average Value
LOANS ORIGINATED 39 $84,608 300 $77,875 635 $83,865 70 $17,744 3 $131,080 117 $54,478 APPLICATIONS APPROVED, NOT ACCEPTED 7 $74,127 20 $78,976 83 $69,811 6 $23,283 0 $0 6 $40,138 APPLICATIONS DENIED 9 $56,881 100 $47,170 257 $66,640 33 $27,301 1 $650,000 14 $37,901 APPLICATIONS WITHDRAWN 1 $62,000 26 $92,902 123 $84,725 6 $19,698 0 $0 7 $54,591 FILES CLOSED FOR INCOMPLETENESS 3 $76,323 9 $127,663 40 $83,323 1 $17,410 0 $0 5 $65,578
Aggregated Statistics For Year 2002(Based on 4 full and 3 partial tracts) A) FHA, FSA/RHS & VA B) Conventional C) Refinancings D) Home Improvement Loans E) Loans on Dwellings For 5+ Families F) Non-occupant Loans on Number Average Value Number Average Value Number Average Value Number Average Value Number Average Value Number Average Value
LOANS ORIGINATED 49 $68,004 288 $73,335 517 $79,853 72 $21,740 3 $143,377 96 $49,083 APPLICATIONS APPROVED, NOT ACCEPTED 7 $58,383 46 $46,932 68 $66,100 7 $11,170 0 $0 2 $138,190 APPLICATIONS DENIED 15 $50,035 129 $52,450 211 $60,389 53 $8,463 0 $0 10 $63,488 APPLICATIONS WITHDRAWN 2 $62,490 36 $60,258 147 $72,537 10 $19,175 0 $0 12 $79,048 FILES CLOSED FOR INCOMPLETENESS 1 $52,000 1 $256,860 17 $69,259 0 $0 0 $0 0 $0
Aggregated Statistics For Year 2001(Based on 4 full and 3 partial tracts) A) FHA, FSA/RHS & VA B) Conventional C) Refinancings D) Home Improvement Loans E) Loans on Dwellings For 5+ Families F) Non-occupant Loans on Number Average Value Number Average Value Number Average Value Number Average Value Number Average Value Number Average Value
LOANS ORIGINATED 28 $66,625 286 $67,036 538 $74,722 75 $22,218 2 $307,265 108 $51,112 APPLICATIONS APPROVED, NOT ACCEPTED 3 $48,327 28 $50,746 81 $55,552 11 $27,994 0 $0 8 $34,528 APPLICATIONS DENIED 5 $55,732 93 $49,508 202 $57,487 52 $13,012 1 $300,000 11 $29,050 APPLICATIONS WITHDRAWN 3 $64,483 36 $57,229 116 $58,148 16 $15,262 0 $0 5 $31,652 FILES CLOSED FOR INCOMPLETENESS 0 $0 3 $30,650 15 $73,466 3 $29,330 0 $0 0 $0
Aggregated Statistics For Year 2000(Based on 4 full and 3 partial tracts) A) FHA, FSA/RHS & VA B) Conventional C) Refinancings D) Home Improvement Loans E) Loans on Dwellings For 5+ Families F) Non-occupant Loans on Number Average Value Number Average Value Number Average Value Number Average Value Number Average Value Number Average Value
LOANS ORIGINATED 27 $64,916 296 $64,650 227 $60,293 78 $21,699 1 $180,000 85 $50,080 APPLICATIONS APPROVED, NOT ACCEPTED 8 $35,746 27 $41,871 53 $53,522 18 $18,589 1 $80,000 5 $59,594 APPLICATIONS DENIED 13 $45,079 118 $38,987 145 $45,328 39 $14,546 0 $0 17 $39,668 APPLICATIONS WITHDRAWN 5 $72,066 26 $52,667 114 $43,671 9 $26,898 0 $0 8 $47,666 FILES CLOSED FOR INCOMPLETENESS 0 $0 2 $62,330 20 $54,458 0 $0 0 $0 0 $0
Aggregated Statistics For Year 1999(Based on 5 full and 3 partial tracts) A) FHA, FSA/RHS & VA B) Conventional C) Refinancings D) Home Improvement Loans E) Loans on Dwellings For 5+ Families F) Non-occupant Loans on Number Average Value Number Average Value Number Average Value Number Average Value Number Average Value Number Average Value
LOANS ORIGINATED 23 $61,086 261 $64,878 348 $62,728 102 $12,342 1 $67,610 87 $45,320 APPLICATIONS APPROVED, NOT ACCEPTED 4 $47,910 32 $48,756 56 $51,934 16 $20,042 0 $0 5 $53,404 APPLICATIONS DENIED 4 $52,912 117 $38,578 150 $49,809 38 $19,532 0 $0 20 $69,744 APPLICATIONS WITHDRAWN 4 $57,482 36 $49,471 131 $48,666 9 $34,848 0 $0 9 $41,284 FILES CLOSED FOR INCOMPLETENESS 0 $0 3 $63,537 16 $71,703 2 $19,125 0 $0 0 $0
Detailed HMDA statistics for the following Tracts:
0302.00
, 0303.00 , 0304.00 , 0305.00 , 0306.00 , 0307.00 , 0308.00
Private Mortgage Insurance Companies Aggregated Statistics For Year 2009(Based on 3 full and 2 partial tracts) A) Conventional B) Refinancings Number Average Value Number Average Value
LOANS ORIGINATED 11 $116,722 6 $159,732 APPLICATIONS APPROVED, NOT ACCEPTED 3 $72,963 2 $270,460 APPLICATIONS DENIED 1 $146,930 1 $113,940 APPLICATIONS WITHDRAWN 0 $0 0 $0 FILES CLOSED FOR INCOMPLETENESS 0 $0 0 $0
Aggregated Statistics For Year 2008(Based on 4 full and 3 partial tracts) A) Conventional B) Refinancings C) Non-occupant Loans on Number Average Value Number Average Value Number Average Value
LOANS ORIGINATED 27 $98,042 10 $128,104 1 $31,000 APPLICATIONS APPROVED, NOT ACCEPTED 9 $75,838 2 $89,500 0 $0 APPLICATIONS DENIED 1 $333,000 1 $150,000 0 $0 APPLICATIONS WITHDRAWN 5 $99,966 0 $0 0 $0 FILES CLOSED FOR INCOMPLETENESS 3 $94,557 0 $0 3 $94,557
Aggregated Statistics For Year 2007(Based on 4 full and 3 partial tracts) A) Conventional B) Refinancings C) Non-occupant Loans on Number Average Value Number Average Value Number Average Value
LOANS ORIGINATED 79 $81,943 24 $100,455 10 $37,900 APPLICATIONS APPROVED, NOT ACCEPTED 28 $76,486 3 $70,000 2 $35,545 APPLICATIONS DENIED 2 $94,605 0 $0 0 $0 APPLICATIONS WITHDRAWN 8 $68,500 2 $68,475 0 $0 FILES CLOSED FOR INCOMPLETENESS 1 $52,000 0 $0 0 $0
Aggregated Statistics For Year 2006(Based on 4 full and 3 partial tracts) A) Conventional B) Refinancings C) Non-occupant Loans on Number Average Value Number Average Value Number Average Value
LOANS ORIGINATED 66 $69,350 17 $84,484 18 $43,726 APPLICATIONS APPROVED, NOT ACCEPTED 16 $77,824 8 $98,092 5 $47,190 APPLICATIONS DENIED 1 $75,750 0 $0 0 $0 APPLICATIONS WITHDRAWN 5 $76,236 1 $162,080 0 $0 FILES CLOSED FOR INCOMPLETENESS 1 $90,000 0 $0 0 $0
Aggregated Statistics For Year 2005(Based on 4 full and 3 partial tracts) A) Conventional B) Refinancings C) Non-occupant Loans on Number Average Value Number Average Value Number Average Value
LOANS ORIGINATED 70 $76,687 16 $77,306 8 $35,985 APPLICATIONS APPROVED, NOT ACCEPTED 32 $75,984 4 $81,242 3 $62,637 APPLICATIONS DENIED 1 $36,000 1 $48,000 2 $42,000 APPLICATIONS WITHDRAWN 6 $69,182 1 $152,920 0 $0 FILES CLOSED FOR INCOMPLETENESS 3 $71,000 1 $67,850 0 $0
Aggregated Statistics For Year 2004(Based on 4 full and 2 partial tracts) A) Conventional B) Refinancings C) Non-occupant Loans on D) Loans On Manufactured Number Average Value Number Average Value Number Average Value Number Average Value
LOANS ORIGINATED 64 $78,927 16 $85,901 15 $43,749 1 $50,970 APPLICATIONS APPROVED, NOT ACCEPTED 15 $101,061 10 $85,172 5 $57,850 0 $0 APPLICATIONS DENIED 1 $29,000 0 $0 1 $29,000 0 $0 APPLICATIONS WITHDRAWN 3 $72,667 1 $84,960 0 $0 0 $0 FILES CLOSED FOR INCOMPLETENESS 1 $25,000 0 $0 0 $0 0 $0
Aggregated Statistics For Year 2003(Based on 4 full and 3 partial tracts) A) Conventional B) Refinancings C) Non-occupant Loans on Number Average Value Number Average Value Number Average Value
LOANS ORIGINATED 44 $76,988 34 $82,058 2 $23,490 APPLICATIONS APPROVED, NOT ACCEPTED 8 $67,392 10 $121,602 1 $60,080 APPLICATIONS DENIED 3 $78,657 1 $69,000 2 $66,485 APPLICATIONS WITHDRAWN 0 $0 3 $108,007 1 $86,000 FILES CLOSED FOR INCOMPLETENESS 0 $0 0 $0 0 $0
Aggregated Statistics For Year 2002(Based on 4 full and 3 partial tracts) A) Conventional B) Refinancings C) Non-occupant Loans on Number Average Value Number Average Value Number Average Value
LOANS ORIGINATED 46 $83,664 32 $92,911 3 $46,573 APPLICATIONS APPROVED, NOT ACCEPTED 3 $114,017 9 $67,983 0 $0 APPLICATIONS DENIED 1 $37,980 0 $0 1 $37,980 APPLICATIONS WITHDRAWN 0 $0 4 $93,000 1 $101,000 FILES CLOSED FOR INCOMPLETENESS 0 $0 0 $0 0 $0
Aggregated Statistics For Year 2001(Based on 4 full and 3 partial tracts) A) Conventional B) Refinancings Number Average Value Number Average Value
LOANS ORIGINATED 38 $72,527 28 $88,395 APPLICATIONS APPROVED, NOT ACCEPTED 4 $72,210 7 $99,894 APPLICATIONS DENIED 0 $0 2 $145,470 APPLICATIONS WITHDRAWN 1 $30,000 3 $74,630 FILES CLOSED FOR INCOMPLETENESS 0 $0 0 $0
Aggregated Statistics For Year 2000(Based on 4 full and 2 partial tracts) A) Conventional B) Refinancings C) Non-occupant Loans on Number Average Value Number Average Value Number Average Value
LOANS ORIGINATED 44 $65,051 4 $68,732 2 $69,495 APPLICATIONS APPROVED, NOT ACCEPTED 3 $67,990 0 $0 0 $0 APPLICATIONS DENIED 1 $49,630 0 $0 0 $0 APPLICATIONS WITHDRAWN 0 $0 0 $0 0 $0 FILES CLOSED FOR INCOMPLETENESS 0 $0 0 $0 0 $0
Aggregated Statistics For Year 1999(Based on 4 full and 2 partial tracts) A) Conventional B) Refinancings C) Non-occupant Loans on Number Average Value Number Average Value Number Average Value
LOANS ORIGINATED 48 $64,976 11 $73,646 2 $81,695 APPLICATIONS APPROVED, NOT ACCEPTED 2 $52,085 1 $59,000 0 $0 APPLICATIONS DENIED 1 $78,000 0 $0 0 $0 APPLICATIONS WITHDRAWN 0 $0 0 $0 0 $0 FILES CLOSED FOR INCOMPLETENESS 1 $37,000 0 $0 1 $37,000
Detailed PMIC statistics for the following Tracts:
0302.00
, 0303.00 , 0304.00 , 0305.00 , 0306.00 , 0307.00 , 0308.00 Fire-safe hotels and motels in Ashland, Kentucky:
Four Seasons Motel, 2317 Winchester Ave, Ashland, Kentucky 41101 Phone: (606) 324-0330
Days Inn, 12700 State Rt 180, Ashland, Kentucky 41102 Phone: (606) 928-3600, Fax: (606) 928-6515
Knights Inn, 7216 Rt 60, Ashland, Kentucky 41101 Phone: (606) 928-9501
Quality Inn, 4708 Winchester Ave, Ashland, Kentucky 41230 Phone: (606) 325-8989, Fax: (606) 325-8989
Holiday Inn Express Hotel & Suites, 13131 Slone Ct, Ashland, Kentucky 41102 Phone: (606) 929-1720, Fax: (606) 929-1737
Fairfield Inn By Marriott, 10945 Rt 60, Ashland, Kentucky 41102 Phone: (606) 928-1222, Fax: (606) 928-1222
Best Western River Cities, 31 Russell Plaza Dr, Ashland, Kentucky 41101 Phone: (606) 326-0357, Fax: (606) 327-5493
All 7 fire-safe hotels and motels in Ashland, Kentucky
Most common first names in Ashland, KY among deceased individuals Name Count Lived (average)
James 456 71.5 years William 440 72.5 years John 376 73.3 years Charles 372 70.7 years Mary 357 77.8 years Robert 205 69.6 years George 186 74.0 years Anna 124 78.9 years Betty 115 70.7 years Ruth 111 79.4 years
Most common last names in Ashland, KY among deceased individuals Last name Count Lived (average)
Johnson 162 74.4 years Smith 147 76.7 years Williams 140 73.8 years Moore 132 71.6 years Brown 119 71.4 years Hall 104 71.0 years Thompson 102 74.8 years Miller 97 76.6 years Conley 96 72.1 years Adkins 95 73.6 years
Ashland compared to Kentucky state average:
Black race population percentage significantly below state average. Foreign-born population percentage significantly below state average. Length of stay since moving in significantly above state average. House age above state average.
#70 on the list of "Top 101 cities with the largest percentage of people in halfway houses (population 1,000+)"
#72 on the list of "Top 101 cities with largest percentage of males in industries: health care and social assistance (population 5,000+)"
#94 (41101) on the list of "Top 101 zip codes with the most offices of physicians in 2005"
#22 on the list of "Top 101 counties with the highest Nitrogen Dioxide air pollution readings in 2012 (ppm)"
#84 on the list of "Top 101 counties with the highest Sulfur Oxides Annual air pollution readings in 2012 (µg/m3 )"
Top Patent Applicants
Jose Armando Salazar (6)
John M. Downey (5)
Trevor Wardle (4)
Gene Redecker (3)
Robert G. Harte (2)
Jason R. Vititoe (2)
Franklin Eugene Neal (2)
Mark Hannah (1)
Victor Lee Kersey (1)
John Wright (1)
Total of 36 patent applications in 2008-2024.


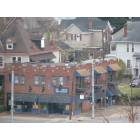
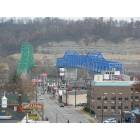
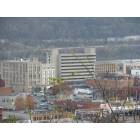
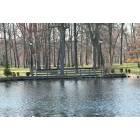
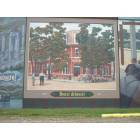
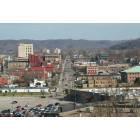
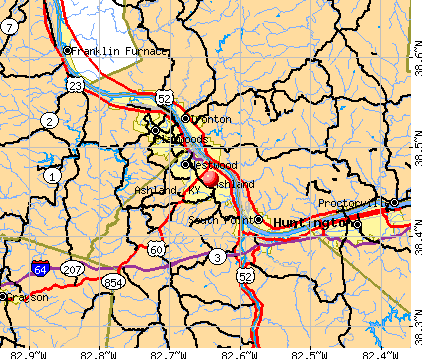


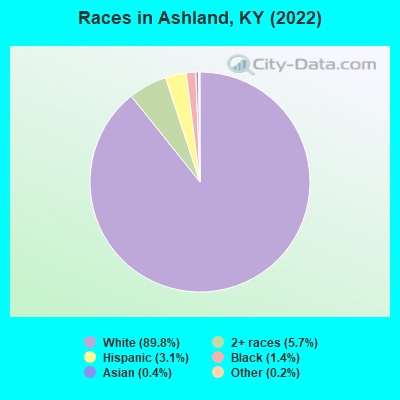
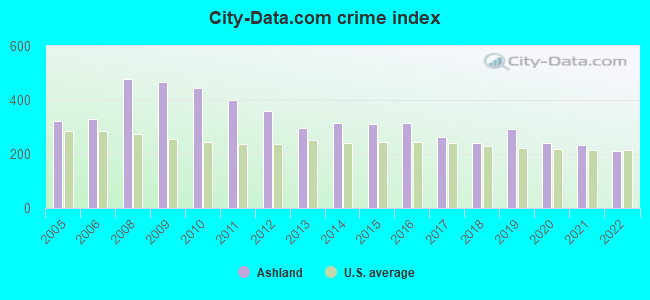
 Recent articles from our blog. Our writers, many of them Ph.D. graduates or candidates, create easy-to-read articles on a wide variety of topics.

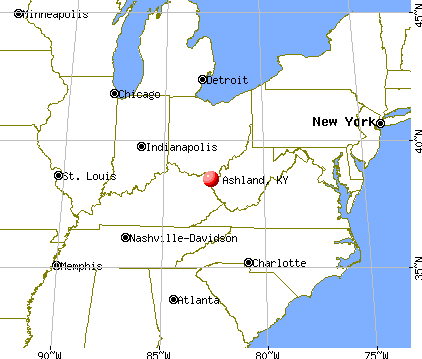
 (11.8 miles
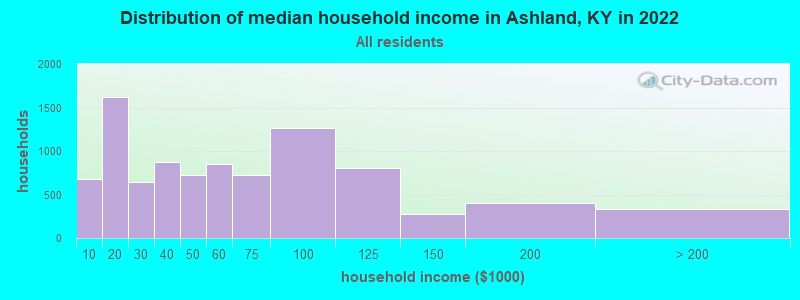
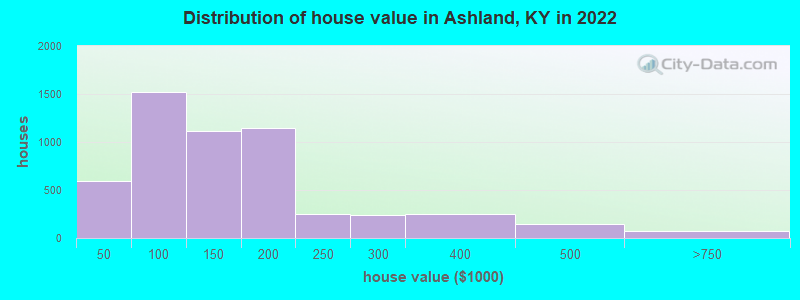

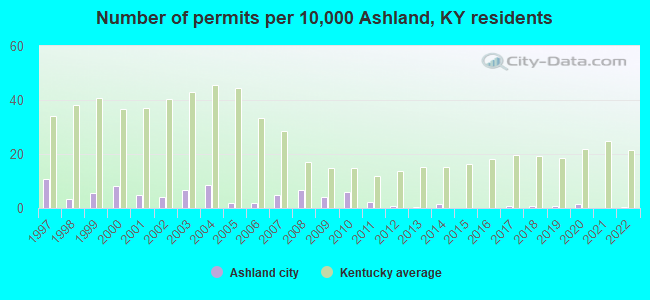
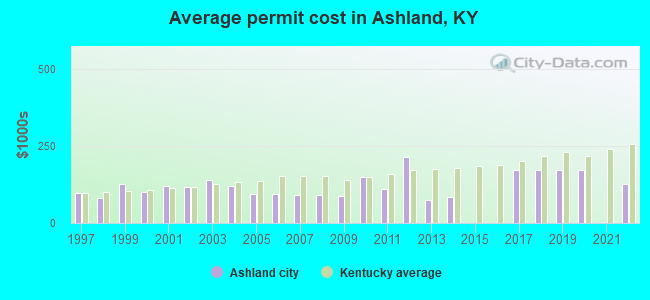
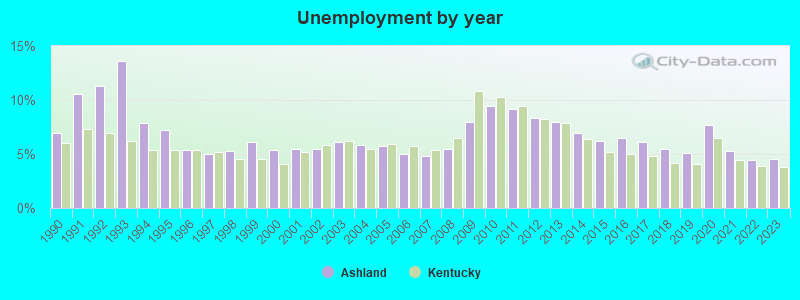

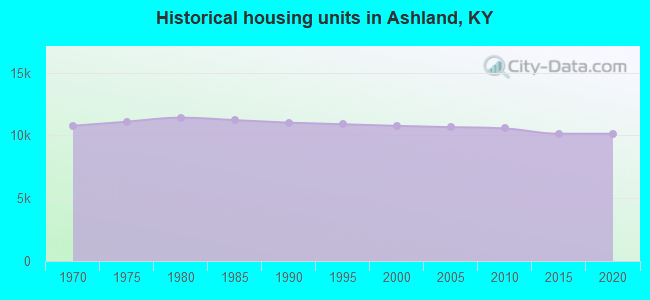
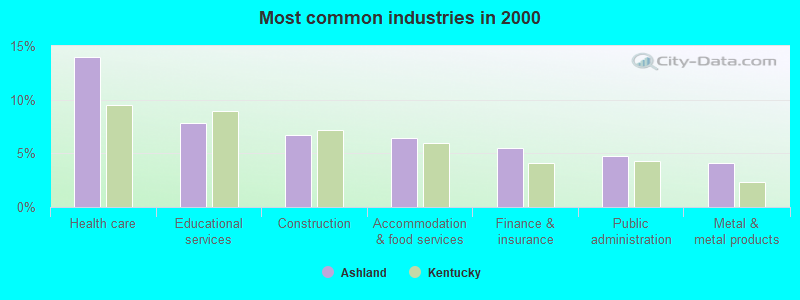
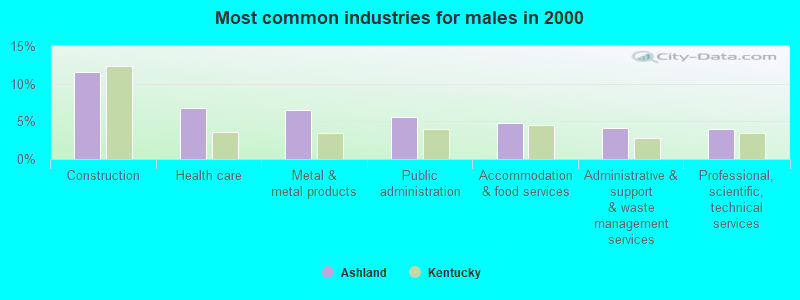
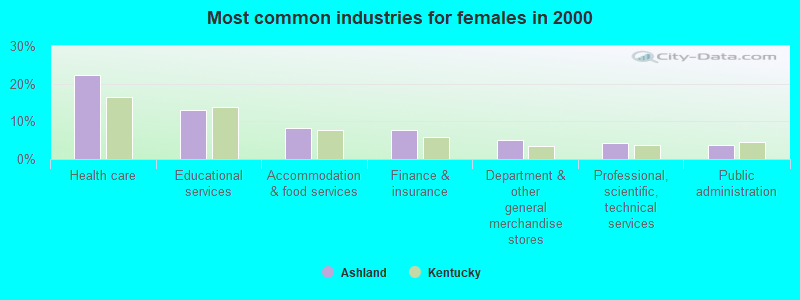
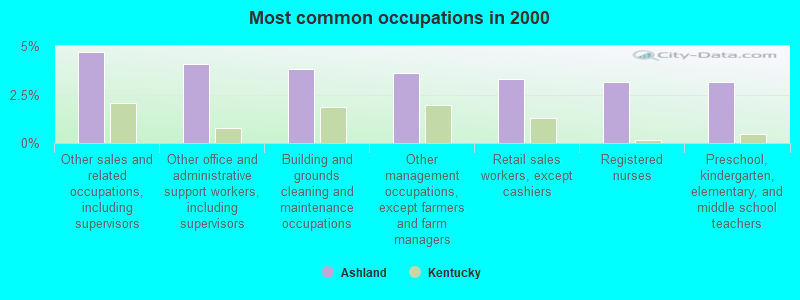
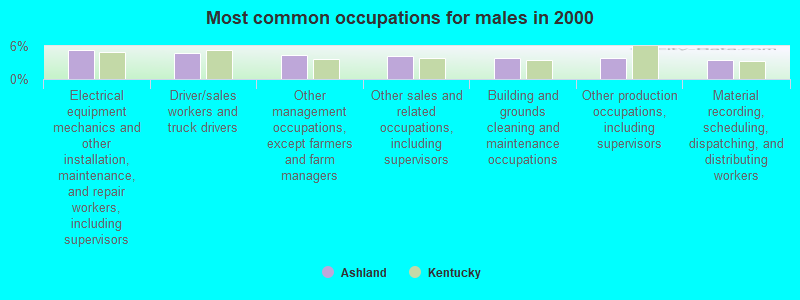
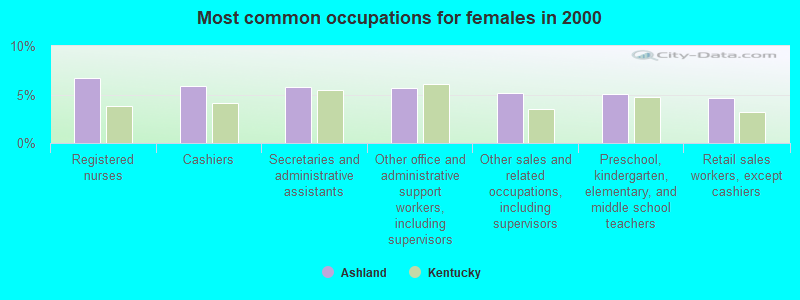


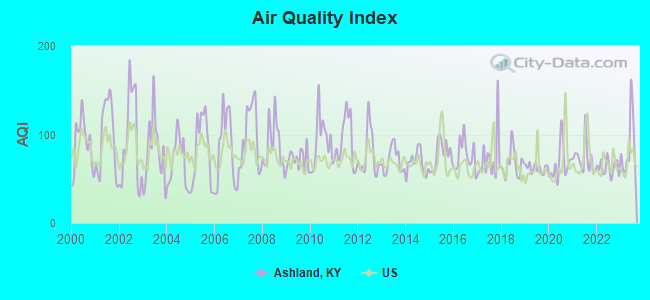
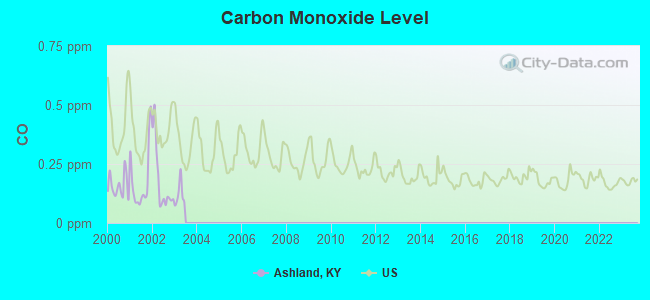
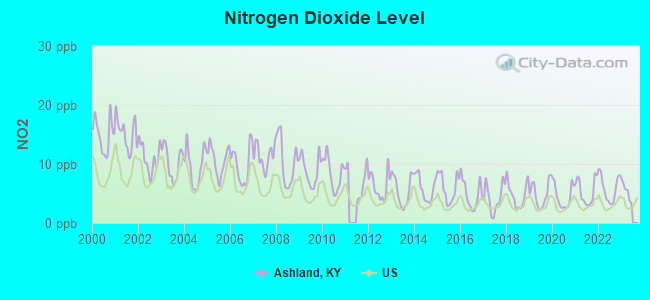
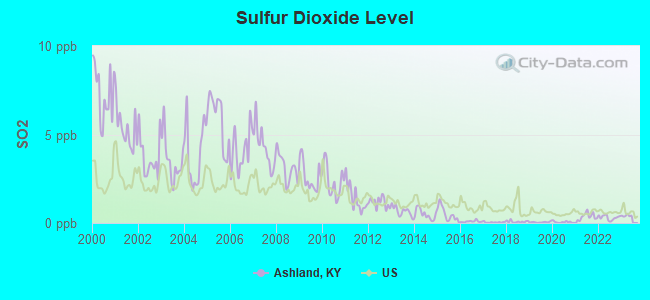
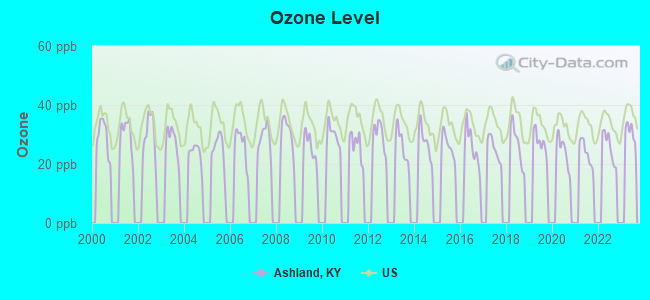
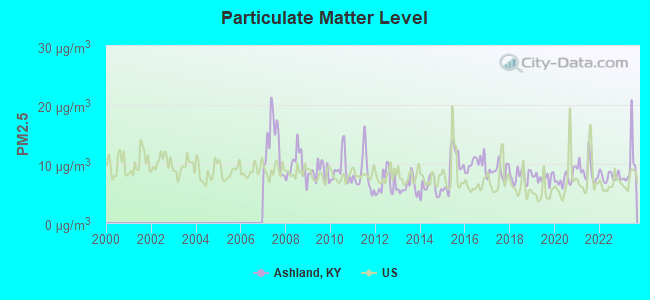
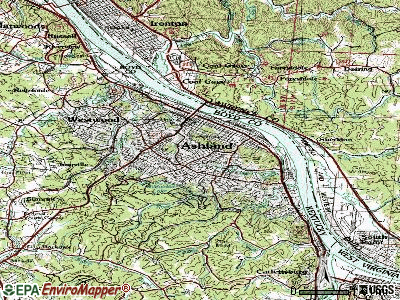
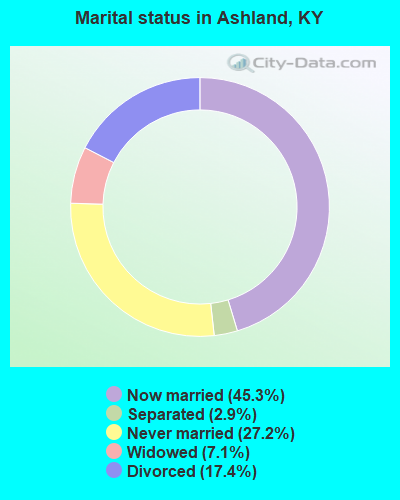
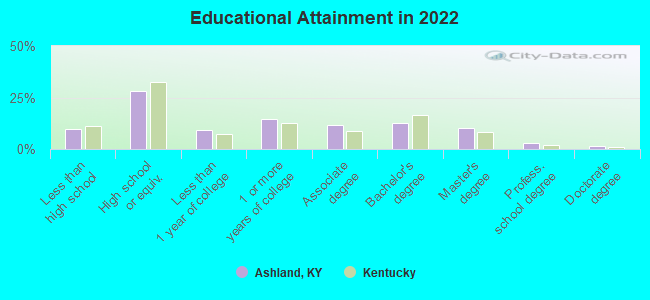
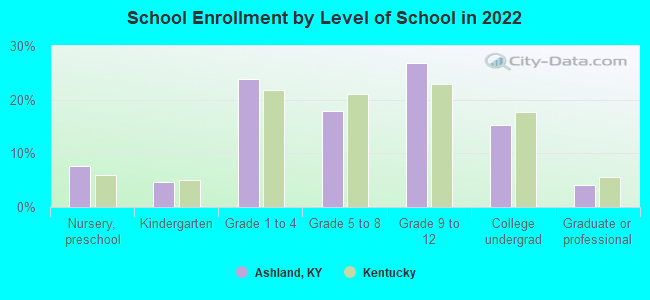
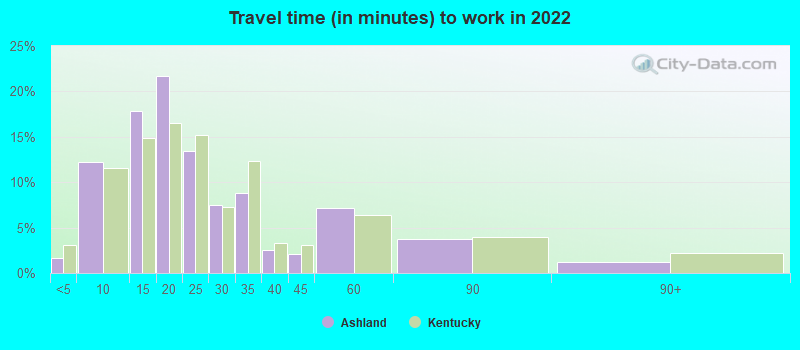
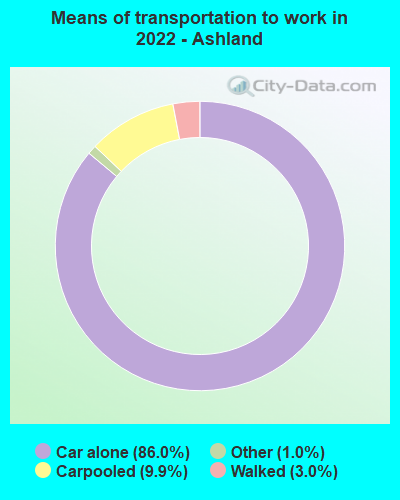
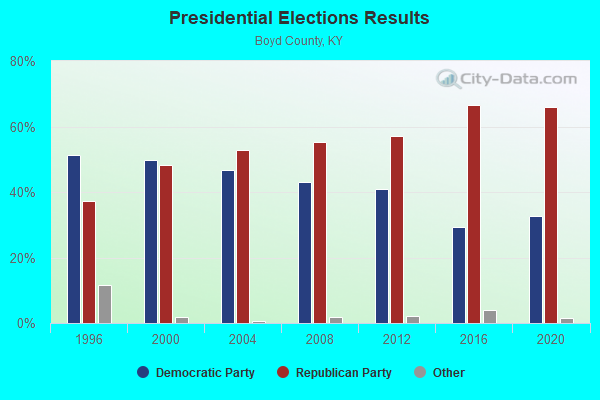
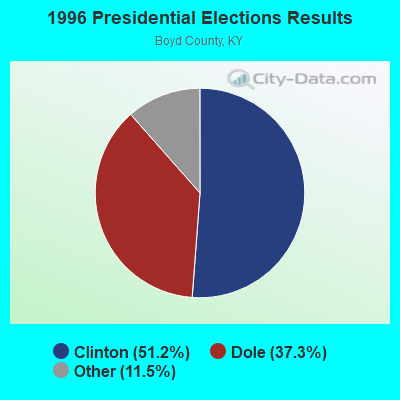
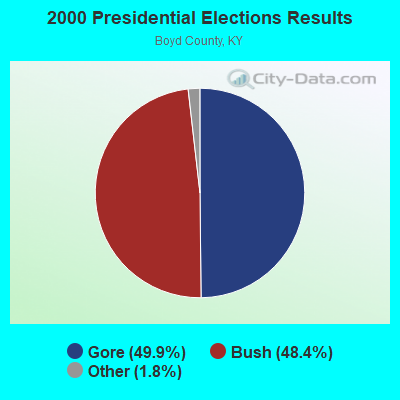
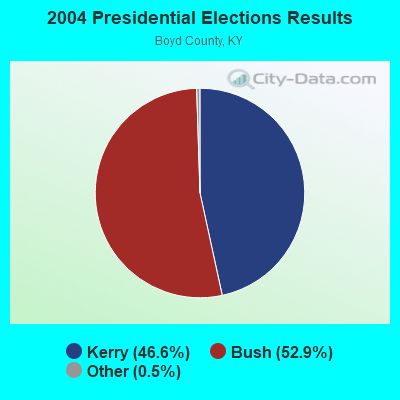
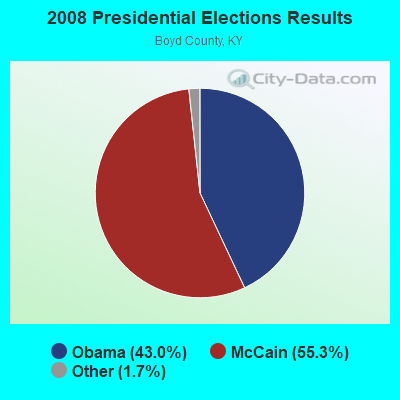
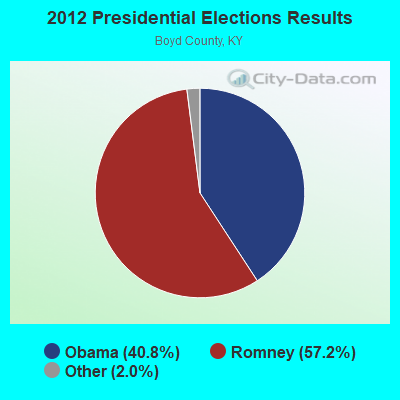
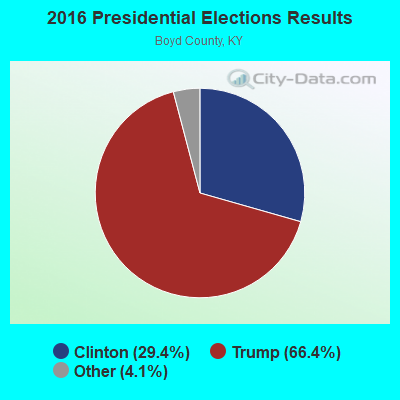
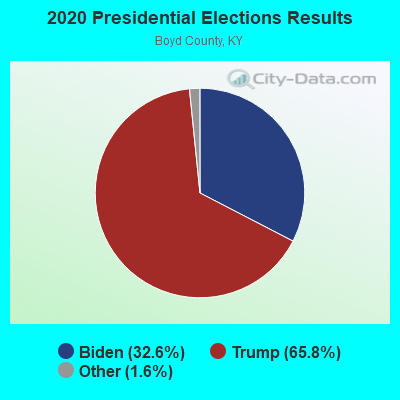
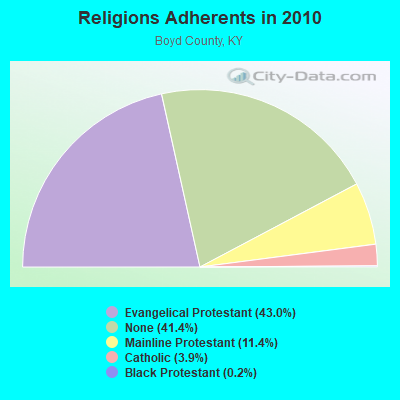
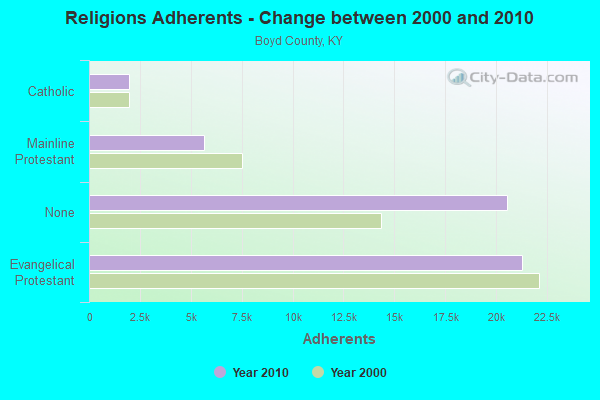
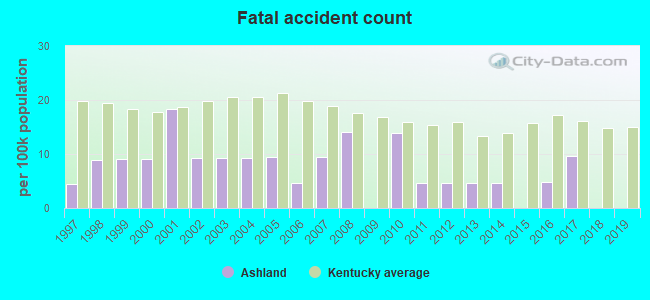
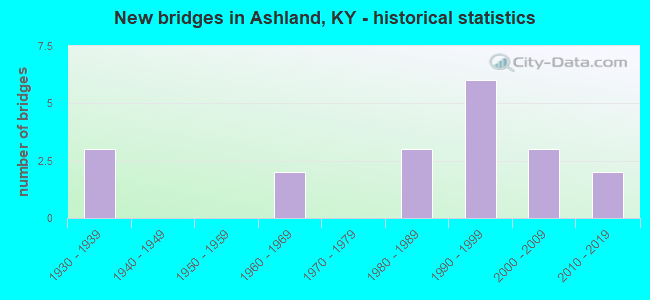
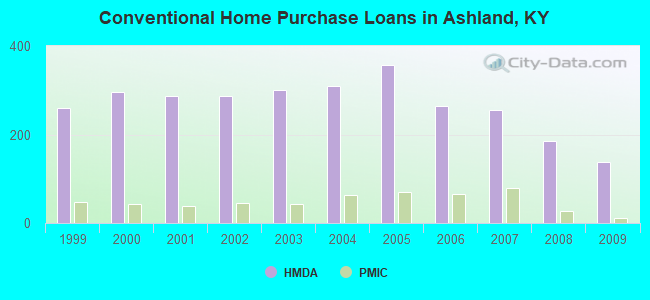
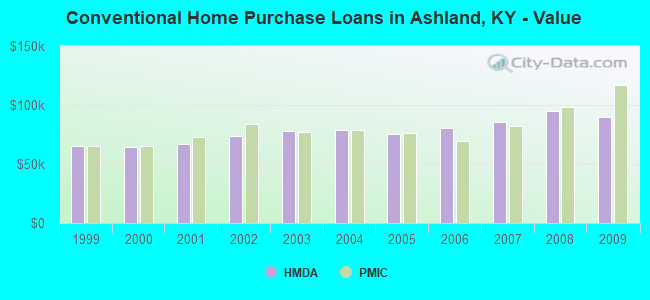
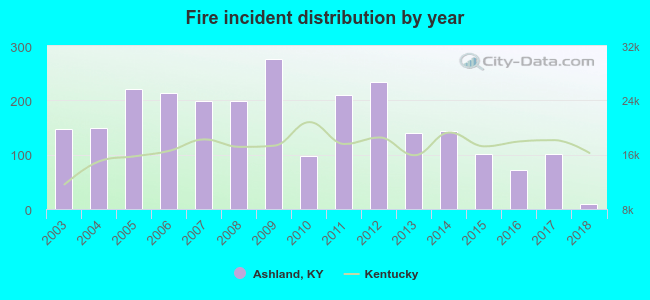 According to the data from the years 2003 - 2018 the average number of fire incidents per year is 157. The highest number of fires - 276 took place in 2009, and the least - 10 in 2018. The data has a decreasing trend.
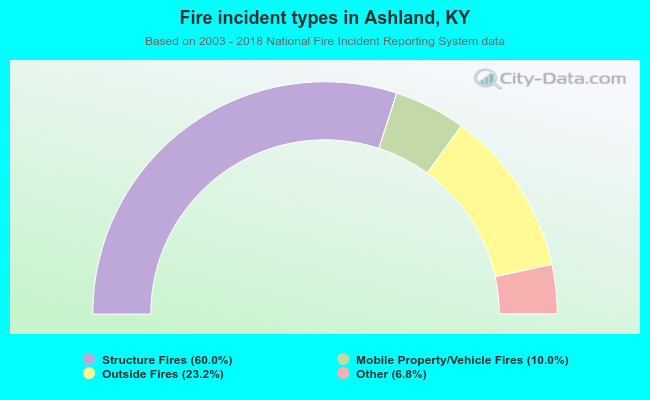 When looking into fire subcategories, the most reports belonged to: Structure Fires (60.0%), and Outside Fires (23.2%).