Sumner: Fire Incidents, Washington (WA)
Where are fire incidents reported in Sumner, WA
Something went wrong! Please refresh the page.
| Fire incidents reported | |
|---|---|
| Sreet name | Count |
| MAIN ST | 166 |
| PARKER RD | 116 |
| VALLEY AV | 110 |
| VALLEY AVE | 84 |
| PUYALLUP ST | 62 |
| SR410 HW | 60 |
| SR167 HW | 52 |
| ELM ST | 42 |
| RIVERSIDE DR | 40 |
| WASHINGTON ST | 38 |
| SR167 HWY | 34 |
| FRYAR AV | 32 |
| 45TH ST | 30 |
| 142ND AV | 28 |
| EAST VALLEY HWY | 28 |
| 24TH ST | 24 |
| SR410 HWY | 24 |
| 64TH ST | 22 |
| GRAHAM AV | 22 |
| HOUSTON RD | 22 |
| SR162 | 22 |
| 142ND AVE | 20 |
| 166TH AV | 20 |
| 16TH ST | 20 |
| STEWART RD | 20 |
| WEST VALLEY HW | 20 |
| 48TH ST | 18 |
| WILLOW ST | 18 |
| 56TH ST | 16 |
| 60TH ST | 16 |
2002 - 2018 National Fire Incident Reporting System (NFIRS) incidents
- Incident types reported to NFIRS in Sumner, WA
- 7,56260.8%Rescue & EMS
- 1,24010.0%Good Intent Call
- 1,1929.6%Fire
- 9097.3%False Alarm
- 8667.0%Service Call
- 6385.1%Hazardous Condition
- 150.1%Overpressure Rupture
- 150.1%Special Incident
- Fire incident types reported to NFIRS in Sumner, WA
- 56047.0%Structure Fires
- 34028.5%Outside Fires
- 20817.4%Mobile Property/Vehicle Fires
- 847.0%Other
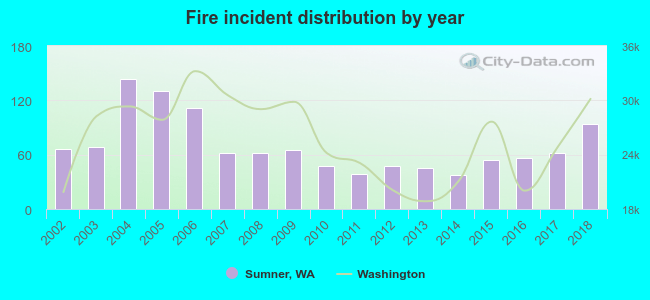 Based on the data from the years 2002 - 2018 the average number of fire incidents per year is 70. The highest number of fires - 144 took place in 2004, and the least - 37 in 2014. The data has a growing trend.
The average number of yearly fire incidents per 10k residents in Sumner, WA compared to nearest cities:
(Note: Based on data for the last 3 years, including only cities with population 5,000 and above)
| Sumner: | 73.0 |
| Edgewood: | 24.6 |
| Puyallup: | 47.5 |
| Bonney Lake: | 67.3 |
| Lake Tapps: | 10.1 |
| Pacific: | 31.1 |
| Milton: | 38.0 |
| Fife: | 68.8 |
| South Hill: | 26.4 |
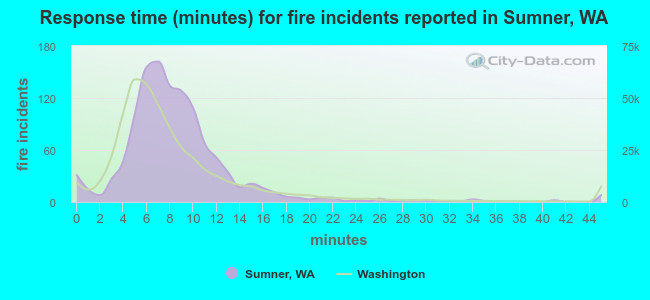 The median response time based on all reported fire incidents is 8 minutes. This is close to the Washington median value.
The median response time in Sumner, WA compared to nearest cities:
(Note: Based on data for all years, including only cities with at least 500 fire incidents)
| Sumner: | 8 minutes |
| Edgewood: | 7 minutes |
| Puyallup: | 7 minutes |
| Bonney Lake: | 8 minutes |
| Milton: | 7 minutes |
| Fife: | 5 minutes |
| Auburn: | 6 minutes |
| Orting: | 7 minutes |
| Federal Way: | 6 minutes |
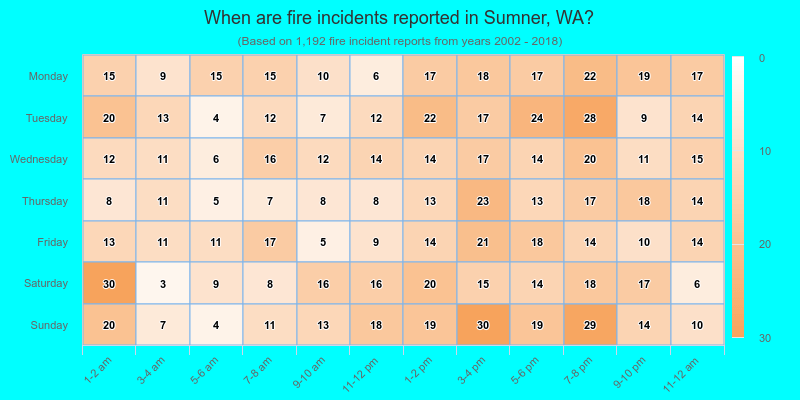
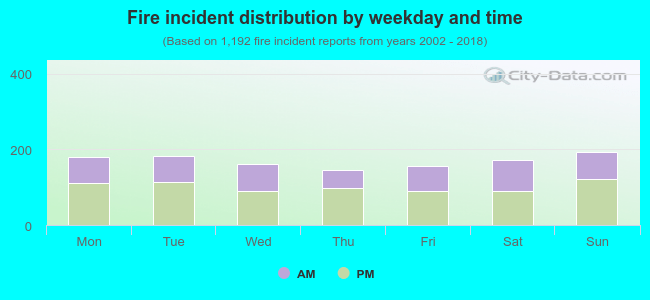 40.0% incidents where reported in the morning and 60.0% in the evening. The most fires (16.3%) took place on Sunday, and the least (12.2%) on Thursday.
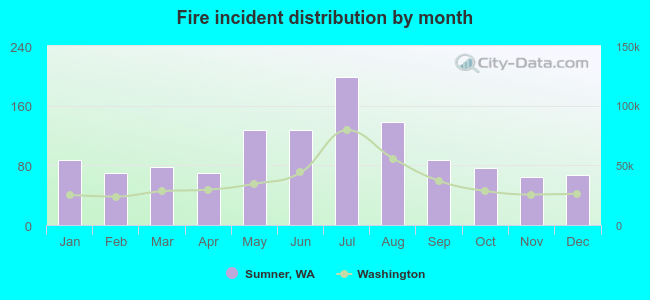 Based on the 1,192 reports from years 2002 - 2018 most fires (16.6%) took place during July, and the least (5.4%) in November.
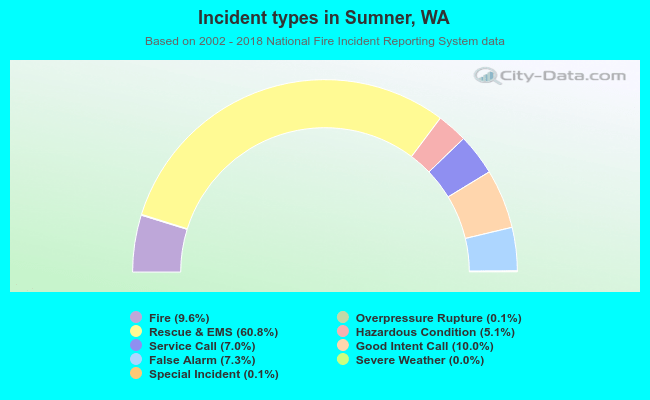 Out of all 12,438 cases reported during the years 2002 - 2018, the most belonged to the categories: Rescue & EMS (60.8%), Good Intent Call (10.0%), and Fire (9.6%).
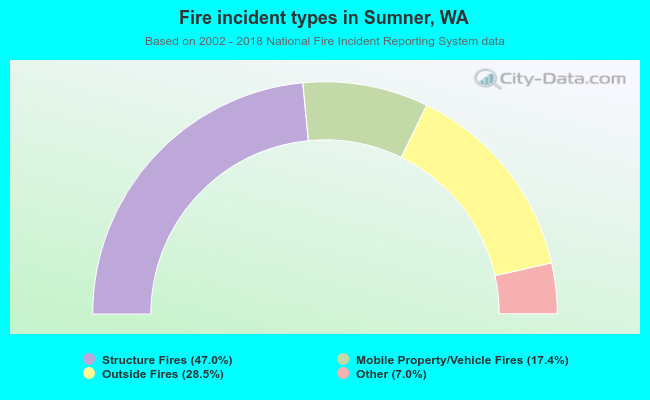 When looking into fire subcategories, the most reports belonged to: Structure Fires (47.0%), and Outside Fires (28.5%).