Milton: Fire Incidents, Washington (WA)
Where are fire incidents reported in Milton, WA
Something went wrong! Please refresh the page.
|
| |||||||||||||||||||||||||||||||||||||||||||||||||||||||||||||||||||||||||||||||||||||||||||||||||||||||||||||
2002 - 2018 National Fire Incident Reporting System (NFIRS) incidents
- Incident types reported to NFIRS in Milton, WA
- 4,88169.6%Rescue & EMS
- 5648.0%Fire
- 5517.9%Good Intent Call
- 4836.9%Service Call
- 2723.9%Hazardous Condition
- 2463.5%False Alarm
- Fire incident types reported to NFIRS in Milton, WA
- 26947.7%Structure Fires
- 18332.4%Outside Fires
- 9016.0%Mobile Property/Vehicle Fires
- 223.9%Other
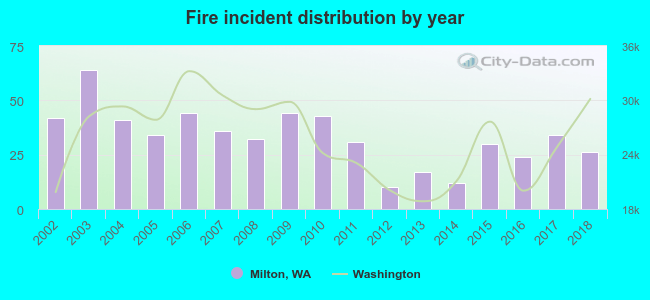 Based on the data from the years 2002 - 2018 the average number of fire incidents per year is 33. The highest number of reported fire incidents - 64 took place in 2003, and the least - 10 in 2012. The data has a decreasing trend.
The average number of yearly fire incidents per 10k residents in Milton, WA compared to nearest cities:
(Note: Based on data for the last 3 years, including only cities with population 5,000 and above)
| Milton: | 38.0 |
| Edgewood: | 24.6 |
| Fife: | 68.8 |
| Pacific: | 31.1 |
| Puyallup: | 47.5 |
| Federal Way: | 46.6 |
| Sumner: | 73.0 |
| Auburn: | 54.1 |
| Tacoma: | 50.3 |
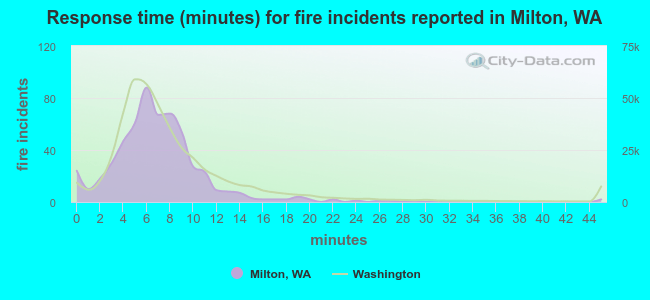 The median response time based on all reported fire incidents is 7 minutes. This is close to the state median value.
The median response time in Milton, WA compared to nearest cities:
(Note: Based on data for all years, including only cities with at least 500 fire incidents)
| Milton: | 7 minutes |
| Edgewood: | 7 minutes |
| Fife: | 5 minutes |
| Puyallup: | 7 minutes |
| Federal Way: | 6 minutes |
| Sumner: | 8 minutes |
| Auburn: | 6 minutes |
| Tacoma: | 5 minutes |
| Bonney Lake: | 8 minutes |
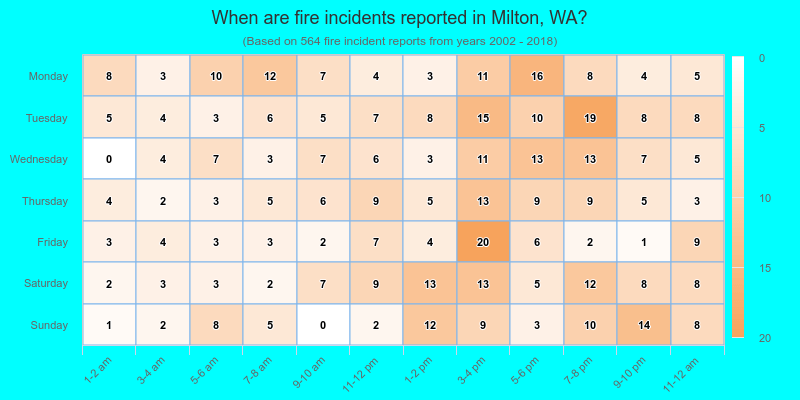
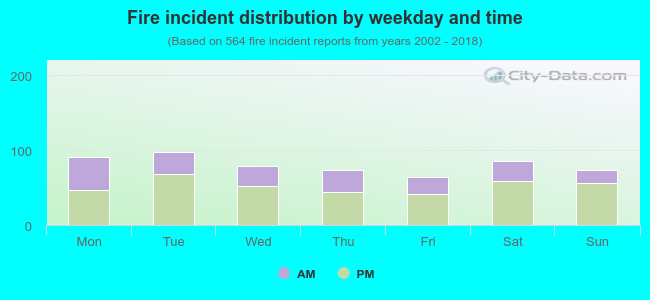 34.8% incidents where reported in the morning and 65.2% in the evening. The most fires (17.4%) took place on Tuesday, and the least (11.3%) on Friday.
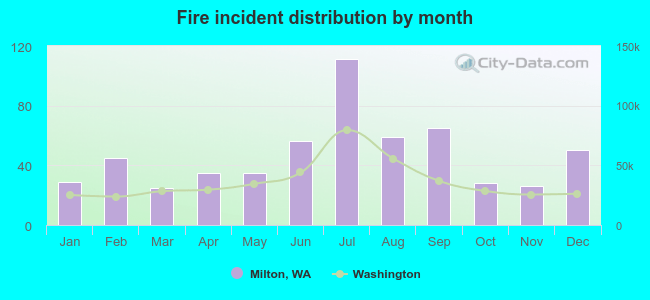 Based on the 564 fire incident reports from years 2002 - 2018 most fires (19.7%) took place during July, and the least (4.4%) in March.
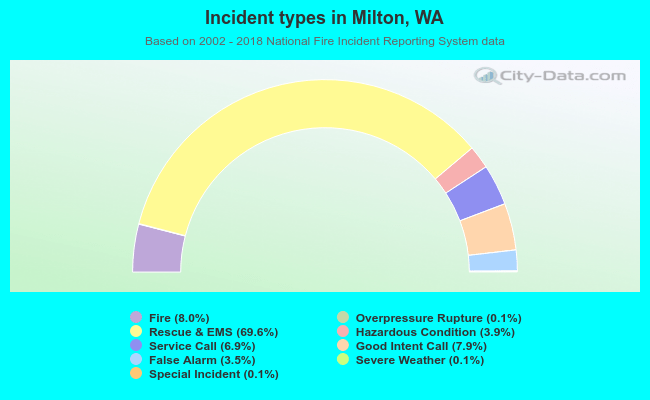 Out of all 7,013 cases reported during the years 2002 - 2018, the most belonged to the categories: Rescue & EMS (69.6%), Fire (8.0%), and Good Intent Call (7.9%).
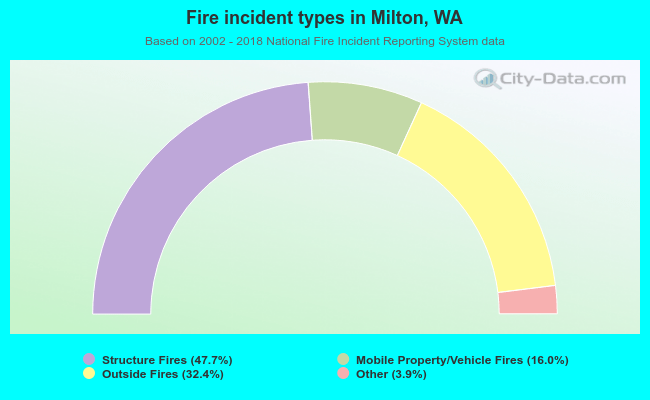 When looking into fire subcategories, the most reports belonged to: Structure Fires (47.7%), and Outside Fires (32.4%).