Stanford: Fire Incidents, California (CA)
Where are fire incidents reported in Stanford, CA
Something went wrong! Please refresh the page.
|
| |||||||||||||||||||||||||||||||||||||||||||||||||||||||||||||||||||||||||||||||||||||||||||||||||||||||||||||
2009 - 2018 National Fire Incident Reporting System (NFIRS) incidents
- Incident types reported to NFIRS in Stanford, CA
- 2,42045.3%Rescue & EMS
- 1,59829.9%False Alarm
- 61011.4%Good Intent Call
- 2895.4%Fire
- 2154.0%Hazardous Condition
- 1512.8%Service Call
- 581.1%Special Incident
- Fire incident types reported to NFIRS in Stanford, CA
- 14349.5%Outside Fires
- 8730.1%Structure Fires
- 3612.5%Other
- 238.0%Mobile Property/Vehicle Fires
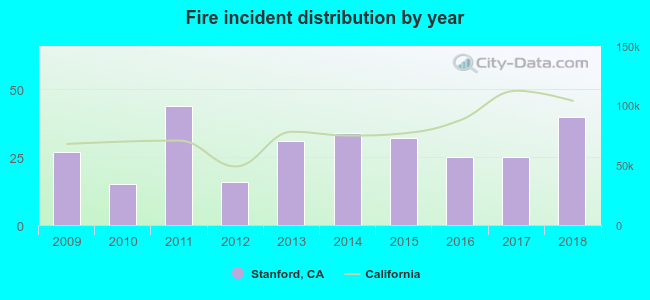 According to the data from the years 2009 - 2018 the average number of fires per year is 29. The highest number of fires - 44 took place in 2011, and the least - 15 in 2010. The data has a growing trend.
The average number of yearly fire incidents per 10k residents in Stanford, CA compared to nearest cities:
(Note: Based on data for the last 3 years, including only cities with population 5,000 and above)
| Stanford: | 21.7 |
| Palo Alto: | 18.5 |
| Menlo Park: | 21.6 |
| Atherton: | 10.3 |
| East Palo Alto: | 20.3 |
| Los Altos Hills: | 22.2 |
| Mountain View: | 5.5 |
| Woodside: | 83.2 |
| Los Altos: | 11.9 |

 29.8% incidents where reported in the morning and 70.2% in the evening. The most fires (20.4%) took place on Saturday, and the least (12.5%) on Tuesday.
 According to the 289 fire incidents from years 2009 - 2018 most fires (15.6%) took place during June, and the least (3.1%) in December.
 Out of all 5,342 cases reported during the years 2009 - 2018, the most belonged to the categories: Overpressure Rupture (45.3%), Good Intent Call (29.9%), and Service Call (11.4%).
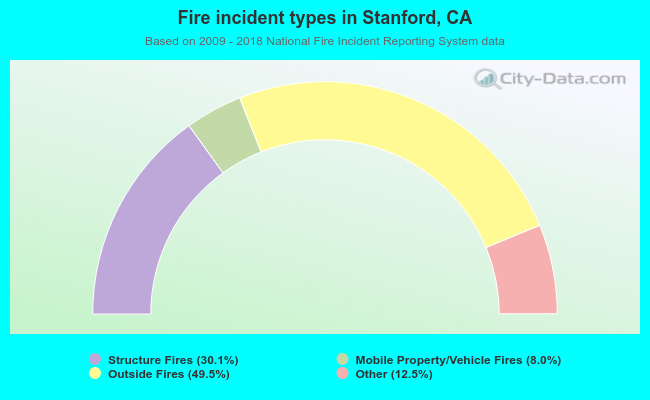 When looking into fire subcategories, the most incidents belonged to: Outside Fires (49.5%), and Structure Fires (30.1%).