East Palo Alto: Fire Incidents, California (CA)
Where are fire incidents reported in East Palo Alto, CA
Something went wrong! Please refresh the page.
| Fire incidents reported | |
|---|---|
| Sreet name | Count |
| BAY RD | 102 |
| BAYSHORE RD | 78 |
| ILLINOIS ST | 48 |
| BELL ST | 40 |
| CAMELLIA DR | 40 |
| BEECH ST | 38 |
| FORDHAM ST | 38 |
| COOLEY AV | 36 |
| PULGAS AV | 34 |
| WOODLAND AV | 34 |
| RUNNYMEDE ST | 32 |
| GARDEN ST | 30 |
| UNIVERSITY AV | 30 |
| AZALIA DR | 28 |
| O KEEFE ST | 28 |
| CLARKE AV | 26 |
| WISTERIA DR | 26 |
| DAPHNE WY | 24 |
| BAYSHORE E RD | 22 |
| COOLEY | 22 |
| WEEKS ST | 22 |
| DONOHOE ST | 20 |
| NEWELL CT | 20 |
| GONZAGA ST | 18 |
| MANHATTAN AV | 18 |
| RALMAR AV | 18 |
| CAPITOL AV | 14 |
| DAISY LA | 14 |
| DUMBARTON AV | 14 |
| NEWBRIDGE ST | 14 |
2005 - 2018 National Fire Incident Reporting System (NFIRS) incidents
- Incident types reported to NFIRS in East Palo Alto, CA
- 8,12068.1%Rescue & EMS
- 1,0178.5%Service Call
- 8186.9%Fire
- 8176.9%Good Intent Call
- 7546.3%False Alarm
- 3753.1%Hazardous Condition
- Fire incident types reported to NFIRS in East Palo Alto, CA
- 29235.7%Outside Fires
- 27433.5%Structure Fires
- 21526.3%Mobile Property/Vehicle Fires
- 374.5%Other
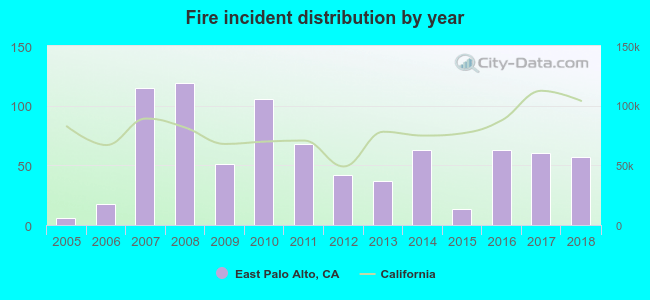 According to the data from the years 2005 - 2018 the average number of fire incidents per year is 58. The highest number of fires - 119 took place in 2008, and the least - 6 in 2005. The data has a rising trend.
The average number of yearly fire incidents per 10k residents in East Palo Alto, CA compared to nearest cities:
(Note: Based on data for the last 3 years, including only cities with population 5,000 and above)
| East Palo Alto: | 20.3 |
| Menlo Park: | 21.6 |
| Palo Alto: | 18.5 |
| Atherton: | 10.3 |
| Stanford: | 21.7 |
| Redwood City: | 23.3 |
| Mountain View: | 5.5 |
| Los Altos Hills: | 22.2 |
| San Carlos: | 15.2 |
 The median response time based on all reported fire incidents is 4 minutes. This is lower than the California median value.
The median response time in East Palo Alto, CA compared to nearest cities:
(Note: Based on data for all years, including only cities with at least 500 fire incidents)
| East Palo Alto: | 4 minutes |
| Menlo Park: | 4 minutes |
| Palo Alto: | 6 minutes |
| Redwood City: | 5 minutes |
| Mountain View: | 5 minutes |
| San Carlos: | 5 minutes |
| Newark: | 4 minutes |
| Belmont: | 5 minutes |
| Sunnyvale: | 5 minutes |
 Based on the reports from the years 2005 - 2018 the average number of fire-related casualties per year is 0. The highest number of reported casualties - 3 took place in 2007, and the lowest - 0 in 2005. The data has a constant trend.
The average number of casualties per 1,000 fire incidents is 4. This indicator was the highest - 26 in 2007, and the lowest 0 in 2005. The trend for injuries per 1,000 fire incidents is constant. Compared to the state value the number of injuries per 1,000 incidents is similar.
Based on the reports from the years 2005 - 2018 the average number of fire-related casualties per year is 0. The highest number of reported casualties - 3 took place in 2007, and the lowest - 0 in 2005. The data has a constant trend.
The average number of casualties per 1,000 fire incidents is 4. This indicator was the highest - 26 in 2007, and the lowest 0 in 2005. The trend for injuries per 1,000 fire incidents is constant. Compared to the state value the number of injuries per 1,000 incidents is similar.Casualties per 1,000 incidents in East Palo Alto, CA compared to nearest cities:
(Note: Based on data for all years, including only cities with at least 500 fire incidents)
| East Palo Alto: | 6.1 |
| Menlo Park: | 2.6 |
| Palo Alto: | 3.0 |
| Redwood City: | 6.8 |
| Mountain View: | 4.7 |
| San Carlos: | 0.0 |
| Newark: | 0.0 |
| Belmont: | 0.0 |
| Sunnyvale: | 18.3 |
 36.1% incidents where reported in the morning and 63.9% in the evening. The most fires (14.9%) took place on Monday, and the least (13.1%) on Friday.
 Based on the 818 fire incident reports from years 2005 - 2018 most fires (12.7%) took place during July, and the least (6.0%) in October.
 Out of all 11,920 cases reported during the years 2005 - 2018, the most belonged to the categories: Rescue & EMS (68.1%), Service Call (8.5%), and Fire (6.9%).
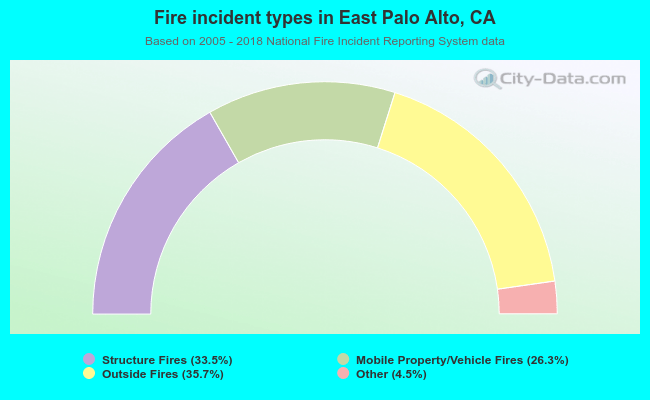 When looking into fire subcategories, the most reports belonged to: Outside Fires (35.7%), and Structure Fires (33.5%).