Southfield: Fire Incidents, Michigan (MI)
Where are fire incidents reported in Southfield, MI
Something went wrong! Please refresh the page.
| Fire incidents reported | |
|---|---|
| Sreet name | Count |
| FRANKLIN ROAD | 334 |
| NORTHWESTERN HIGHWAY | 288 |
| TELEGRAPH ROAD | 258 |
| TWELVE MILE ROAD | 248 |
| EIGHT MILE ROAD | 174 |
| GREENFIELD ROAD | 168 |
| NINE MILE ROAD | 160 |
| SOUTHFIELD ROAD | 158 |
| LAHSER ROAD | 134 |
| EVERGREEN ROAD | 120 |
| PROVIDENCE DRIVE | 104 |
| US 10 | 102 |
| 696 | 90 |
| TEN MILE ROAD | 90 |
| CIVIC CENTER DRIVE | 88 |
| ELEVEN MILE ROAD | 76 |
| NORTH PARK DRIVE | 70 |
| MELROSE | 54 |
| BERG ROAD | 52 |
| SHIAWASSEE | 52 |
| FAIRFAX | 48 |
| FRANKLIN HILLS (FRANKLIN | 40 |
| KNOB WOODS DRIVE (KNOB-IN | 32 |
| OXLEY (WHITEHALL APARTMEN | 32 |
| GRODAN DRIVE | 30 |
| LATHRUP | 30 |
| MIDWAY | 30 |
| MARSHALL | 28 |
| ADDISON | 26 |
| JEANETTE | 26 |
2002 - 2018 National Fire Incident Reporting System (NFIRS) incidents
- Incident types reported to NFIRS in Southfield, MI
- 3,34127.6%False Alarm
- 2,94624.4%Hazardous Condition
- 2,86023.7%Fire
- 1,44311.9%Service Call
- 1,0268.5%Good Intent Call
- 3192.6%Rescue & EMS
- 760.6%Special Incident
- 640.5%Overpressure Rupture
- Fire incident types reported to NFIRS in Southfield, MI
- 1,18241.3%Structure Fires
- 72525.3%Mobile Property/Vehicle Fires
- 61421.5%Outside Fires
- 33911.9%Other
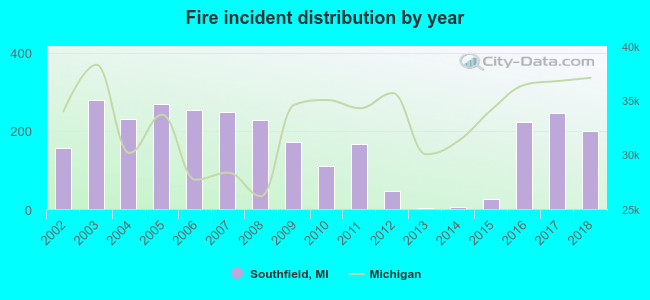 According to the data from the years 2002 - 2018 the average number of fire incidents per year is 168. The highest number of fire incidents - 278 took place in 2003, and the least - 3 in 2013. The data has a rising trend.
The average number of yearly fire incidents per 10k residents in Southfield, MI compared to nearest cities:
(Note: Based on data for the last 3 years, including only cities with population 5,000 and above)
| Southfield: | 30.5 |
| Beverly Hills: | 23.9 |
| Berkley: | 19.4 |
| Oak Park: | 30.4 |
| Huntington Woods: | 15.2 |
| Birmingham: | 15.9 |
| Royal Oak: | 15.8 |
| Ferndale: | 32.1 |
| Clawson: | 16.0 |
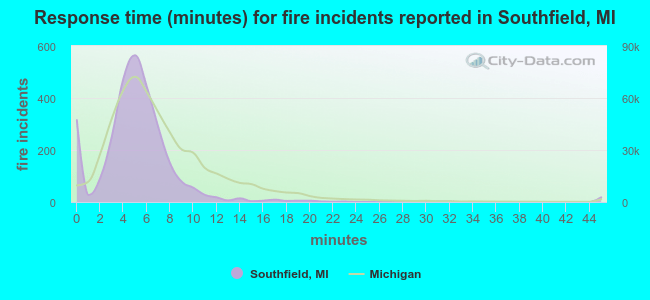 The median response time based on all reported fire incidents is 5 minutes. This is lower than the Michigan median value.
The median response time in Southfield, MI compared to nearest cities:
(Note: Based on data for all years, including only cities with at least 500 fire incidents)
| Southfield: | 5 minutes |
| Oak Park: | 3 minutes |
| Royal Oak: | 6 minutes |
| Ferndale: | 4 minutes |
| Farmington Hills: | 8 minutes |
| Madison Heights: | 3 minutes |
| Hazel Park: | 4 minutes |
| Livonia: | 4 minutes |
| Troy: | 7 minutes |
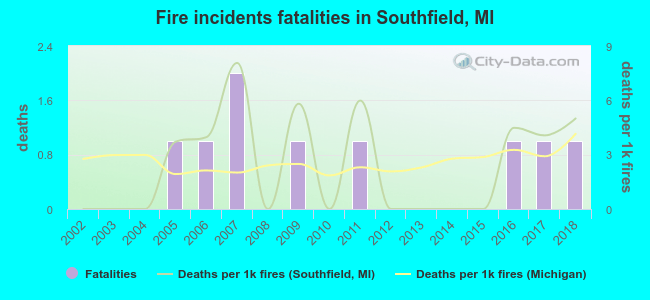 According to the data from the years 2002 - 2018 the average number of fire-related fatalities per year is 1. The highest number of reported deaths - 2 took place in 2007, and the lowest - 0 in 2002. The data has a rising trend.
The average number of deaths per 1,000 fires is 2. This indicator was the highest - 8 in 2007, and the lowest 0 in 2002. The trend for deaths per 1,000 incidents is increasing. Compared to the state value the number of deaths per 1,000 incidents is similar.
According to the data from the years 2002 - 2018 the average number of fire-related fatalities per year is 1. The highest number of reported deaths - 2 took place in 2007, and the lowest - 0 in 2002. The data has a rising trend.
The average number of deaths per 1,000 fires is 2. This indicator was the highest - 8 in 2007, and the lowest 0 in 2002. The trend for deaths per 1,000 incidents is increasing. Compared to the state value the number of deaths per 1,000 incidents is similar.
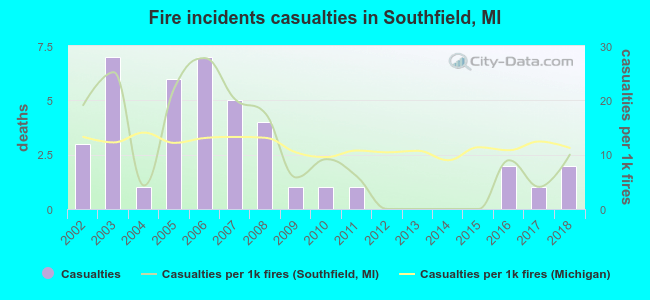 According to the reports from the years 2002 - 2018 the average number of fire-related casualties per year is 2. The highest number of injuries - 7 took place in 2003, and the lowest - 0 in 2012. The data has a declining trend.
The average number of injuries per 1,000 fire incidents is 11. This indicator was the highest - 28 in 2006, and the lowest 0 in 2012. The trend for casualties per 1,000 fire incidents is declining. Compared to the Michigan value the number of casualties per 1,000 fire incidents is higher.
According to the reports from the years 2002 - 2018 the average number of fire-related casualties per year is 2. The highest number of injuries - 7 took place in 2003, and the lowest - 0 in 2012. The data has a declining trend.
The average number of injuries per 1,000 fire incidents is 11. This indicator was the highest - 28 in 2006, and the lowest 0 in 2012. The trend for casualties per 1,000 fire incidents is declining. Compared to the Michigan value the number of casualties per 1,000 fire incidents is higher.Casualties per 1,000 incidents in Southfield, MI compared to nearest cities:
(Note: Based on data for all years, including only cities with at least 500 fire incidents)
| Southfield: | 14.3 |
| Oak Park: | 9.2 |
| Royal Oak: | 24.1 |
| Ferndale: | 33.1 |
| Farmington Hills: | 48.2 |
| Madison Heights: | 10.5 |
| Hazel Park: | 21.9 |
| Livonia: | 13.8 |
| Troy: | 18.0 |
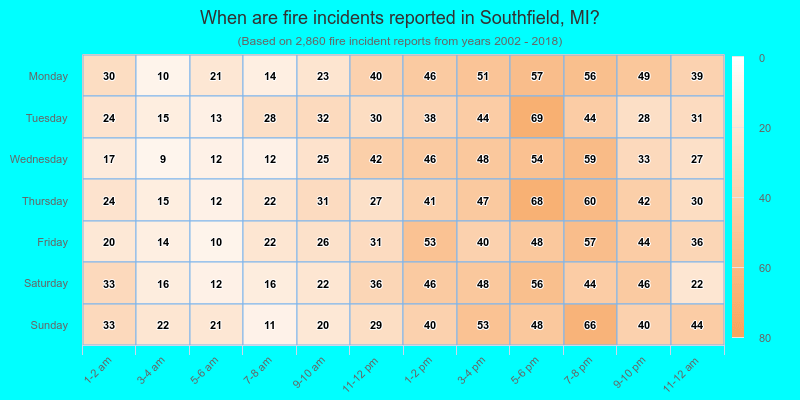
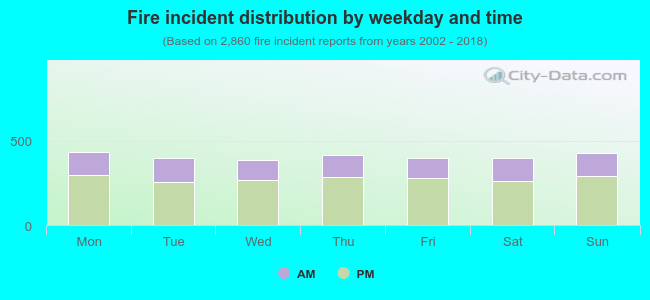 32.2% incidents where reported in the morning and 67.8% in the evening. The most fires (15.2%) took place on Monday, and the least (13.4%) on Wednesday.
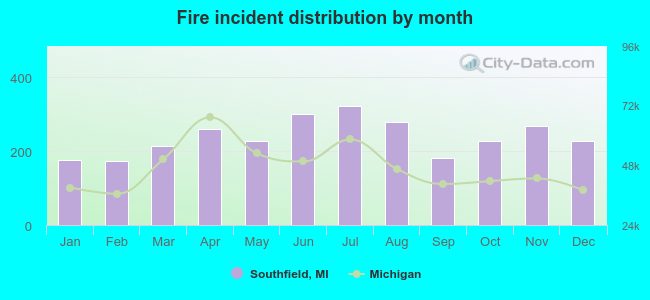 According to the 2,860 fire incidents from years 2002 - 2018 most fires (11.3%) took place during July, and the least (6.1%) in February.
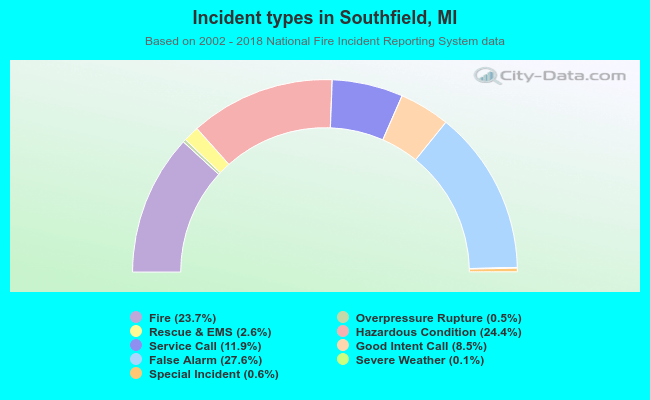 Out of all 12,087 cases reported during the years 2002 - 2018, the most belonged to the categories: False Alarm (27.6%), Hazardous Condition (24.4%), and Fire (23.7%).
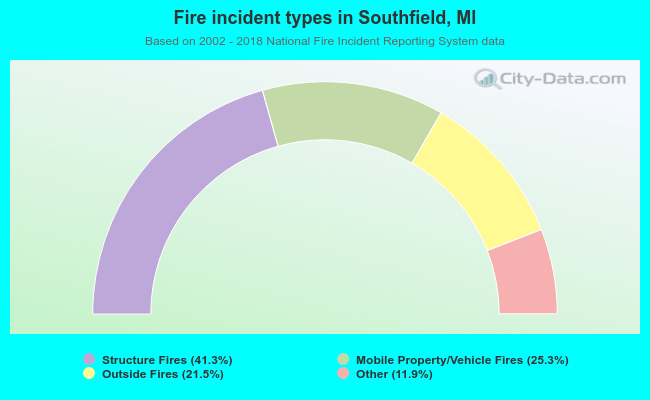 When looking into fire subcategories, the most incidents belonged to: Structure Fires (41.3%), and Mobile Property/Vehicle Fires (25.3%).