Farmington Hills: Fire Incidents, Michigan (MI)
Where are fire incidents reported in Farmington Hills, MI
Something went wrong! Please refresh the page.
| Fire incidents reported | |
|---|---|
| Sreet name | Count |
| TWELVE MILE RD | 212 |
| GRAND RIVER AVE | 184 |
| ORCHARD LAKE RD | 166 |
| EIGHT MILE RD | 122 |
| MIDDLEBELT RD | 110 |
| THIRTEEN MILE RD | 86 |
| GATEWAY DR | 70 |
| NORTHWESTERN HWY | 68 |
| HALSTED RD | 64 |
| I696 | 62 |
| TEN MILE RD | 54 |
| FARMINGTON RD | 52 |
| NINE MILE RD | 52 |
| GREEN HILL RD | 40 |
| ELEVEN MILE RD | 38 |
| HAGGERTY RD | 36 |
| DRAKE RD | 30 |
| I696 OFRP | 30 |
| SHIAWASSEE RD | 30 |
| FOURTEEN MILE RD | 28 |
| TUCK RD | 28 |
| I275 CONN | 26 |
| INDEPENDENCE DR | 26 |
| RHONSWOOD DR | 26 |
| HILLSTECH DR | 24 |
| FREEDOM RD | 22 |
| GILL RD | 22 |
| JEFFERSON CT | 22 |
| CREST FOREST DR | 20 |
| I696 CONN | 20 |
| Other | 324 |
2002 - 2018 National Fire Incident Reporting System (NFIRS) incidents
- Incident types reported to NFIRS in Farmington Hills, MI
- 29,64558.8%Rescue & EMS
- 6,83313.5%Service Call
- 3,9867.9%False Alarm
- 3,8497.6%Good Intent Call
- 3,5797.1%Hazardous Condition
- 2,0944.1%Fire
- 4440.9%Special Incident
- Fire incident types reported to NFIRS in Farmington Hills, MI
- 99347.4%Structure Fires
- 57727.6%Mobile Property/Vehicle Fires
- 46022.0%Outside Fires
- 643.1%Other
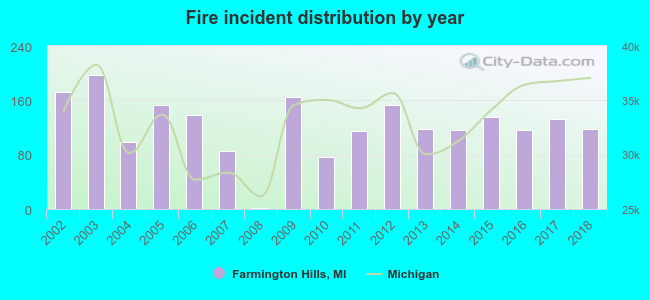 Based on the data from the years 2002 - 2018 the average number of fires per year is 123. The highest number of fires - 198 took place in 2003, and the least - 2 in 2008. The data has a dropping trend.
The average number of yearly fire incidents per 10k residents in Farmington Hills, MI compared to nearest cities:
(Note: Based on data for the last 3 years, including only cities with population 5,000 and above)
| Farmington Hills: | 15.0 |
| Farmington: | 18.3 |
| Novi: | 17.0 |
| Walled Lake: | 32.3 |
| Livonia: | 14.2 |
| Northville: | 96.4 |
| Southfield: | 30.5 |
| Redford: | 0.2 |
| Beverly Hills: | 23.9 |
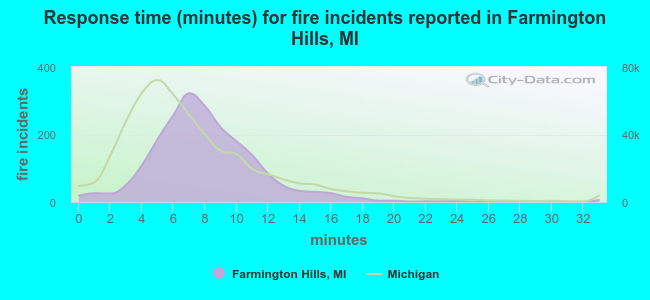 The median response time based on all reported fire incidents is 8 minutes. This is higher compared to the state median value.
The median response time in Farmington Hills, MI compared to nearest cities:
(Note: Based on data for all years, including only cities with at least 500 fire incidents)
| Farmington Hills: | 8 minutes |
| Novi: | 6 minutes |
| Livonia: | 4 minutes |
| Northville: | 7 minutes |
| Southfield: | 5 minutes |
| Wixom: | 9 minutes |
| Plymouth: | 6 minutes |
| Oak Park: | 3 minutes |
| Garden City: | 5 minutes |
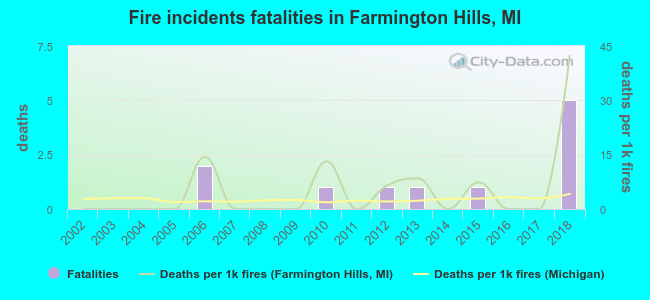 According to the reports from the years 2002 - 2018 the average number of fire-related yearly deaths is 1. The highest number of reported deaths - 5 took place in 2018, and the lowest - 0 in 2002. The data has a rising trend.
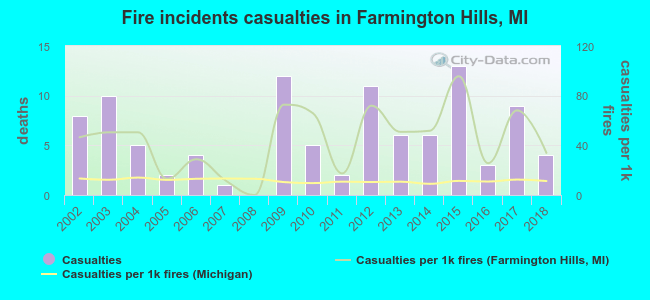 According to the data from the years 2002 - 2018 the average number of fire-related yearly casualties is 6. The highest number of reported injuries - 13 took place in 2015, and the lowest - 0 in 2008. The data has a decreasing trend.
The average number of casualties per 1,000 fire incidents is 44. This indicator was the highest - 96 in 2015, and the lowest 0 in 2008. The trend for casualties per 1,000 fire incidents is decreasing. Compared to the state value the number of injuries per 1,000 incidents is much higher.
According to the data from the years 2002 - 2018 the average number of fire-related yearly casualties is 6. The highest number of reported injuries - 13 took place in 2015, and the lowest - 0 in 2008. The data has a decreasing trend.
The average number of casualties per 1,000 fire incidents is 44. This indicator was the highest - 96 in 2015, and the lowest 0 in 2008. The trend for casualties per 1,000 fire incidents is decreasing. Compared to the state value the number of injuries per 1,000 incidents is much higher.Casualties per 1,000 incidents in Farmington Hills, MI compared to nearest cities:
(Note: Based on data for all years, including only cities with at least 500 fire incidents)
| Farmington Hills: | 48.2 |
| Novi: | 33.3 |
| Livonia: | 13.8 |
| Northville: | 16.0 |
| Southfield: | 14.3 |
| Wixom: | 1.9 |
| Plymouth: | 9.3 |
| Oak Park: | 9.2 |
| Garden City: | 29.5 |
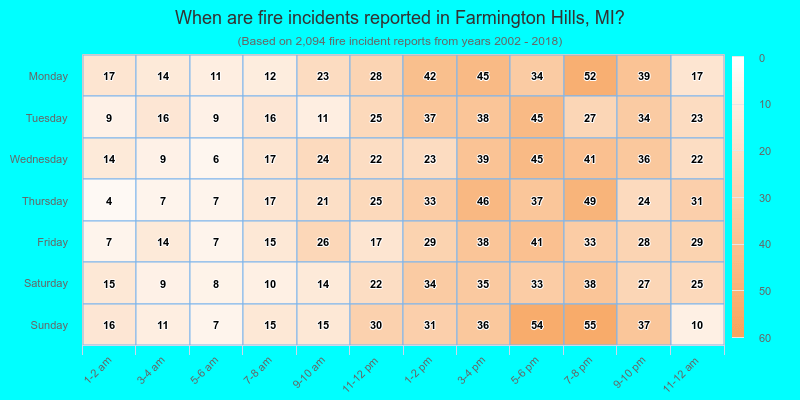
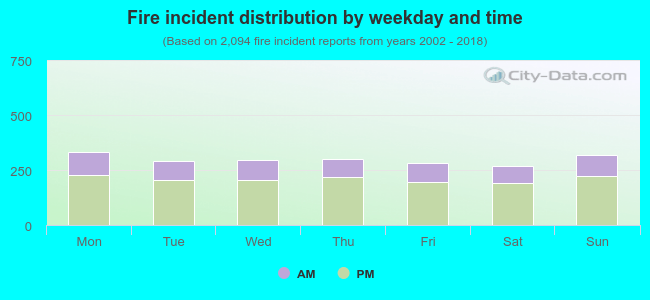 29.7% incidents where reported in the morning and 70.3% in the evening. The most fires (16.0%) took place on Monday, and the least (12.9%) on Saturday.
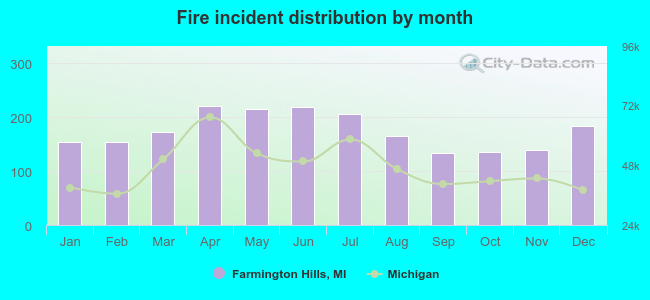 According to the 2,094 fire incidents from years 2002 - 2018 most fires (10.6%) took place during April, and the least (6.4%) in September.
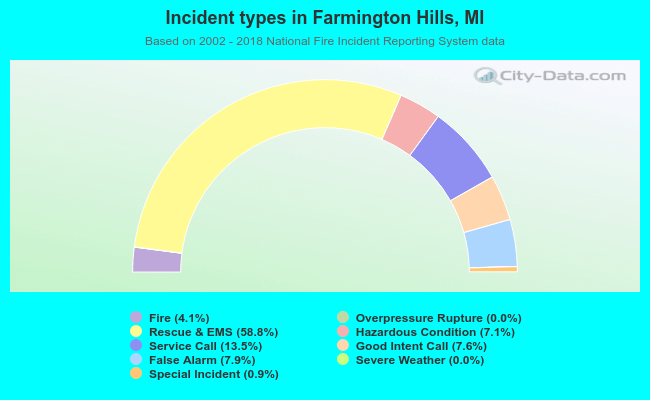 Out of all 50,458 cases reported during the years 2002 - 2018, the most belonged to the categories: Rescue & EMS (58.8%), Service Call (13.5%), and False Alarm (7.9%).
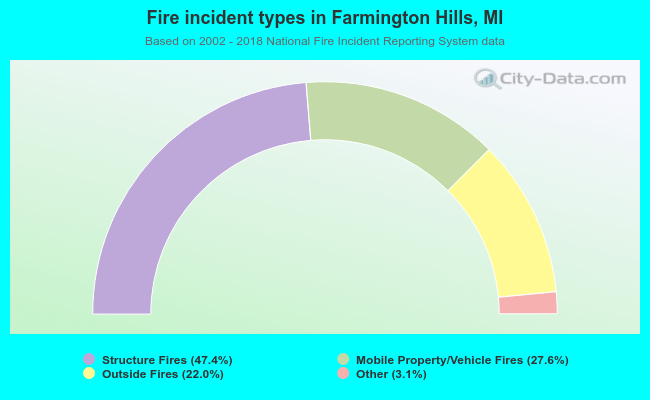 When looking into fire subcategories, the most incidents belonged to: Structure Fires (47.4%), and Mobile Property/Vehicle Fires (27.6%).