Pasadena: Fire Incidents, Texas (TX)
Where are fire incidents reported in Pasadena, TX
Something went wrong! Please refresh the page.
| Fire incidents reported | |
|---|---|
| Sreet name | Count |
| BURKE RD | 290 |
| SPENCER HWY | 288 |
| RED BLUFF RD | 270 |
| RICHEY ST | 262 |
| SHAVER ST | 182 |
| PASADENA BLVD | 160 |
| JENKINS RD | 82 |
| PRESTON AVE | 72 |
| SPENCER | 70 |
| FAIRMONT PARK | 68 |
| RICHEY | 66 |
| LAFFERTY RD | 64 |
| SPENCER HWY | 62 |
| SOUTHMORE AVE | 60 |
| FAIRMONT | 56 |
| SHAVER | 54 |
| VISTA RD | 52 |
| RED BLUFF | 50 |
| BAY AREA BLVD | 48 |
| HARRIS AVE | 44 |
| PASADENA BLVD | 44 |
| YOUNG ST | 42 |
| STRAWBERRY RD | 40 |
| PASADENA FWY | 38 |
| BELTWAY 8 HWY | 36 |
| BW 8 S FRNTG PKWY | 34 |
| SPACE CENTER BLVD | 34 |
| WITTER ST | 34 |
| FAIRMONT PKWY | 32 |
| GENOA RED BLUFF RD | 32 |
| Other | 430 |
2002 - 2018 National Fire Incident Reporting System (NFIRS) incidents
- Incident types reported to NFIRS in Pasadena, TX
- 4,50839.1%Hazardous Condition
- 3,09626.8%Fire
- 1,89316.4%False Alarm
- 8037.0%Good Intent Call
- 6365.5%Service Call
- 5004.3%Rescue & EMS
- 410.4%Overpressure Rupture
- 370.3%Special Incident
- 190.2%Severe Weather
- Fire incident types reported to NFIRS in Pasadena, TX
- 1,15937.4%Structure Fires
- 93330.1%Outside Fires
- 73423.7%Mobile Property/Vehicle Fires
- 2708.7%Other
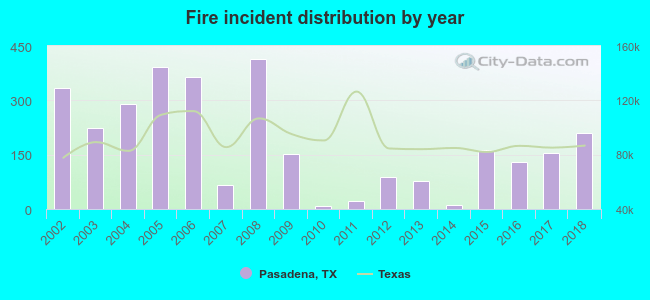 Based on the data from the years 2002 - 2018 the average number of fires per year is 182. The highest number of reported fires - 413 took place in 2008, and the least - 7 in 2010. The data has a decreasing trend.
The average number of yearly fire incidents per 10k residents in Pasadena, TX compared to nearest cities:
(Note: Based on data for the last 3 years, including only cities with population 5,000 and above)
| Pasadena: | 10.7 |
| South Houston: | 1.1 |
| Deer Park: | 13.1 |
| Galena Park: | 17.9 |
| Jacinto City: | 2.5 |
| Cloverleaf: | 0.6 |
| La Porte: | 26.5 |
| Channelview: | 55.4 |
| Webster: | 63.6 |
 The median response time based on all reported fire incidents is 7 minutes. This is close to the Texas median value.
The median response time in Pasadena, TX compared to nearest cities:
(Note: Based on data for all years, including only cities with at least 500 fire incidents)
| Pasadena: | 7 minutes |
| Deer Park: | 5 minutes |
| La Porte: | 3 minutes |
| Channelview: | 7 minutes |
| Webster: | 5 minutes |
| Pearland: | 7 minutes |
| Friendswood: | 5 minutes |
| Seabrook: | 8 minutes |
| Highlands: | 7 minutes |
 According to the reports from the years 2002 - 2018 the average number of fire-related fatalities per year is 0. The highest number of reported deaths - 2 took place in 2008, and the lowest - 0 in 2002. The data has a constant trend.
The average number of fatalities per 1,000 fire incidents is 1. This indicator was the highest - 15 in 2007, and the lowest 0 in 2002. The trend for deaths per 1,000 fires is constant. Compared to the state value the number of fatalities per 1,000 fire incidents is lower.
According to the reports from the years 2002 - 2018 the average number of fire-related fatalities per year is 0. The highest number of reported deaths - 2 took place in 2008, and the lowest - 0 in 2002. The data has a constant trend.
The average number of fatalities per 1,000 fire incidents is 1. This indicator was the highest - 15 in 2007, and the lowest 0 in 2002. The trend for deaths per 1,000 fires is constant. Compared to the state value the number of fatalities per 1,000 fire incidents is lower.Deaths per 1,000 incidents in Pasadena, TX compared to nearest cities:
(Note: Based on data for all years, including only cities with at least 2,500 fire incidents)
| Pasadena: | 1.3 |
| Channelview: | 3.8 |
| Pearland: | 1.2 |
| Baytown: | 2.5 |
| Houston: | 1.6 |
| Crosby: | 2.0 |
| Alvin: | 0.0 |
| Humble: | 2.0 |
| Missouri City: | 1.5 |
 According to the reports from the years 2002 - 2018 the average number of fire-related yearly casualties is 1. The highest number of reported casualties - 4 took place in 2015, and the lowest - 0 in 2002. The data has a growing trend.
The average number of casualties per 1,000 fire incidents is 3. This indicator was the highest - 25 in 2015, and the lowest 0 in 2002. The trend for injuries per 1,000 fire incidents is increasing. Compared to the Texas value the number of casualties per 1,000 incidents is much lower.
According to the reports from the years 2002 - 2018 the average number of fire-related yearly casualties is 1. The highest number of reported casualties - 4 took place in 2015, and the lowest - 0 in 2002. The data has a growing trend.
The average number of casualties per 1,000 fire incidents is 3. This indicator was the highest - 25 in 2015, and the lowest 0 in 2002. The trend for injuries per 1,000 fire incidents is increasing. Compared to the Texas value the number of casualties per 1,000 incidents is much lower.Casualties per 1,000 incidents in Pasadena, TX compared to nearest cities:
(Note: Based on data for all years, including only cities with at least 500 fire incidents)
| Pasadena: | 3.2 |
| Deer Park: | 9.2 |
| La Porte: | 0.0 |
| Channelview: | 7.3 |
| Webster: | 10.9 |
| Pearland: | 3.1 |
| Friendswood: | 11.9 |
| Seabrook: | 3.6 |
| Highlands: | 5.4 |
 31.9% incidents where reported in the morning and 68.1% in the evening. The most fires (17.3%) took place on Sunday, and the least (12.5%) on Wednesday.
 According to the 3,096 fire incidents from years 2002 - 2018 most fires (10.8%) took place during January, and the least (6.1%) in August.
 Out of all 11,533 cases reported during the years 2002 - 2018, the most belonged to the categories: Hazardous Condition (39.1%), Fire (26.8%), and False Alarm (16.4%).
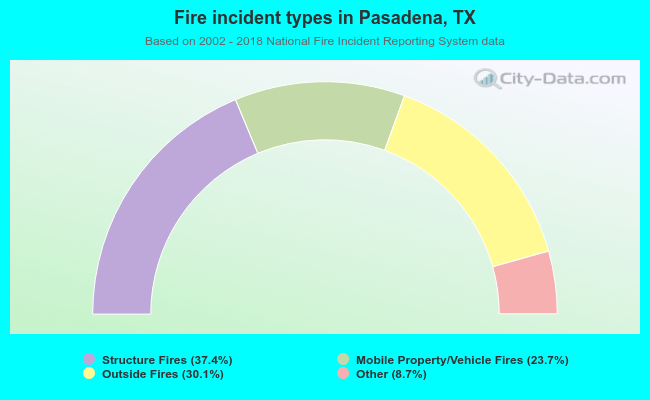 When looking into fire subcategories, the most incidents belonged to: Structure Fires (37.4%), and Outside Fires (30.1%).