Highlands: Fire Incidents, Texas (TX)
Where are fire incidents reported in Highlands, TX
Something went wrong! Please refresh the page.
| Fire incidents reported | |
|---|---|
| Sreet name | Count |
| MAIN | 84 |
| MAIN ST | 82 |
| WALLISVILLE RD | 54 |
| WALLISVILLE | 52 |
| BATTLEBELL RD | 50 |
| BATTLEBELL | 42 |
| GREENBOW LN | 42 |
| THOMPSON | 32 |
| CLEARLAKE | 30 |
| POINSETTA | 30 |
| CLEAR LAKE RD | 28 |
| FEROL | 28 |
| JONES | 28 |
| PRAIRIE | 28 |
| GRACE LN | 26 |
| WADE RD | 26 |
| HARRIS | 24 |
| HOUSTON | 24 |
| HOUSTON ST | 24 |
| MAGNOLIA | 24 |
| THOMPSON RD | 24 |
| CANAL | 22 |
| CROSBY LYNCHBURG RD | 22 |
| SAN JACINTO | 22 |
| BATTLEBELL RD | 20 |
| PIN OAK | 20 |
| AVE E | 18 |
| JONES RD | 18 |
| HIGHLANDS SHORE | 16 |
| AVENUE E | 14 |
| Other | 345 |
2004 - 2018 National Fire Incident Reporting System (NFIRS) incidents
- Incident types reported to NFIRS in Highlands, TX
- 1,50241.9%Rescue & EMS
- 1,29936.2%Fire
- 3229.0%Hazardous Condition
- 2095.8%Good Intent Call
- 1925.4%False Alarm
- 501.4%Service Call
- 70.2%Overpressure Rupture
- Fire incident types reported to NFIRS in Highlands, TX
- 70654.3%Structure Fires
- 44634.3%Outside Fires
- 1219.3%Mobile Property/Vehicle Fires
- 262.0%Other
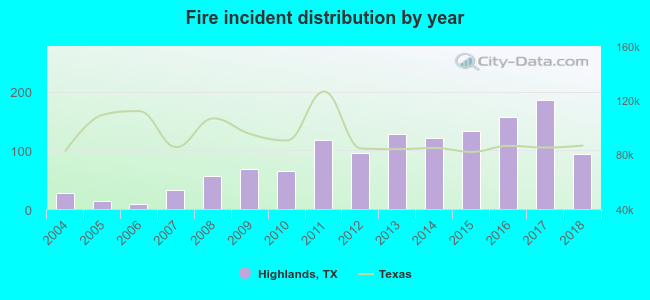 Based on the data from the years 2004 - 2018 the average number of fires per year is 87. The highest number of fires - 185 took place in 2017, and the least - 8 in 2006. The data has a rising trend.
The average number of yearly fire incidents per 10k residents in Highlands, TX compared to nearest cities:
(Note: Based on data for the last 3 years, including only cities with population 5,000 and above)
| Highlands: | 192.3 |
| Channelview: | 55.4 |
| Cloverleaf: | 0.6 |
| Baytown: | 41.1 |
| Deer Park: | 13.1 |
| La Porte: | 26.5 |
| Jacinto City: | 2.5 |
| Pasadena: | 10.7 |
| Galena Park: | 17.9 |
 The median response time based on all reported fire incidents is 7 minutes. This is about the same as the state median value.
The median response time in Highlands, TX compared to nearest cities:
(Note: Based on data for all years, including only cities with at least 500 fire incidents)
| Highlands: | 7 minutes |
| Channelview: | 7 minutes |
| Crosby: | 11 minutes |
| Baytown: | 5 minutes |
| Deer Park: | 5 minutes |
| La Porte: | 3 minutes |
| Pasadena: | 7 minutes |
| Seabrook: | 8 minutes |
| Humble: | 7 minutes |
 According to the reports from the years 2004 - 2018 the average number of fire-related yearly casualties is 0. The highest number of casualties - 2 took place in 2010, and the lowest - 0 in 2004. The data has a constant trend.
The average number of injuries per 1,000 fire incidents is 7. This indicator was the highest - 31 in 2007, and the lowest 0 in 2004. The trend for injuries per 1,000 fires is constant. Compared to the Texas value the number of injuries per 1,000 incidents is lower.
According to the reports from the years 2004 - 2018 the average number of fire-related yearly casualties is 0. The highest number of casualties - 2 took place in 2010, and the lowest - 0 in 2004. The data has a constant trend.
The average number of injuries per 1,000 fire incidents is 7. This indicator was the highest - 31 in 2007, and the lowest 0 in 2004. The trend for injuries per 1,000 fires is constant. Compared to the Texas value the number of injuries per 1,000 incidents is lower.
 31.6% incidents where reported in the morning and 68.4% in the evening. The most fires (16.6%) took place on Saturday, and the least (12.2%) on Tuesday.
 Based on the 1,299 reports from years 2004 - 2018 most fires (10.7%) took place during January, and the least (7.4%) in February.
 Out of all 3,585 cases reported during the years 2004 - 2018, the most belonged to the categories: Rescue & EMS (41.9%), Fire (36.2%), and Hazardous Condition (9.0%).
 When looking into fire subcategories, the most reports belonged to: Structure Fires (54.3%), and Outside Fires (34.3%).