Ormond Beach: Fire Incidents, Florida (FL)
Where are fire incidents reported in Ormond Beach, FL
Something went wrong! Please refresh the page.
| Fire incidents reported | |
|---|---|
| Sreet name | Count |
| GRANADA BLVD | 334 |
| NOVA RD | 262 |
| I95 | 206 |
| US HWY 1 | 192 |
| OCEAN SHORE BLVD | 140 |
| YONGE ST | 124 |
| BEACH ST | 100 |
| US 1 HWY | 100 |
| I 95 | 86 |
| AIRPORT RD | 82 |
| ATLANTIC AVE | 80 |
| I-95 | 78 |
| JOHN ANDERSON DR | 78 |
| SR 40 | 70 |
| ATLANTIC AV | 64 |
| HAND AV | 56 |
| GRANADA | 54 |
| TYMBER CREEK RD | 54 |
| CLYDE MORRIS BLVD | 52 |
| ORCHARD ST | 52 |
| RODEO RD | 50 |
| WILLIAMSON BLVD | 46 |
| SHADOW LAKES BLVD | 42 |
| WOODCREST DR | 40 |
| HAND AVE | 38 |
| NOVA | 38 |
| OLD KINGS RD | 36 |
| SAN MARCO DR | 30 |
| TOWER CIR | 30 |
| US 1 | 30 |
| Other | 887 |
2002 - 2018 National Fire Incident Reporting System (NFIRS) incidents
- Incident types reported to NFIRS in Ormond Beach, FL
- 34,74457.5%Rescue & EMS
- 9,28415.4%Good Intent Call
- 6,79911.2%Service Call
- 3,6316.0%Hazardous Condition
- 3,5315.8%Fire
- 2,3773.9%False Alarm
- Fire incident types reported to NFIRS in Ormond Beach, FL
- 1,64246.5%Outside Fires
- 1,12131.7%Structure Fires
- 59816.9%Mobile Property/Vehicle Fires
- 1704.8%Other
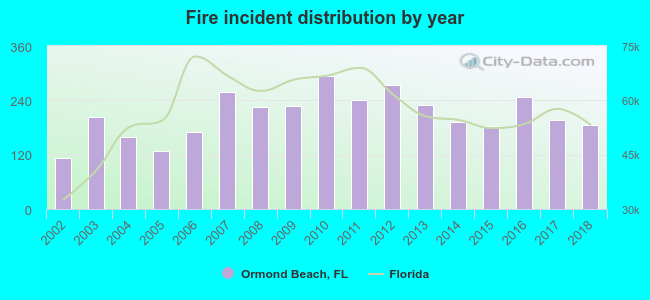 According to the data from the years 2002 - 2018 the average number of fire incidents per year is 208. The highest number of fires - 293 took place in 2010, and the least - 112 in 2002. The data has an increasing trend.
The average number of yearly fire incidents per 10k residents in Ormond Beach, FL compared to nearest cities:
(Note: Based on data for the last 3 years, including only cities with population 5,000 and above)
| Ormond Beach: | 53.8 |
| Holly Hill: | 49.3 |
| Daytona Beach: | 60.0 |
| South Daytona: | 8.3 |
| Port Orange: | 22.2 |
| Palm Coast: | 25.2 |
| New Smyrna Beach: | 81.6 |
| Edgewater: | 35.8 |
| Orange City: | 114.3 |
 The median response time based on all reported fire incidents is 6 minutes. This is similar to the state median value.
The median response time in Ormond Beach, FL compared to nearest cities:
(Note: Based on data for all years, including only cities with at least 500 fire incidents)
| Ormond Beach: | 6 minutes |
| Holly Hill: | 5 minutes |
| Daytona Beach: | 5 minutes |
| Port Orange: | 6 minutes |
| Bunnell: | 12 minutes |
| Palm Coast: | 6 minutes |
| New Smyrna Beach: | 6 minutes |
| Edgewater: | 5 minutes |
| Orange City: | 5 minutes |
 Based on the reports from the years 2002 - 2018 the average number of fire-related fatalities per year is 0. The highest number of reported deaths - 2 took place in 2003, and the lowest - 0 in 2002. The data has an increasing trend.
The average number of deaths per 1,000 fires is 2. This indicator was the highest - 10 in 2003, and the lowest 0 in 2002. The trend for fatalities per 1,000 fires is growing. Compared to the state value the number of deaths per 1,000 incidents is higher.
Based on the reports from the years 2002 - 2018 the average number of fire-related fatalities per year is 0. The highest number of reported deaths - 2 took place in 2003, and the lowest - 0 in 2002. The data has an increasing trend.
The average number of deaths per 1,000 fires is 2. This indicator was the highest - 10 in 2003, and the lowest 0 in 2002. The trend for fatalities per 1,000 fires is growing. Compared to the state value the number of deaths per 1,000 incidents is higher.Deaths per 1,000 incidents in Ormond Beach, FL compared to nearest cities:
(Note: Based on data for all years, including only cities with at least 2,500 fire incidents)
| Ormond Beach: | 2.3 |
| Daytona Beach: | 2.4 |
| Palm Coast: | 3.1 |
| Deltona: | 0.8 |
| Sanford: | 2.3 |
| Palatka: | 1.1 |
| St. Augustine: | 2.3 |
| Apopka: | 2.5 |
 According to the data from the years 2002 - 2018 the average number of fire-related yearly casualties is 2. The highest number of casualties - 8 took place in 2014, and the lowest - 0 in 2002. The data has a constant trend.
The average number of casualties per 1,000 fire incidents is 10. This indicator was the highest - 42 in 2014, and the lowest 0 in 2002. The trend for casualties per 1,000 fires is increasing. Compared to the Florida value the number of casualties per 1,000 incidents is lower.
According to the data from the years 2002 - 2018 the average number of fire-related yearly casualties is 2. The highest number of casualties - 8 took place in 2014, and the lowest - 0 in 2002. The data has a constant trend.
The average number of casualties per 1,000 fire incidents is 10. This indicator was the highest - 42 in 2014, and the lowest 0 in 2002. The trend for casualties per 1,000 fires is increasing. Compared to the Florida value the number of casualties per 1,000 incidents is lower.Casualties per 1,000 incidents in Ormond Beach, FL compared to nearest cities:
(Note: Based on data for all years, including only cities with at least 500 fire incidents)
| Ormond Beach: | 9.9 |
| Holly Hill: | 16.9 |
| Daytona Beach: | 23.2 |
| Port Orange: | 23.4 |
| Bunnell: | 1.9 |
| Palm Coast: | 8.4 |
| New Smyrna Beach: | 12.0 |
| Edgewater: | 29.5 |
| Orange City: | 11.2 |
 31.5% incidents where reported in the morning and 68.5% in the evening. The most fires (15.5%) took place on Saturday, and the least (13.2%) on Thursday.
 According to the 3,531 incident reports from years 2002 - 2018 most fires (10.4%) took place during March, and the least (6.7%) in September.
 Out of all 60,466 cases reported during the years 2002 - 2018, the most belonged to the categories: Rescue & EMS (57.5%), Good Intent Call (15.4%), and Service Call (11.2%).
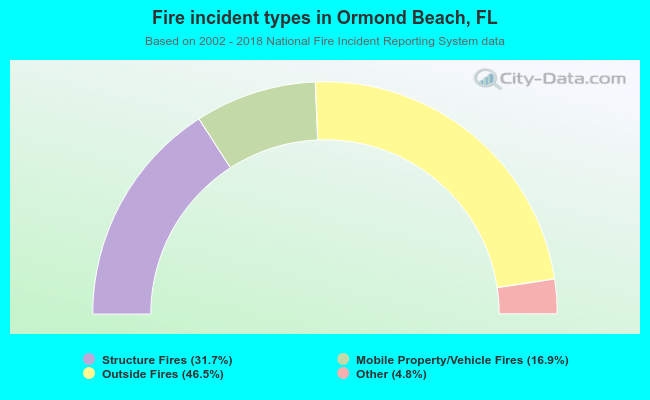 When looking into fire subcategories, the most reports belonged to: Outside Fires (46.5%), and Structure Fires (31.7%).