New Smyrna Beach: Fire Incidents, Florida (FL)
Where are fire incidents reported in New Smyrna Beach, FL
Something went wrong! Please refresh the page.
| Fire incidents reported | |
|---|---|
| Sreet name | Count |
| SR 44 | 392 |
| SR 415 | 130 |
| ATLANTIC AVE | 120 |
| PIONEER | 106 |
| PIONEER TR | 106 |
| DIXIE FRWY | 94 |
| DIXIE FREEWAY | 82 |
| ATLANTIC AV | 80 |
| TURNBULL BAY RD | 76 |
| HUNTING CAMP RD | 74 |
| CANAL ST | 72 |
| RANCHETTE RD | 70 |
| GLENCOE RD | 66 |
| 10TH ST | 58 |
| I95 | 56 |
| PIONEER TRL | 56 |
| MYRTLE AVE | 54 |
| ATLANTIC | 52 |
| CAUSEWAY | 52 |
| SAXON DR | 52 |
| CR 415 | 50 |
| I-95 | 44 |
| SAMSULA DR | 42 |
| DIXIE FWY | 40 |
| OLD MISSION RD | 38 |
| WILLIAMS RD | 36 |
| RIVERSIDE DR | 34 |
| ELIZABETH ST | 30 |
| HILL ST | 30 |
| PALMETTO ST | 30 |
| Other | 268 |
2002 - 2018 National Fire Incident Reporting System (NFIRS) incidents
- Incident types reported to NFIRS in New Smyrna Beach, FL
- 19,45454.2%Rescue & EMS
- 5,12314.3%Good Intent Call
- 4,50412.5%Service Call
- 2,4906.9%Fire
- 2,1786.1%Hazardous Condition
- 1,8765.2%False Alarm
- 2470.7%Special Incident
- Fire incident types reported to NFIRS in New Smyrna Beach, FL
- 1,36354.7%Outside Fires
- 66826.8%Structure Fires
- 36014.5%Mobile Property/Vehicle Fires
- 994.0%Other
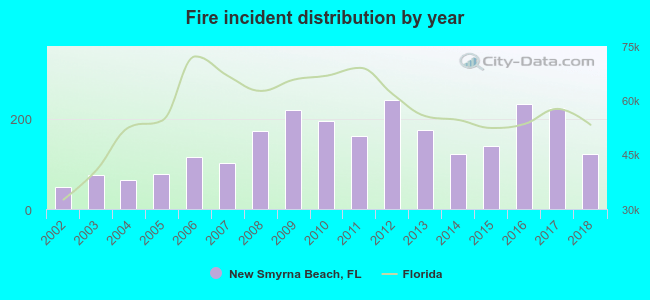 According to the data from the years 2002 - 2018 the average number of fires per year is 146. The highest number of reported fire incidents - 241 took place in 2012, and the least - 49 in 2002. The data has a rising trend.
The average number of yearly fire incidents per 10k residents in New Smyrna Beach, FL compared to nearest cities:
(Note: Based on data for the last 3 years, including only cities with population 5,000 and above)
| New Smyrna Beach: | 81.6 |
| Edgewater: | 35.8 |
| Port Orange: | 22.2 |
| South Daytona: | 8.3 |
| Daytona Beach: | 60.0 |
| Holly Hill: | 49.3 |
| Deltona: | 25.0 |
| Ormond Beach: | 53.8 |
| Orange City: | 114.3 |
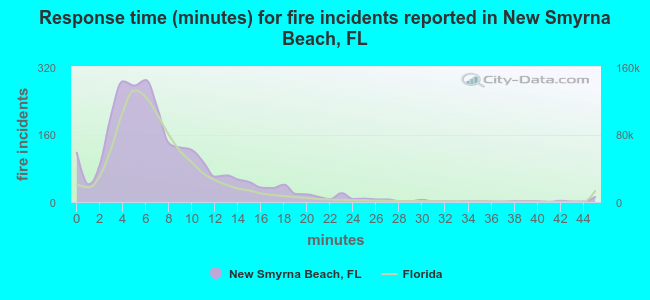 The median response time based on all reported fire incidents is 6 minutes. This is about the same as the state median value.
The median response time in New Smyrna Beach, FL compared to nearest cities:
(Note: Based on data for all years, including only cities with at least 500 fire incidents)
| New Smyrna Beach: | 6 minutes |
| Edgewater: | 5 minutes |
| Port Orange: | 6 minutes |
| Daytona Beach: | 5 minutes |
| Holly Hill: | 5 minutes |
| Deltona: | 6 minutes |
| Ormond Beach: | 6 minutes |
| Orange City: | 5 minutes |
| Geneva: | 8 minutes |
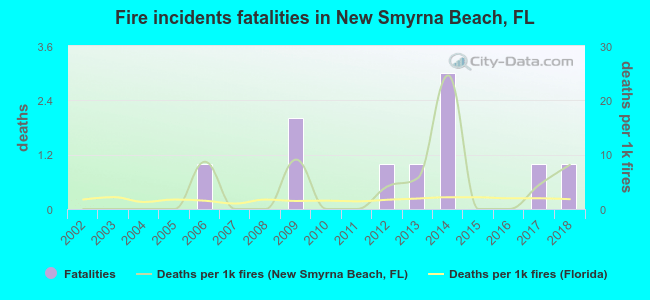 Based on the reports from the years 2002 - 2018 the average number of fire-related yearly deaths is 1. The highest number of reported deaths - 3 took place in 2014, and the lowest - 0 in 2002. The data has a growing trend.
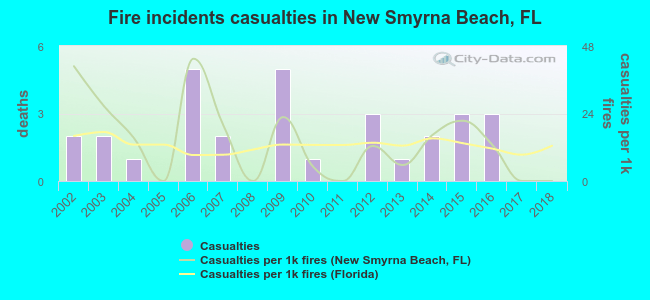 Based on the reports from the years 2002 - 2018 the average number of fire-related casualties per year is 2. The highest number of casualties - 5 took place in 2006, and the lowest - 0 in 2005. The data has a declining trend.
The average number of injuries per 1,000 fire incidents is 14. This indicator was the highest - 43 in 2006, and the lowest 0 in 2005. The trend for casualties per 1,000 fires is declining. Compared to the state value the number of injuries per 1,000 fire incidents is similar.
Based on the reports from the years 2002 - 2018 the average number of fire-related casualties per year is 2. The highest number of casualties - 5 took place in 2006, and the lowest - 0 in 2005. The data has a declining trend.
The average number of injuries per 1,000 fire incidents is 14. This indicator was the highest - 43 in 2006, and the lowest 0 in 2005. The trend for casualties per 1,000 fires is declining. Compared to the state value the number of injuries per 1,000 fire incidents is similar.Casualties per 1,000 incidents in New Smyrna Beach, FL compared to nearest cities:
(Note: Based on data for all years, including only cities with at least 500 fire incidents)
| New Smyrna Beach: | 12.0 |
| Edgewater: | 29.5 |
| Port Orange: | 23.4 |
| Daytona Beach: | 23.2 |
| Holly Hill: | 16.9 |
| Deltona: | 33.1 |
| Ormond Beach: | 9.9 |
| Orange City: | 11.2 |
| Geneva: | 20.3 |
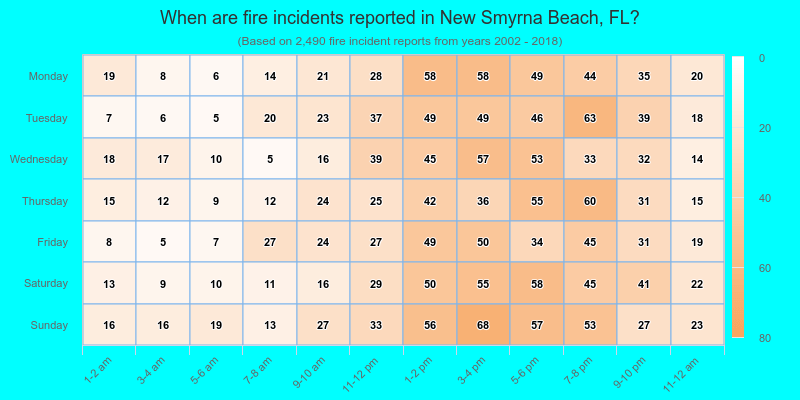
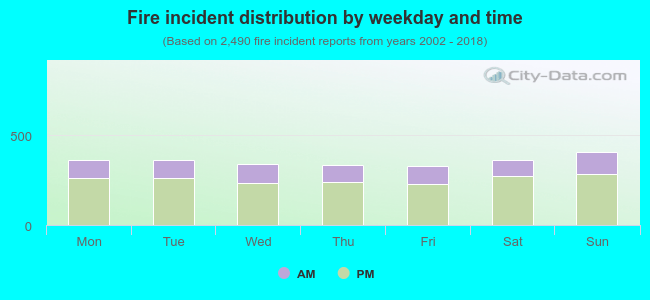 28.4% incidents where reported in the morning and 71.6% in the evening. The most fires (16.4%) took place on Sunday, and the least (13.1%) on Friday.
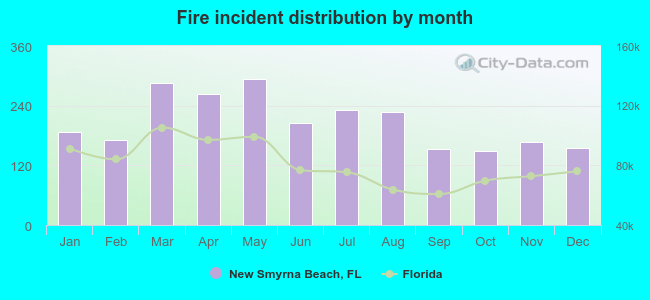 According to the 2,490 fire incident reports from years 2002 - 2018 most fires (11.8%) took place during May, and the least (5.9%) in October.
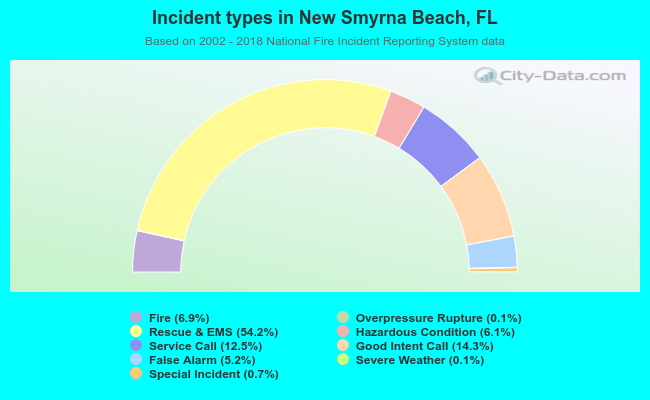 Out of all 35,921 cases reported during the years 2002 - 2018, the most belonged to the categories: Rescue & EMS (54.2%), Good Intent Call (14.3%), and Service Call (12.5%).
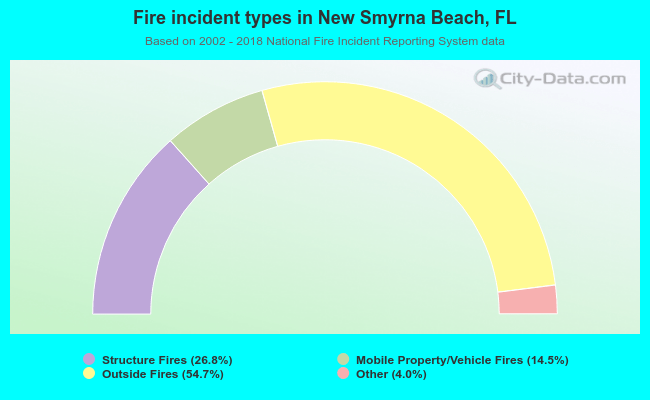 When looking into fire subcategories, the most incidents belonged to: Outside Fires (54.7%), and Structure Fires (26.8%).