Greenfield: Fire Incidents, Massachusetts (MA)
Where are fire incidents reported in Greenfield, MA
Something went wrong! Please refresh the page.
| Fire incidents reported | |
|---|---|
| Sreet name | Count |
| MAIN ST | 162 |
| HIGH ST | 138 |
| FEDERAL ST | 136 |
| DEERFIELD ST | 126 |
| WELLS ST | 104 |
| CONWAY ST | 94 |
| CHAPMAN ST | 88 |
| ELM ST | 80 |
| LEYDEN RD | 80 |
| DAVIS ST | 74 |
| HOPE ST | 72 |
| MOHAWK TRL | 72 |
| BERNARDSTON RD | 64 |
| COUNTRY CLUB RD | 56 |
| COLRAIN RD | 46 |
| INTERSTATE 91 HWY | 42 |
| FRANKLIN ST | 40 |
| SANDERSON ST | 40 |
| SILVER ST | 40 |
| CONGRESS ST | 38 |
| LAUREL ST | 36 |
| WISDOM WAY | 34 |
| SHELBURNE RD | 28 |
| TURNERS FALLS RD | 28 |
| ADAMS RD | 26 |
| PIERCE ST | 26 |
| RIVER ST | 26 |
| BRADFORD DR | 24 |
| JAMES ST | 24 |
| MAPLE ST | 24 |
2002 - 2018 National Fire Incident Reporting System (NFIRS) incidents
- Incident types reported to NFIRS in Greenfield, MA
- 6,25839.4%Rescue & EMS
- 3,50022.1%Hazardous Condition
- 1,85211.7%Fire
- 1,76511.1%False Alarm
- 1,2437.8%Good Intent Call
- 1,1587.3%Service Call
- 350.2%Special Incident
- 310.2%Severe Weather
- 260.2%Overpressure Rupture
- Fire incident types reported to NFIRS in Greenfield, MA
- 1,03756.0%Structure Fires
- 54629.5%Outside Fires
- 1689.1%Mobile Property/Vehicle Fires
- 1015.5%Other
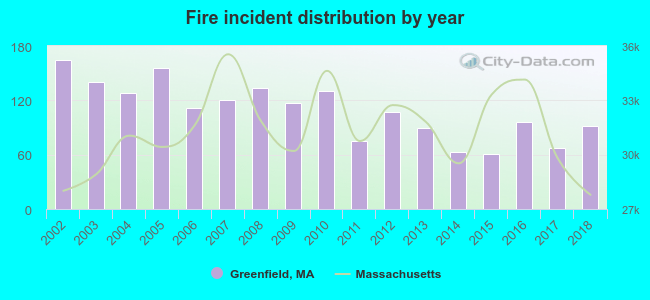 Based on the data from the years 2002 - 2018 the average number of fire incidents per year is 109. The highest number of reported fires - 165 took place in 2002, and the least - 61 in 2015. The data has a dropping trend.
The average number of yearly fire incidents per 10k residents in Greenfield, MA compared to nearest cities:
(Note: Based on data for the last 3 years, including only cities with population 5,000 and above)
| Greenfield: | 61.7 |
| Montague: | 5.9 |
| Deerfield: | 20.2 |
| Amherst: | 19.9 |
| Hadley: | 23.5 |
| Northampton: | 16.5 |
| Athol: | 76.2 |
| Easthampton: | 27.6 |
| South Hadley: | 42.3 |
 The median response time based on all reported fire incidents is 5 minutes. This is higher compared to the state median value.
The median response time in Greenfield, MA compared to nearest cities:
(Note: Based on data for all years, including only cities with at least 500 fire incidents)
| Greenfield: | 5 minutes |
| Turners Falls: | 5 minutes |
| Orange: | 7 minutes |
| Amherst: | 6 minutes |
| Northampton: | 6 minutes |
| Athol: | 5 minutes |
| Easthampton: | 6 minutes |
| Belchertown: | 10 minutes |
| South Hadley: | 4 minutes |
 According to the data from the years 2002 - 2018 the average number of fire-related fatalities per year is 0. The highest number of deaths - 4 took place in 2016, and the lowest - 0 in 2002. The data has a constant trend.
 According to the data from the years 2002 - 2018 the average number of fire-related yearly casualties is 2. The highest number of reported injuries - 6 took place in 2016, and the lowest - 0 in 2009. The data has a dropping trend.
The average number of injuries per 1,000 fire incidents is 15. This indicator was the highest - 63 in 2016, and the lowest 0 in 2009. The trend for injuries per 1,000 fire incidents is dropping. Compared to the state value the number of casualties per 1,000 fires is higher.
According to the data from the years 2002 - 2018 the average number of fire-related yearly casualties is 2. The highest number of reported injuries - 6 took place in 2016, and the lowest - 0 in 2009. The data has a dropping trend.
The average number of injuries per 1,000 fire incidents is 15. This indicator was the highest - 63 in 2016, and the lowest 0 in 2009. The trend for injuries per 1,000 fire incidents is dropping. Compared to the state value the number of casualties per 1,000 fires is higher.Casualties per 1,000 incidents in Greenfield, MA compared to nearest cities:
(Note: Based on data for all years, including only cities with at least 500 fire incidents)
| Greenfield: | 15.7 |
| Turners Falls: | 12.5 |
| Orange: | 12.2 |
| Amherst: | 27.6 |
| Northampton: | 22.1 |
| Athol: | 16.3 |
| Easthampton: | 17.3 |
| Belchertown: | 0.0 |
| South Hadley: | 11.2 |
 30.9% incidents where reported in the morning and 69.1% in the evening. The most fires (17.8%) took place on Saturday, and the least (11.4%) on Thursday.
 According to the 1,852 fire incidents from years 2002 - 2018 most fires (12.5%) took place during April, and the least (6.0%) in December.
 Out of all 15,868 cases reported during the years 2002 - 2018, the most belonged to the categories: Rescue & EMS (39.4%), Hazardous Condition (22.1%), and Fire (11.7%).
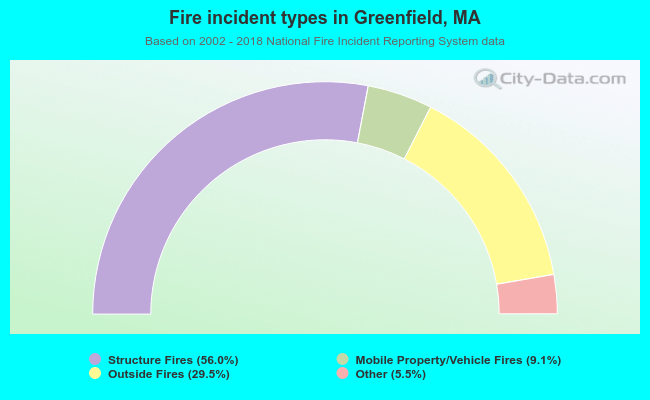 When looking into fire subcategories, the most incidents belonged to: Structure Fires (56.0%), and Outside Fires (29.5%).