South Hadley: Fire Incidents, Massachusetts (MA)
Where are fire incidents reported in South Hadley, MA
Something went wrong! Please refresh the page.
| Fire incidents reported | |
|---|---|
| Sreet name | Count |
| COLLEGE ST | 462 |
| WOODBRIDGE ST | 78 |
| HADLEY ST | 62 |
| AMHERST RD | 30 |
| NEWTON ST | 30 |
| LATHROP ST | 28 |
| MORGAN ST | 28 |
| DUNLOP PL | 24 |
| GRANBY RD | 20 |
| LATHROP ST | 20 |
| GRANBY ROAD | 18 |
| BAYON DRIVE | 16 |
| MAIN ST | 16 |
| ALVORD ST | 14 |
| BAYON DR | 14 |
| EAST ST | 14 |
| PEARL ST | 14 |
| THE KNOLLS | 14 |
| BRIDGE ST | 12 |
| EAST PARKVIEW ST | 12 |
| FERRY ST | 12 |
| MOSIER ST | 12 |
| RIVERBOAT VILLAGE RD | 12 |
| SILVER ST | 12 |
| CANAL ST | 10 |
| MAIN STREET | 10 |
| NEWTON ST | 10 |
| ASHFIELD LN | 8 |
| BAYON DR | 8 |
| CANAL STREET | 8 |
2002 - 2018 National Fire Incident Reporting System (NFIRS) incidents
- Incident types reported to NFIRS in South Hadley, MA
- 1,62429.1%Rescue & EMS
- 97817.5%Fire
- 95717.1%Service Call
- 86015.4%False Alarm
- 73713.2%Hazardous Condition
- 3756.7%Good Intent Call
- 420.8%Special Incident
- 90.2%Severe Weather
- 80.1%Overpressure Rupture
- Fire incident types reported to NFIRS in South Hadley, MA
- 66868.3%Structure Fires
- 20721.2%Outside Fires
- 545.5%Mobile Property/Vehicle Fires
- 495.0%Other
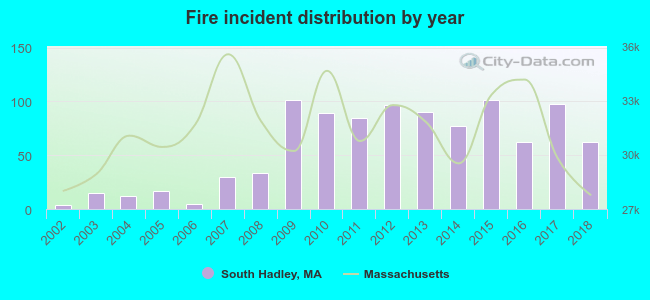 According to the data from the years 2002 - 2018 the average number of fires per year is 58. The highest number of reported fire incidents - 101 took place in 2009, and the least - 4 in 2002. The data has a rising trend.
The average number of yearly fire incidents per 10k residents in South Hadley, MA compared to nearest cities:
(Note: Based on data for the last 3 years, including only cities with population 5,000 and above)
| South Hadley: | 42.3 |
| Holyoke: | 90.1 |
| Chicopee: | 33.0 |
| Easthampton: | 27.6 |
| Ludlow: | 30.6 |
| Northampton: | 16.5 |
| Southampton: | 41.4 |
| Hadley: | 23.5 |
| Springfield: | 37.6 |
 The median response time based on all reported fire incidents is 4 minutes. This is close to the state median value.
The median response time in South Hadley, MA compared to nearest cities:
(Note: Based on data for all years, including only cities with at least 500 fire incidents)
| South Hadley: | 4 minutes |
| Holyoke: | 4 minutes |
| Chicopee: | 4 minutes |
| Easthampton: | 6 minutes |
| Ludlow: | 4 minutes |
| Northampton: | 6 minutes |
| Springfield: | 3 minutes |
| West Springfield: | 3 minutes |
| Belchertown: | 10 minutes |
 Based on the reports from the years 2002 - 2018 the average number of fire-related yearly casualties is 1. The highest number of casualties - 3 took place in 2015, and the lowest - 0 in 2002. The data has a constant trend.
The average number of casualties per 1,000 fires is 15. This indicator was the highest - 83 in 2004, and the lowest 0 in 2002. The trend for casualties per 1,000 fire incidents is constant. Compared to the Massachusetts value the number of casualties per 1,000 incidents is similar.
Based on the reports from the years 2002 - 2018 the average number of fire-related yearly casualties is 1. The highest number of casualties - 3 took place in 2015, and the lowest - 0 in 2002. The data has a constant trend.
The average number of casualties per 1,000 fires is 15. This indicator was the highest - 83 in 2004, and the lowest 0 in 2002. The trend for casualties per 1,000 fire incidents is constant. Compared to the Massachusetts value the number of casualties per 1,000 incidents is similar.Casualties per 1,000 incidents in South Hadley, MA compared to nearest cities:
(Note: Based on data for all years, including only cities with at least 500 fire incidents)
| South Hadley: | 11.2 |
| Holyoke: | 8.8 |
| Chicopee: | 30.2 |
| Easthampton: | 17.3 |
| Ludlow: | 22.3 |
| Northampton: | 22.1 |
| Springfield: | 12.5 |
| West Springfield: | 23.9 |
| Belchertown: | 0.0 |
 30.8% incidents where reported in the morning and 69.2% in the evening. The most fires (18.2%) took place on Saturday, and the least (12.8%) on Tuesday.
 Based on the 978 fire incidents from years 2002 - 2018 most fires (13.1%) took place during April, and the least (5.3%) in July.
 Out of all 5,590 cases reported during the years 2002 - 2018, the most belonged to the categories: Rescue & EMS (29.1%), Fire (17.5%), and Service Call (17.1%).
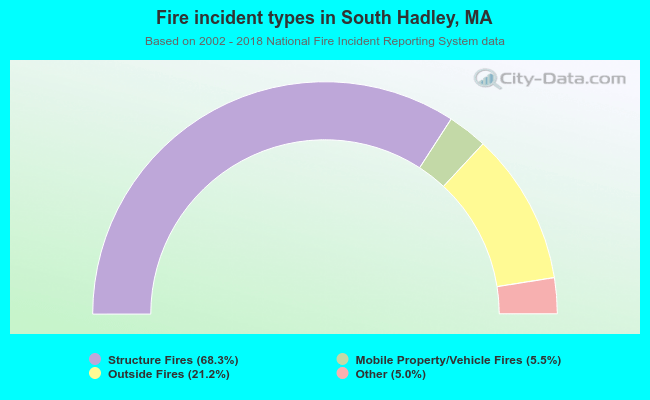 When looking into fire subcategories, the most reports belonged to: Structure Fires (68.3%), and Outside Fires (21.2%).