Graham: Fire Incidents, Washington (WA)
Where are fire incidents reported in Graham, WA
Something went wrong! Please refresh the page.
| Fire incidents reported | |
|---|---|
| Sreet name | Count |
| 224TH ST | 144 |
| MERIDIAN | 82 |
| 304TH ST | 74 |
| MERIDIAN AV | 74 |
| 288TH ST | 66 |
| ORVILLE RD | 58 |
| WEBSTER RD | 58 |
| MERIDIAN AVE | 50 |
| ORTING KAPOWSIN HWY | 46 |
| 264TH ST | 40 |
| EUSTIS HUNT RD | 38 |
| 200TH ST | 32 |
| 232ND ST | 32 |
| MOUNTAIN HW | 30 |
| 204TH ST | 28 |
| 260TH ST | 28 |
| 245TH ST | 26 |
| ORTING KAPOWSIN HW | 26 |
| 176TH ST | 22 |
| 213TH ST | 22 |
| KAPOWSIN HW | 22 |
| MERIDIAN ST | 22 |
| 229TH ST | 20 |
| 252ND ST | 20 |
| 254TH ST | 20 |
| 277TH ST | 20 |
| 296TH ST | 20 |
| 54TH AV | 20 |
| 70TH AVE | 20 |
| MATHIAS RD | 20 |
| Other | 582 |
2002 - 2018 National Fire Incident Reporting System (NFIRS) incidents
- Incident types reported to NFIRS in Graham, WA
- 11,13956.6%Rescue & EMS
- 2,82814.4%Service Call
- 2,09410.6%Good Intent Call
- 1,7628.9%Fire
- 1,3026.6%Hazardous Condition
- 5112.6%False Alarm
- 410.2%Special Incident
- Fire incident types reported to NFIRS in Graham, WA
- 88650.3%Structure Fires
- 53430.3%Outside Fires
- 27215.4%Mobile Property/Vehicle Fires
- 704.0%Other
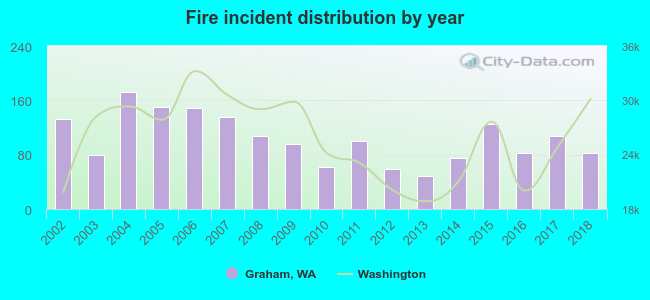 According to the data from the years 2002 - 2018 the average number of fires per year is 104. The highest number of fires - 173 took place in 2004, and the least - 48 in 2013. The data has a dropping trend.
The average number of yearly fire incidents per 10k residents in Graham, WA compared to nearest cities:
(Note: Based on data for the last 3 years, including only cities with population 5,000 and above)
| Graham: | 38.6 |
| Orting: | 91.8 |
| South Hill: | 26.4 |
| Spanaway: | 42.1 |
| Puyallup: | 47.5 |
| Parkland: | 53.9 |
| Bonney Lake: | 67.3 |
| Sumner: | 73.0 |
| Edgewood: | 24.6 |
 The median response time based on all reported fire incidents is 9 minutes. This is higher than the state median value.
The median response time in Graham, WA compared to nearest cities:
(Note: Based on data for all years, including only cities with at least 500 fire incidents)
| Graham: | 9 minutes |
| Orting: | 7 minutes |
| Spanaway: | 7 minutes |
| Puyallup: | 7 minutes |
| Parkland: | 6 minutes |
| Bonney Lake: | 8 minutes |
| Sumner: | 8 minutes |
| Eatonville: | 12 minutes |
| Roy: | 13 minutes |
 32.7% incidents where reported in the morning and 67.3% in the evening. The most fires (16.6%) took place on Sunday, and the least (12.9%) on Wednesday.
 Based on the 1,762 fire incident reports from years 2002 - 2018 most fires (17.4%) took place during July, and the least (5.8%) in March.
 Out of all 19,693 cases reported during the years 2002 - 2018, the most belonged to the categories: Rescue & EMS (56.6%), Service Call (14.4%), and Good Intent Call (10.6%).
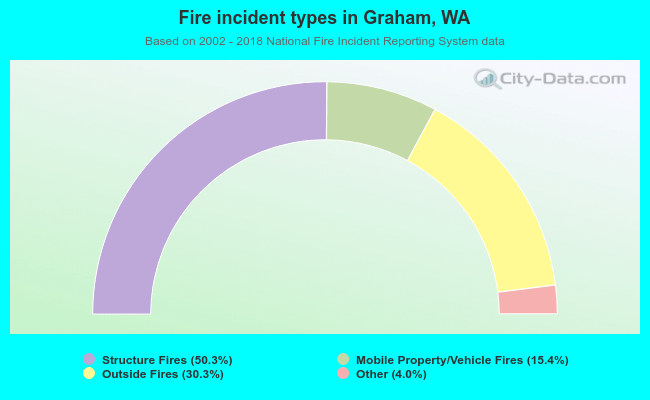 When looking into fire subcategories, the most incidents belonged to: Structure Fires (50.3%), and Outside Fires (30.3%).