Citrus Springs: Fire Incidents, Florida (FL)
Where are fire incidents reported in Citrus Springs, FL
Something went wrong! Please refresh the page.
|
| |||||||||||||||||||||||||||||||||||||||||||||||||||||||||||||||||||||||||||||||||||||||||||||||||||||||||||||
2003 - 2017 National Fire Incident Reporting System (NFIRS) incidents
- Incident types reported to NFIRS in Citrus Springs, FL
- 17532.8%Fire
- 11822.1%Service Call
- 11120.8%Rescue & EMS
- 8015.0%Hazardous Condition
- 346.4%Good Intent Call
- 142.6%False Alarm
- 10.2%Overpressure Rupture
- Fire incident types reported to NFIRS in Citrus Springs, FL
- 11465.1%Outside Fires
- 3318.9%Structure Fires
- 169.1%Other
- 126.9%Mobile Property/Vehicle Fires
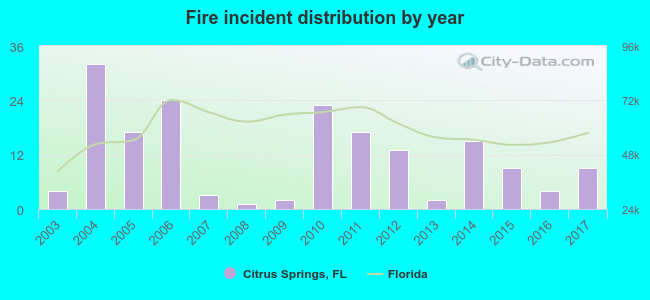 According to the data from the years 2003 - 2017 the average number of fires per year is 12. The highest number of fires - 32 took place in 2004, and the least - 1 in 2008. The data has a rising trend.
The average number of yearly fire incidents per 10k residents in Citrus Springs, FL compared to nearest cities:
(Note: Based on data for the last 3 years, including only cities with population 5,000 and above)
| Citrus Springs: | 7.5 |
| Beverly Hills: | 30.0 |
| Hernando: | 43.4 |
| Lecanto: | 60.1 |
| Inverness: | 81.9 |
| Floral City: | 33.2 |
| Ocala: | 141.4 |
| Wildwood: | 141.6 |
| The Villages: | 6.6 |

 21.7% incidents where reported in the morning and 78.3% in the evening. The most fires (17.7%) took place on Sunday, and the least (11.4%) on Tuesday.
 According to the 175 reports from years 2003 - 2017 most fires (14.3%) took place during May, and the least (2.3%) in October.
 Out of all 533 cases reported during the years 2003 - 2017, the most belonged to the categories: Fire (32.8%), Service Call (22.1%), and Rescue & EMS (20.8%).
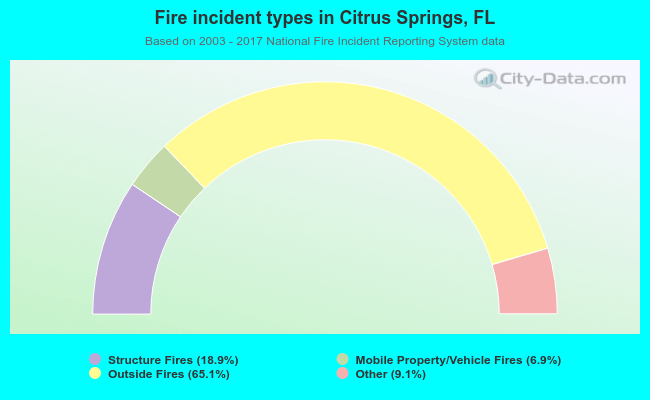 When looking into fire subcategories, the most incidents belonged to: Outside Fires (65.1%), and Structure Fires (18.9%).