Beverly Hills: Fire Incidents, Florida (FL)
Where are fire incidents reported in Beverly Hills, FL
Something went wrong! Please refresh the page.
|
| |||||||||||||||||||||||||||||||||||||||||||||||||||||||||||||||||||||||||||||||||||||||||||||||||||||||||||||
2003 - 2018 National Fire Incident Reporting System (NFIRS) incidents
- Incident types reported to NFIRS in Beverly Hills, FL
- 2,07146.4%Rescue & EMS
- 76017.0%Good Intent Call
- 53211.9%Service Call
- 48010.8%Fire
- 46610.4%Hazardous Condition
- 1302.9%False Alarm
- 170.4%Severe Weather
- Fire incident types reported to NFIRS in Beverly Hills, FL
- 25152.3%Outside Fires
- 12726.5%Structure Fires
- 5611.7%Mobile Property/Vehicle Fires
- 469.6%Other
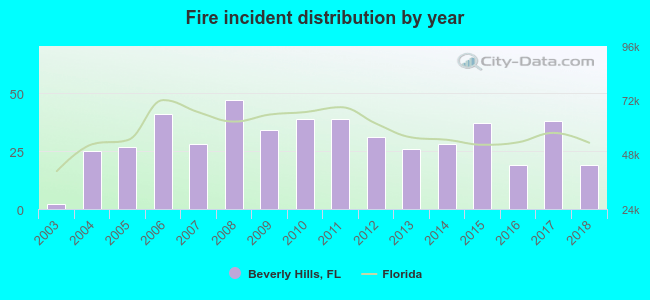 According to the data from the years 2003 - 2018 the average number of fires per year is 30. The highest number of fire incidents - 47 took place in 2008, and the least - 2 in 2003. The data has an increasing trend.
The average number of yearly fire incidents per 10k residents in Beverly Hills, FL compared to nearest cities:
(Note: Based on data for the last 3 years, including only cities with population 5,000 and above)
| Beverly Hills: | 30.0 |
| Lecanto: | 60.1 |
| Hernando: | 43.4 |
| Citrus Springs: | 7.5 |
| Inverness: | 81.9 |
| Floral City: | 33.2 |
| Brooksville: | 246.9 |
| Wildwood: | 141.6 |
| Ocala: | 141.4 |

 Based on the reports from the years 2003 - 2018 the average number of fire-related yearly casualties is 0. The highest number of injuries - 2 took place in 2010, and the lowest - 0 in 2003. The data has a growing trend.
 25.6% incidents where reported in the morning and 74.4% in the evening. The most fires (17.3%) took place on Thursday, and the least (11.9%) on Tuesday.
 Based on the 480 incident reports from years 2003 - 2018 most fires (12.1%) took place during May, and the least (4.0%) in October.
 Out of all 4,462 cases reported during the years 2003 - 2018, the most belonged to the categories: Rescue & EMS (46.4%), Good Intent Call (17.0%), and Service Call (11.9%).
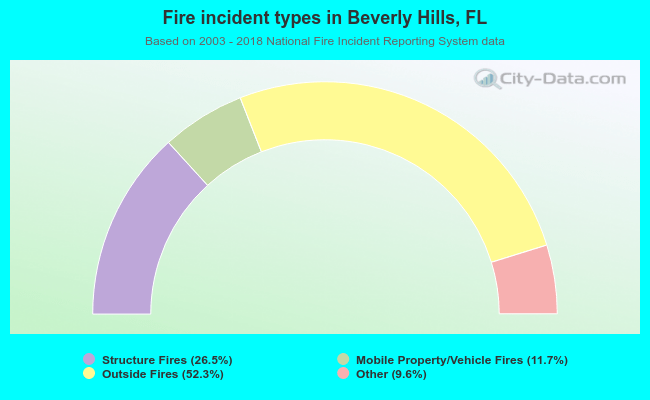 When looking into fire subcategories, the most reports belonged to: Outside Fires (52.3%), and Structure Fires (26.5%).