Estimated zip code population in 2022: 11,755 Zip code population in 2010: 11,261 Zip code population in 2000: 11,469
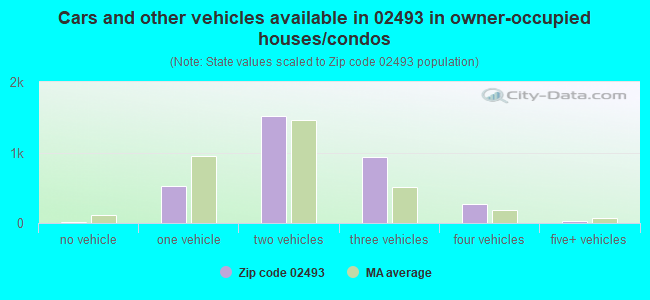
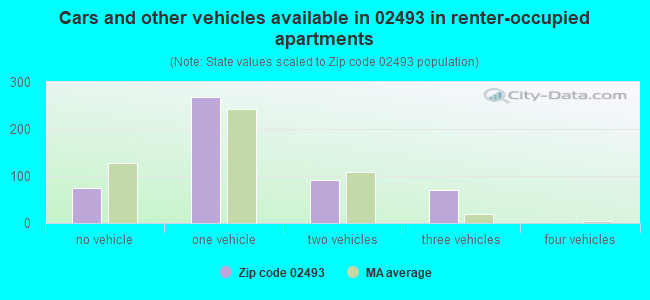
Houses and condos: 4,015 Renter-occupied apartments: 502
% of renters here:
13%
State:
38%
March 2022 cost of living index in zip code 02493: 136.3 (high, U.S. average is 100)
Land area: 16.8 sq. mi. Water area: 0.5 sq. mi.
Population density: 699 people per square mile
(low).
OSM Map
Google Map
MSN Map
OSM Map
General Map
Google Map
MSN Map
OSM Map
Google Map
MSN Map
OSM Map
Google Map
MSN Map
Please wait while loading the map...
Real estate property taxes paid for housing units in 2022:
This zip code:
0.6% ($9,915)
Massachusetts:
1.0% ($5,536)
Median real estate property taxes paid for housing units with mortgages in 2022: $9,911 (0.6%) Median real estate property taxes paid for housing units with no mortgage in 2022: $9,925 (0.8%)
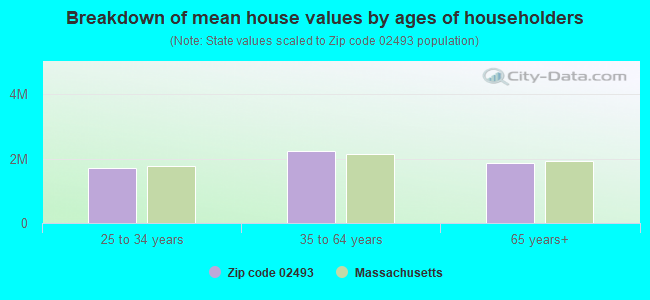
Estimated median house/condo value in 2022: $1,584,542
02493:
$1,584,542
Massachusetts:
$534,700
Median resident age:
This zip code:
46.2 years
Massachusetts median age:
40.3 years
Average household size:
This zip code:
2.9 people
Massachusetts:
2.4 people
Averages for the 2020 tax year for zip code 02493, filed in 2021:
Average Adjusted Gross Income (AGI) in 2020: $949,360 (Individual Income Tax Returns)
Here:
$949,360
State:
$105,130
Salary/wage: $429,573 (reported on 72.4% of returns)
Here:
$429,573
State:
$82,951
(% of AGI for various income ranges: 1381.2% for AGIs below $25k, 4915.5% for AGIs $25k-50k, 6853.0% for AGIs $50k-75k, 11300.8% for AGIs $75k-100k, 20844.8% for AGIs $100k-200k, 337318.7% for AGIs over 200k)
Taxable interest for individuals: $28,817 (reported on 70.5% of returns)
This zip code:
$28,817
Massachusetts:
$2,361
(% of AGI for various income ranges: 97.9% for AGIs below $25k, 217.3% for AGIs $25k-50k, 242.5% for AGIs $50k-75k, 423.8% for AGIs $75k-100k, 906.4% for AGIs $100k-200k, 22504.0% for AGIs over 200k)
Ordinary dividends: $61,908 (reported on 68.4% of returns)
Here:
$61,908
State:
$10,365
(% of AGI for various income ranges: 327.4% for AGIs below $25k, 574.5% for AGIs $25k-50k, 647.5% for AGIs $50k-75k, 1292.3% for AGIs $75k-100k, 3663.2% for AGIs $100k-200k, 45548.4% for AGIs over 200k)
Net capital gain/loss in AGI: +$619,463 (reported on 64.9% of returns)
Here:
+$619,463
State:
+$48,178
(% of AGI for various income ranges: 226.3% for AGIs below $25k, 700.5% for AGIs $25k-50k, 568.5% for AGIs $50k-75k, 1856.2% for AGIs $75k-100k, 3417.2% for AGIs $100k-200k, 460662.9% for AGIs over 200k)
Profit/loss from business: +$80,424 (reported on 24.3% of returns)
Here:
+$80,424
State:
+$20,792
(% of AGI for various income ranges: 225.1% for AGIs below $25k, 382.3% for AGIs $25k-50k, 509.5% for AGIs $50k-75k, 954.6% for AGIs $75k-100k, 2991.2% for AGIs $100k-200k, 19952.7% for AGIs over 200k)
Taxable individual retirement arrangement distribution: $69,821 (reported on 13.5% of returns)
02493:
$69,821
Massachusetts:
$22,790
(% of AGI for various income ranges: 40.2% for AGIs below $25k, 183.6% for AGIs $25k-50k, 359.5% for AGIs $50k-75k, 1098.5% for AGIs $75k-100k, 3189.2% for AGIs $100k-200k, 8484.0% for AGIs over 200k)
Self-employed (Keogh) retirement plans: $38,371 (reported on 7.3% of returns)
02493:
$38,371
Massachusetts:
$26,868
(% of AGI for various income ranges: 470.0% for AGIs $100k-200k, 2979.1% for AGIs over 200k)
Total itemized deductions: $137,169 (reported on 41.4% of returns)
Here:
$137,169
State:
$36,722
(% of AGI for various income ranges: 618.8% for AGIs below $25k, 812.3% for AGIs $25k-50k, 1200.0% for AGIs $50k-75k, 1526.2% for AGIs $75k-100k, 4879.2% for AGIs $100k-200k, 60862.9% for AGIs over 200k)
Charity contributions: $66,542 (reported on 35.6% of returns)
Here:
$66,542
State:
$12,529
(% of AGI for various income ranges: 18.4% for AGIs below $25k, 89.5% for AGIs $25k-50k, 107.5% for AGIs $50k-75k, 242.3% for AGIs $75k-100k, 698.0% for AGIs $100k-200k, 26789.1% for AGIs over 200k)
Taxes paid: $9,651 (reported on 41.2% of returns)
02493:
$9,651
State:
$8,782
(% of AGI for various income ranges: 104.4% for AGIs below $25k, 188.2% for AGIs $25k-50k, 251.5% for AGIs $50k-75k, 434.6% for AGIs $75k-100k, 1055.6% for AGIs $100k-200k, 3574.2% for AGIs over 200k)
Earned income credit: $1,292 (reported on 2.3% of returns)
Here:
$1,292
State:
$1,909
(% of AGI for various income ranges: 36.0% for AGIs below $25k)
Percentage of individuals using paid preparers for their 2020 taxes: 92.1%
Here:
92%
State:
92%
(% for various income ranges: 89.9% for AGIs below $25k, 90.7% for AGIs $25k-50k, 91.4% for AGIs $50k-75k, 86.7% for AGIs $75k-100k, 90.1% for AGIs $100k-200k, 94.8% for AGIs over 200k)
Averages for the 2012 tax year for zip code 02493, filed in 2013:
Average Adjusted Gross Income (AGI) in 2012: $726,625 (Individual Income Tax Returns)
Here:
$726,625
State:
$81,425
Salary/wage: $303,229 (reported on 70.9% of returns)
Here:
$303,229
State:
$64,752
(% of AGI for various income ranges: 55.9% for AGIs below $25k, 59.1% for AGIs $25k-50k, 50.2% for AGIs $50k-75k, 42.4% for AGIs $75k-100k, 50.0% for AGIs $100k-200k, 28.5% for AGIs over 200k)
Taxable interest for individuals: $31,737 (reported on 72.1% of returns)
This zip code:
$31,737
Massachusetts:
$2,136
(% of AGI for various income ranges: 4.7% for AGIs below $25k, 3.8% for AGIs $25k-50k, 2.3% for AGIs $50k-75k, 3.2% for AGIs $75k-100k, 3.4% for AGIs $100k-200k, 3.1% for AGIs over 200k)
Ordinary dividends: $81,427 (reported on 69.9% of returns)
Here:
$81,427
State:
$9,473
(% of AGI for various income ranges: 18.2% for AGIs below $25k, 9.7% for AGIs $25k-50k, 10.1% for AGIs $50k-75k, 11.6% for AGIs $75k-100k, 8.7% for AGIs $100k-200k, 7.7% for AGIs over 200k)
Net capital gain/loss in AGI: +$374,824 (reported on 65.1% of returns)
Here:
+$374,824
State:
+$31,437
(% of AGI for various income ranges: 4.8% for AGIs below $25k, 5.2% for AGIs $25k-50k, 4.4% for AGIs $50k-75k, 5.0% for AGIs $75k-100k, 5.6% for AGIs $100k-200k, 35.0% for AGIs over 200k)
Profit/loss from business: +$72,469 (reported on 24.2% of returns)
Here:
+$72,469
State:
+$20,662
(% of AGI for various income ranges: 6.5% for AGIs below $25k, 6.6% for AGIs $25k-50k, 7.2% for AGIs $50k-75k, 8.7% for AGIs $75k-100k, 7.6% for AGIs $100k-200k, 2.2% for AGIs over 200k)
Taxable individual retirement arrangement distribution: $79,907 (reported on 19.4% of returns)
02493:
$79,907
Massachusetts:
$18,892
(% of AGI for various income ranges: 4.3% for AGIs below $25k, 4.3% for AGIs $25k-50k, 5.7% for AGIs $50k-75k, 8.5% for AGIs $75k-100k, 7.8% for AGIs $100k-200k, 1.9% for AGIs over 200k)
Self-employment retirement plans: $31,918 (reported on 8.0% of returns)
02493:
$31,918
Massachusetts:
$20,669
(% of AGI for various income ranges: 1.4% for AGIs $25k-50k, 0.8% for AGIs $100k-200k, 0.3% for AGIs over 200k)
Total itemized deductions: $156,944 (15% of AGI, reported on 66.9% of returns)
Here:
$156,944
State:
$28,907
Here:
14.6% of AGI
State:
18.2% of AGI
(% of AGI for various income ranges: 32.0% for AGIs below $25k, 27.0% for AGIs $25k-50k, 26.2% for AGIs $50k-75k, 30.8% for AGIs $75k-100k, 27.0% for AGIs $100k-200k, 13.8% for AGIs over 200k)
Charity contributions: $49,470 (reported on 58.7% of returns)
Here:
$49,470
State:
$4,208
(% of AGI for various income ranges: 1.3% for AGIs below $25k, 1.3% for AGIs $25k-50k, 2.3% for AGIs $50k-75k, 2.3% for AGIs $75k-100k, 2.6% for AGIs $100k-200k, 4.1% for AGIs over 200k)
Taxes paid: $80,623 (reported on 66.5% of returns)
02493:
$80,623
State:
$13,303
(% of AGI for various income ranges: 10.5% for AGIs below $25k, 9.8% for AGIs $25k-50k, 10.2% for AGIs $50k-75k, 11.7% for AGIs $75k-100k, 13.6% for AGIs $100k-200k, 7.1% for AGIs over 200k)
Earned income credit: $1,309 (reported on 2.2% of returns)
Here:
$1,309
State:
$1,971
(% of AGI for various income ranges: 1.3% for AGIs below $25k)
Percentage of individuals using paid preparers for their 2012 taxes: 72.1%
Here:
72%
State:
56%
(% for various income ranges: 65.9% for AGIs below $25k, 65.3% for AGIs $25k-50k, 63.3% for AGIs $50k-75k, 64.0% for AGIs $75k-100k, 67.1% for AGIs $100k-200k, 81.8% for AGIs over 200k)
Averages for the 2004 tax year for zip code 02493, filed in 2005:
Average Adjusted Gross Income (AGI) in 2004: $384,404 (Individual Income Tax Returns)
Here:
$384,404
State:
$62,877
Salary/wage: $259,722 (reported on 65.1% of returns)
Here:
$259,722
State:
$52,969
(% of AGI for various income ranges: 47.6% for AGIs $10k-25k, 54.8% for AGIs $25k-50k, 51.6% for AGIs $50k-75k, 53.0% for AGIs $75k-100k, 43.3% for AGIs over 100k)
Taxable interest for individuals: $16,758 (reported on 77.6% of returns)
This zip code:
$16,758
Massachusetts:
$1,945
(% of AGI for various income ranges: 8.4% for AGIs $10k-25k, 6.0% for AGIs $25k-50k, 5.9% for AGIs $50k-75k, 4.2% for AGIs $75k-100k, 3.3% for AGIs over 100k)
Taxable dividends: $36,559 (reported on 72.7% of returns)
Here:
$36,559
State:
$5,323
(% of AGI for various income ranges: 16.1% for AGIs $10k-25k, 8.1% for AGIs $25k-50k, 8.9% for AGIs $50k-75k, 9.5% for AGIs $75k-100k, 6.7% for AGIs over 100k)
Net capital gain/loss: +$178,054 (reported on 68.2% of returns)
Here:
+$178,054
State:
+$20,377
(% of AGI for various income ranges: 10.2% for AGIs $10k-25k, 7.4% for AGIs $25k-50k, 8.6% for AGIs $50k-75k, 7.6% for AGIs $75k-100k, 32.4% for AGIs over 100k)
Profit/loss from business: +$56,593 (reported on 22.4% of returns)
Here:
+$56,593
State:
+$17,837
(% of AGI for various income ranges: 6.8% for AGIs $10k-25k, 8.6% for AGIs $25k-50k, 7.3% for AGIs $50k-75k, 9.8% for AGIs $75k-100k, 3.1% for AGIs over 100k)
IRA payment deduction: $3,923 (reported on 3.0% of returns)
02493:
$3,923
Massachusetts:
$3,100
(% of AGI for various income ranges: 0.2% for AGIs $25k-50k, 0.3% for AGIs $50k-75k, 0.4% for AGIs $75k-100k, 0.0% for AGIs over 100k)
Self-employed pension: $22,990 (reported on 7.2% of returns)
Here:
$22,990
Massachusetts:
$14,516
(% of AGI for various income ranges: 0.4% for AGIs $50k-75k, 1.1% for AGIs $75k-100k, 0.4% for AGIs over 100k)
Total itemized deductions: $99,516 (15% of AGI, reported on 57.8% of returns)
Here:
$99,516
State:
$22,573
Here:
15.2% of AGI
State:
19.5% of AGI
(% of AGI for various income ranges: 31.0% for AGIs $10k-25k, 24.7% for AGIs $25k-50k, 28.5% for AGIs $50k-75k, 34.1% for AGIs $75k-100k, 14.3% for AGIs over 100k)
Charity contributions deductions: $28,055 (4% of AGI, reported on 53.2% of returns)
Here:
$28,055
State:
$3,295
Here:
4.0% of AGI
State:
2.7% of AGI
(% of AGI for various income ranges: 2.1% for AGIs $10k-25k, 2.2% for AGIs $25k-50k, 3.0% for AGIs $50k-75k, 3.9% for AGIs $75k-100k, 3.9% for AGIs over 100k)
Total tax: $136,357 (reported on 79.9% of returns)
02493:
$136,357
State:
$11,494
(% of AGI for various income ranges: 5.4% for AGIs $10k-25k, 8.7% for AGIs $25k-50k, 10.0% for AGIs $50k-75k, 10.2% for AGIs $75k-100k, 29.0% for AGIs over 100k)
Earned income credit: $1,071 (reported on 1.3% of returns)
Here:
$1,071
State:
$1,518
Percentage of individuals using paid preparers for their 2004 taxes: 74.5%
Here:
75%
State:
58%
(% for various income ranges: 72.8% for AGIs below $10k, 68.2% for AGIs $10k-25k, 67.9% for AGIs $25k-50k, 69.7% for AGIs $50k-75k, 69.4% for AGIs $75k-100k, 80.2% for AGIs over 100k)
Household received Food Stamps/SNAP in the past 12 months: 107 Household did not receive Food Stamps/SNAP in the past 12 months: 3,621
Women who had a birth in the past 12 months: 66 (69 now married, 0 unmarried) Women who did not have a birth in the past 12 months: 1,998 (955 now married, 1,029 unmarried)
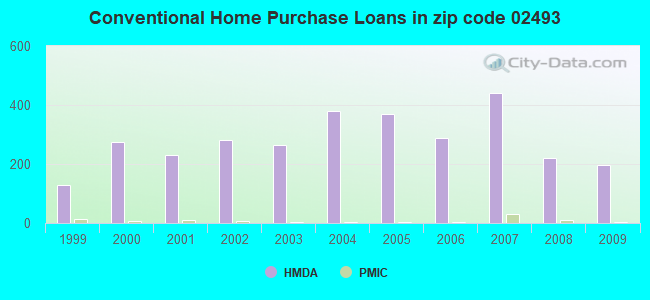
Housing units in zip code 02493 with a mortgage: 2,040 (375 second mortgage, 323 both second mortgage and home equity loan) Houses without a mortgage: 47
Median monthly owner costs for units with a mortgage: $3,900 Median monthly owner costs for units without a mortgage: $1,507
Residents with income below the poverty level in 2022:
This zip code:
5.8%
Whole state:
10.4%
Residents with income below 50% of the poverty level in 2022:
This zip code:
1.4%
Whole state:
5.1%
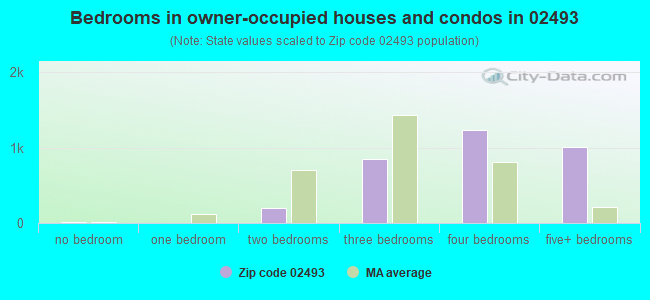
Median number of rooms in houses and condos:
Here:
10.0
State:
6.5
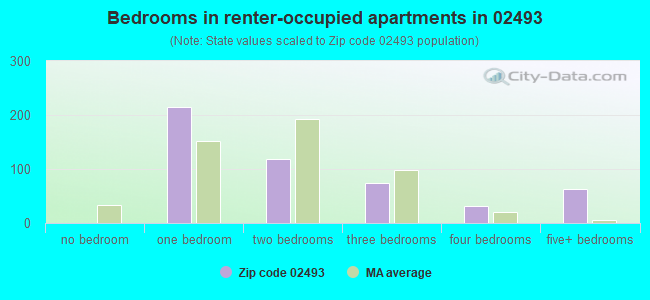
Median number of rooms in apartments:
Here:
4.1
State:
4.0
Notable locations in this zip code not listed on our city pages
Notable locations in zip code 02493: Kendal Green Station (A), Silver Hill Station (B), Weston Golf Club (C), Pine Brook Country Club (D), Camp Mary Day (E), Martin Golf Course (F), Weston Fire Department Station 2 (G), Weston Fire Department Station 1 Headquarters (H), Weston Middle School Library (I), Weston High School Library (J), Field School Library (K), Campion Center (L), MacDowell Library (M), Weston Town Hall (N), Cardinal Spellman Philatelic Museum (O), Cardinal Spellman Philatelic Museum Library (P), Golden Ball Tavern Trust Museum (Q), Golden Ball Tavern Trust Museum Library (R), Pope John XXIII National Seminary Library (S), Regis College Library (T). Display/hide their locations on the map
Churches in zip code 02493 include: Weston Congregational Church (A), Saint Peters Episcopal Church (B), Saint Demetrius Church (C), Methodist Church of Weston (D), First Parish in Weston (E), First Baptist Church of Weston (F), The Church of Jesus Christ of Latter Day Saints (G), Corpus Christi Church (H), Weston Church (I). Display/hide their locations on the map
Parks in zip code 02493 include: Lanson Park (1), Metropolitan Park (2), Anniversary Park East (3), Childrens Park (4), Boston Post Road Historic District (5), Wellington Farm Historic District (6). Display/hide their locations on the map
In group quarters: 778 (-1 institutionalized population)
Size of family households: 1,056 2-persons, 743 3-persons, 761 4-persons, 341 5-persons, 124 6-persons, 31 7-or-more-persons
Size of nonfamily households: 628 1-person, 88 2-persons
2,552 married couples with children.
276 single-parent households (153 men, 123 women).
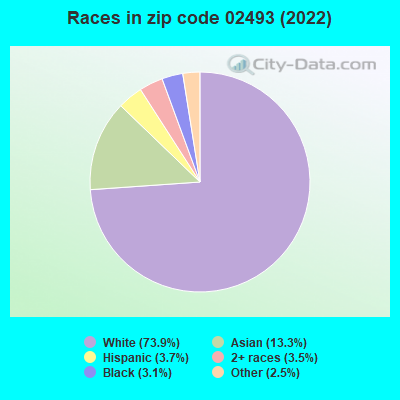
75.3% of residents of 02493 zip code speak English at home.
2.5% of residents speak Spanish at home (98% very well, 2% not well).
11.8% of residents speak other Indo-European language at home (87% very well, 11% well, 1% not well, 1% not at all).
9.0% of residents speak Asian or Pacific Island language at home (67% very well, 22% well, 11% not well).
1.5% of residents speak other language at home (86% very well, 14% well).
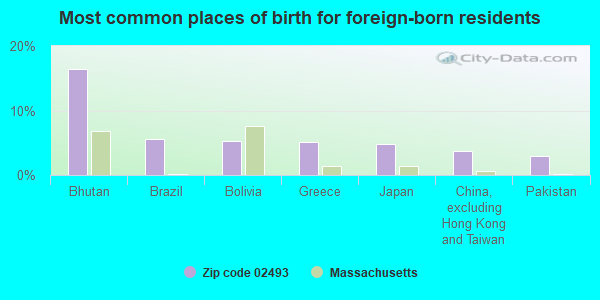
Foreign born population: 2,434 (20.7%) (75.2% of them are naturalized citizens)
This zip code:
20.7%
Whole state:
18.0%
16%Bhutan
6%Brazil
5%Bolivia
5%Greece
5%Japan
4%China, excluding Hong Kong and Taiwan
3%Pakistan
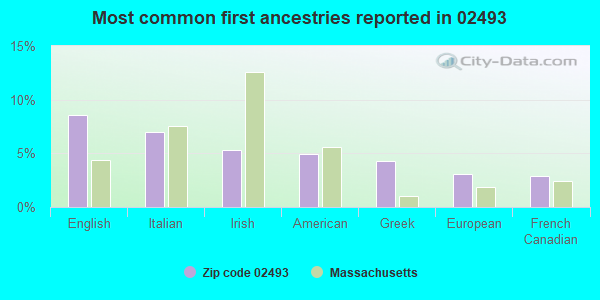
9%English
7%Italian
5%Irish
5%American
4%Greek
3%European
3%French Canadian
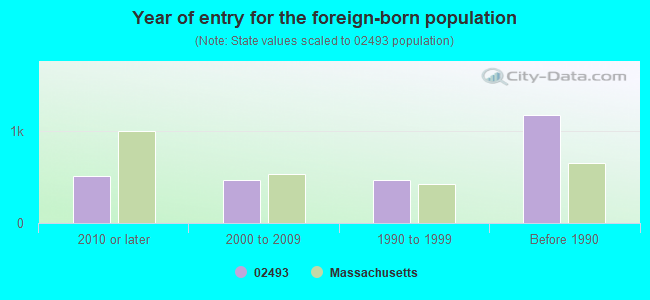
Year of entry for the foreign-born population
5152010 or later
4612000 to 2009
4621990 to 1999
1,171Before 1990
Facilities with environmental interests located in this zip code:
MA TURNPIKE AUTHORITY (668 SOUTH AVE in WESTON, MA)
Small Quantity Generators, between 100 kg and 1000 kg of hazardous waste/month (Resource Conservation and Recovery Act (tracking hazardous waste)) - notification - ICIS-, ENFORCEMENT/COMPLIANCE ACTIVITY (Resource Conservation and Recovery Act (tracking hazardous waste)) Organizations: MASS TURNPIKE AUTHORITY (CONTACT/OWNER)
Alternative names: MA TURNPIKE BOSTON EXIT MAINT, MA TURNPIKE WESTON MAINTENANCE FACILITY
MWRA NORUMBEGA RESERVOIR (55 OAK ST in WESTON, MA)
AIR MINOR (AIRS/AFS) CRITERIA AND HAZARDOUS AIR POLLUTANT INVENTORY (Inventory of air pollution sources) National Pollutant Discharge Elimination System NON-MAJOR (Tracking pollutant discharge elimination systems) - permit Business SIC classification: WATER SUPPLY Organizations: NORUMBEGA CONSTRUCTORS (CONTACT/OPERATOR)
Alternative names: MWRA - NORUMBEGA, MWRA NORUMBEGA COVERED STORAGE FACILITY, MWRA - NORUMBEGA FACILITY, NORUMBEGA CHEMICAL FEED FACILITY
MA BROKEN STONE CO (133 BOSTON POST RD in WESTON, MA)
AIR SYNTHETIC MINOR (AIRS/AFS) CRITERIA AND HAZARDOUS AIR POLLUTANT INVENTORY (Inventory of air pollution sources) (Resource Conservation and Recovery Act (tracking hazardous waste)) Business SIC classification: ASPHALT PAVING MIXTURES AND BLOCKS Organizations: MASSACHUSETTS BROKEN STONE CO (CONTACT/OWNER)
MWRA WESTON RESERVOIR (NEWTON STREET in WESTON, MA)
AIR MINOR (AIRS/AFS) CRITERIA AND HAZARDOUS AIR POLLUTANT INVENTORY (Inventory of air pollution sources) Business SIC classification: SEWERAGE SYSTEMS
ALGONQUIN GAS TRANSMISSION CO (RTE 128 in WESTON, MA)
Small Quantity Generators, between 100 kg and 1000 kg of hazardous waste/month (Resource Conservation and Recovery Act (tracking hazardous waste)) - notification Organizations: ALGONQUIN GAS TRANSMISSION CO VALVE J11 (CONTACT/OPERATOR)
, ALGONQUIN GAS TRANSMISSION COMPANY (CONTACT/OWNER)
Alternative names: ALGONQUIN GAS TRANSMISSION CO VALVE J11
MASSACHUSETTS TURNPIKE AUTHORITY (WESTBOUND in WESTON, MA)
ENFORCEMENT/COMPLIANCE ACTIVITY (Integrated Compliance Information System)
Housing units lacking complete kitchen facilities: 0.2%
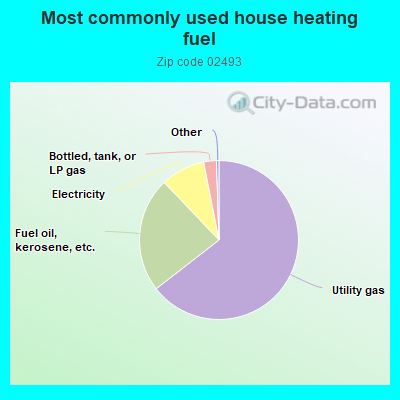
64.5%Utility gas
23.4%Fuel oil, kerosene, etc.
9.0%Electricity
2.6%Bottled, tank, or LP gas
Place of birth for U.S.-born residents:
This state: 5,637
Northeast: 1,622
Midwest: 551
South: 697
West: 617
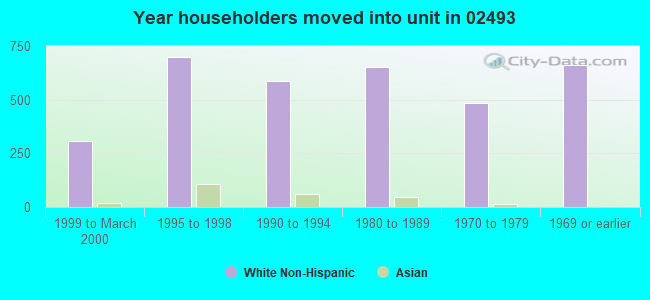
68% of the 02493 zip code residents lived in the same house 5 years ago. Out of people who lived in different houses, 46% lived in this county. Out of people who lived in different counties, 50% lived in Massachusetts.
91% of the 02493 zip code residents lived in the same house 1 year ago. Out of people who lived in different houses, 60% moved from this county. Out of people who lived in different houses, 18% moved from different county within same state. Out of people who lived in different houses, 10% moved from different state. Out of people who lived in different houses, 9% moved from abroad.
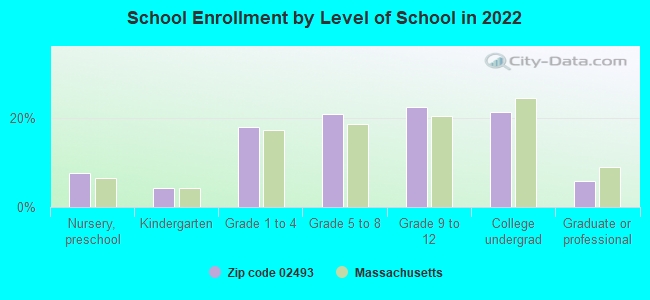
Private vs. public school enrollment:
Students in private schools in grades 1 to 8 (elementary and middle school): 344
Here:
23.6%
Massachusetts:
10.3%
Students in private schools in grades 9 to 12 (high school): 300
Here:
36.1%
Massachusetts:
12.3%
Students in private undergraduate colleges: 658
Here:
82.3%
Massachusetts:
51.2%
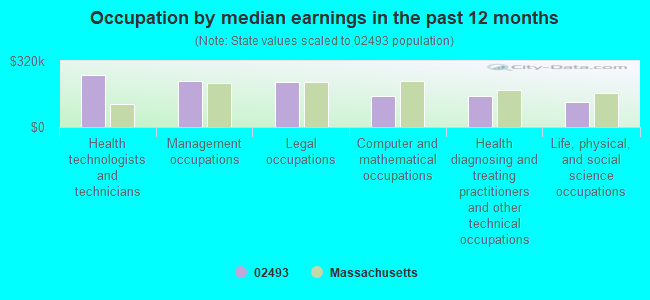
Occupation by median earnings in the past 12 months ($)
250,576Health technologists and technicians
225,237Management occupations
219,658Legal occupations
152,330Computer and mathematical occupations
149,738Health diagnosing and treating practitioners and other technical occupations
119,560Life, physical, and social science occupations
Companies with federal contracts located in this zip code (WESTON, MA):
AWARE INC (338 CONANT RD; small business) : $1,024,514 in 12 contractsfrom 2003 to 2006
Contracts for Other Medical -- Basic Research (R&D), Laboratory Equipment and Supplies, Technical Assistance, Computer Aided Design/Computer Aided Manufacturing (CAD/CAM) Services by Army, National Institutes of Health Signed by year:2000: $0; 2001: $0; 2002: $0; 2003: $69,998; 2004: $460,590; 2005: $110,000; 2006: $383,926.
Biggest contracts:
$365,000 with Army for Other Medical -- Basic Research (R&D). Taking place in MD. Signed on 2006-03-24. Completion date: 2007-01-22.
$365,000, same as above.Signed on 2004-12-08. Completion date: 2004-07-14.
$100,000 with Army for Other Medical -- Basic Research (R&D). Signed on 2005-08-11. Completion date: 2006-07-14.
$69,998 with Army for Other Medical -- Basic Research (R&D). Taking place in MD. Signed on 2003-12-08. Completion date: 2004-07-14.
ADCOM SYSTEMS TECHNOLOGY INC (190 NORTH AVE; small business) : $125,957 in 3 contractsfrom 2000 to 2002
$84,734 with Navy for Defense Electronics and Communication Equipment -- Basic Research (R&D). Signed on 2000-05-04. Completion date: 2000-12-30.
$23,956 with Navy for Other Defense -- Basic Research (R&D). Signed on 2001-09-20. Completion date: 2001-12-31.
$17,267, same as above.Signed on 2002-01-09. Completion date: 2002-03-14.
REGIS COLLEGE (235 WELLESLEYSTREET)
$13,220 with Army for Lodging - Hotel/Motel. Signed on 2004-04-26. Completion date: 2004-04-26.
ACTION DESIGN (89 BLACK OAK RD; small business)
$4,515 with Army for Scientific and Management Education. Signed on 2004-03-04. Completion date: 2004-05-07.
AIRBORNE RESEARCH ASSOCIATES I (46 KENDAL COMMON RD; small business)
$1,700 with Navy for Semiconductor Devices and Associated Hardware. Signed on 2005-11-01. Completion date: 2005-11-22.
Top industries in this zip code by the number of employees in 2005:
Detailed PMIC statistics for the following Tracts:3671.00
, 3672.00
2002 - 2018 National Fire Incident Reporting System (NFIRS) incidents
According to the data from the years 2002 - 2018 the average number of fire incidents per year is 54. The highest number of reported fires - 119 took place in 2004, and the least - 33 in 2017. The data has a declining trend.
When looking into fire subcategories, the most incidents belonged to: Structure Fires (45.9%), and Outside Fires (25.7%).
Fire incident types reported to NFIRS in Zip Code 02493


 Nearest zip codes: 02481, 02466, 02462, 02451, 02453, 01773.


 According to the data from the years 2002 - 2018 the average number of fire incidents per year is 54. The highest number of reported fires - 119 took place in 2004, and the least - 33 in 2017. The data has a declining trend.
 When looking into fire subcategories, the most incidents belonged to: Structure Fires (45.9%), and Outside Fires (25.7%).