Estimated zip code population in 2022: 1,437 Zip code population in 2010: 1,554 Zip code population in 2000: 1,528
Houses and condos: 553 Renter-occupied apartments: 167
% of renters here:
31%
State:
38%
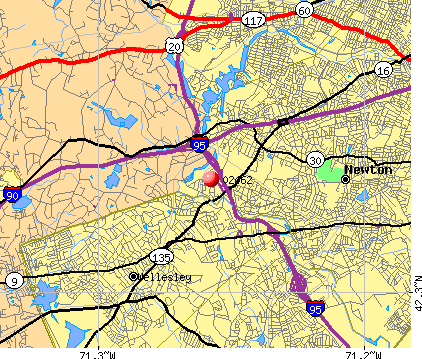
March 2022 cost of living index in zip code 02462: 139.5 (high, U.S. average is 100)
Land area: 0.5 sq. mi. Water area: 0.0 sq. mi.
Population density: 2,718 people per square mile
(average).
OSM Map
Google Map
MSN Map
OSM Map
General Map
Google Map
MSN Map
OSM Map
Google Map
MSN Map
OSM Map
Google Map
MSN Map
Please wait while loading the map...
Real estate property taxes paid for housing units in 2022:
This zip code:
0.7% ($9,687)
Massachusetts:
1.0% ($5,536)
Median real estate property taxes paid for housing units with mortgages in 2022: $9,911 (0.7%) Median real estate property taxes paid for housing units with no mortgage in 2022: $8,723 (0.8%)
Business Search- 14 Million verified businesses
Males: 673
(46.8%)
Females: 764
(53.2%)
For population 25 years and over in 02462:
High school or higher: 96.4%
Bachelor's degree or higher: 68.4%
Graduate or professional degree: 40.0%
Unemployed: 1.0%
Mean travel time to work (commute): 26.0 minutes
For population 15 years and over in 02462:
Never married: 37.5%
Now married: 50.8%
Separated: 0.6%
Widowed: 3.4%
Divorced: 7.6%
Zip code 02462 compared to state average:
Median house value significantly above state average.
Unemployed percentage significantly below state average.
Black race population percentage significantly below state average.
Hispanic race population percentage significantly below state average.
Median age significantly above state average.
Length of stay since moving in significantly above state average.
Number of rooms per house above state average.
Percentage of population with a bachelor's degree or higher above state average.
Estimated median house/condo value in 2022: $1,344,982
02462:
$1,344,982
Massachusetts:
$534,700
Median resident age:
This zip code:
51.3 years
Massachusetts median age:
40.3 years
Average household size:
This zip code:
2.3 people
Massachusetts:
2.4 people
Averages for the 2020 tax year for zip code 02462, filed in 2021:
Average Adjusted Gross Income (AGI) in 2020: $179,375 (Individual Income Tax Returns)
Here:
$179,375
State:
$105,130
Salary/wage: $143,681 (reported on 76.5% of returns)
Here:
$143,681
State:
$82,951
(% of AGI for various income ranges: 1262.9% for AGIs below $25k, 3201.7% for AGIs $25k-50k, 5082.5% for AGIs $50k-75k, 10446.7% for AGIs $75k-100k, 19180.0% for AGIs $100k-200k, 106632.0% for AGIs over 200k)
Taxable interest for individuals: $3,159 (reported on 60.3% of returns)
This zip code:
$3,159
Massachusetts:
$2,361
(% of AGI for various income ranges: 38.6% for AGIs below $25k, 116.7% for AGIs $25k-50k, 32.5% for AGIs $50k-75k, 300.0% for AGIs $75k-100k, 367.1% for AGIs $100k-200k, 1676.0% for AGIs over 200k)
Ordinary dividends: $12,666 (reported on 55.9% of returns)
Here:
$12,666
State:
$10,365
(% of AGI for various income ranges: 84.3% for AGIs below $25k, 250.0% for AGIs $25k-50k, 507.5% for AGIs $50k-75k, 823.3% for AGIs $75k-100k, 1461.4% for AGIs $100k-200k, 6262.0% for AGIs over 200k)
Net capital gain/loss in AGI: +$29,724 (reported on 48.5% of returns)
Here:
+$29,724
State:
+$48,178
(% of AGI for various income ranges: 52.9% for AGIs below $25k, 370.0% for AGIs $25k-50k, 390.0% for AGIs $75k-100k, 1561.4% for AGIs $100k-200k, 16680.0% for AGIs over 200k)
Profit/loss from business: +$31,157 (reported on 20.6% of returns)
Here:
+$31,157
State:
+$20,792
(% of AGI for various income ranges: 336.7% for AGIs $25k-50k, 1951.4% for AGIs $100k-200k, 5588.0% for AGIs over 200k)
Taxable individual retirement arrangement distribution: $22,256 (reported on 13.2% of returns)
02462:
$22,256
Massachusetts:
$22,790
(% of AGI for various income ranges: 753.3% for AGIs $25k-50k, 2215.7% for AGIs $100k-200k)
Self-employed (Keogh) retirement plans: $19,400 (reported on 4.4% of returns)
02462:
$19,400
Massachusetts:
$26,868
(% of AGI for various income ranges: 831.4% for AGIs $100k-200k)
Total itemized deductions: $36,460 (reported on 29.4% of returns)
Here:
$36,460
State:
$36,722
(% of AGI for various income ranges: 1840.0% for AGIs $25k-50k, 2894.3% for AGIs $100k-200k, 8324.0% for AGIs over 200k)
Charity contributions: $8,831 (reported on 23.5% of returns)
Here:
$8,831
State:
$12,529
(% of AGI for various income ranges: 64.3% for AGIs below $25k, 310.0% for AGIs $100k-200k, 2302.0% for AGIs over 200k)
Taxes paid: $9,100 (reported on 29.4% of returns)
02462:
$9,100
State:
$8,782
(% of AGI for various income ranges: 368.3% for AGIs $25k-50k, 854.3% for AGIs $100k-200k, 2002.0% for AGIs over 200k)
Earned income credit: $2,300 (reported on 2.9% of returns)
Here:
$2,300
State:
$1,909
(% of AGI for various income ranges: 65.7% for AGIs below $25k)
Percentage of individuals using paid preparers for their 2020 taxes: 89.7%
Here:
90%
State:
92%
(% for various income ranges: 92.9% for AGIs below $25k, 90.0% for AGIs $25k-50k, 80.0% for AGIs $50k-75k, 80.0% for AGIs $75k-100k, 86.7% for AGIs $100k-200k, 94.7% for AGIs over 200k)
Averages for the 2012 tax year for zip code 02462, filed in 2013:
Average Adjusted Gross Income (AGI) in 2012: $161,338 (Individual Income Tax Returns)
Here:
$161,338
State:
$81,425
Salary/wage: $114,225 (reported on 73.9% of returns)
Here:
$114,225
State:
$64,752
(% of AGI for various income ranges: 65.6% for AGIs below $25k, 64.1% for AGIs $25k-50k, 63.1% for AGIs $50k-75k, 67.2% for AGIs $75k-100k, 75.7% for AGIs $100k-200k, 44.1% for AGIs over 200k)
Taxable interest for individuals: $3,251 (reported on 59.4% of returns)
This zip code:
$3,251
Massachusetts:
$2,136
(% of AGI for various income ranges: 4.4% for AGIs below $25k, 4.2% for AGIs $25k-50k, 3.2% for AGIs $50k-75k, 1.5% for AGIs $75k-100k, 0.7% for AGIs $100k-200k, 0.9% for AGIs over 200k)
Ordinary dividends: $9,159 (reported on 46.4% of returns)
Here:
$9,159
State:
$9,473
(% of AGI for various income ranges: 6.3% for AGIs below $25k, 4.3% for AGIs $25k-50k, 5.4% for AGIs $50k-75k, 2.1% for AGIs $75k-100k, 3.8% for AGIs $100k-200k, 2.0% for AGIs over 200k)
Net capital gain/loss in AGI: +$25,996 (reported on 37.7% of returns)
Here:
+$25,996
State:
+$31,437
(% of AGI for various income ranges: 2.5% for AGIs $25k-50k, 3.1% for AGIs $50k-75k, 2.6% for AGIs $100k-200k, 7.9% for AGIs over 200k)
Profit/loss from business: +$36,485 (reported on 18.8% of returns)
Here:
+$36,485
State:
+$20,662
(% of AGI for various income ranges: 15.9% for AGIs below $25k, 6.6% for AGIs $50k-75k, 6.2% for AGIs $100k-200k, 3.8% for AGIs over 200k)
Taxable individual retirement arrangement distribution: $29,570 (reported on 14.5% of returns)
02462:
$29,570
Massachusetts:
$18,892
(% of AGI for various income ranges: 10.4% for AGIs below $25k, 5.6% for AGIs $50k-75k, 4.7% for AGIs $100k-200k, 2.1% for AGIs over 200k)
Self-employment retirement plans: $30,300 (reported on 4.3% of returns)
02462:
$30,300
Massachusetts:
$20,669
Total itemized deductions: $41,800 (16% of AGI, reported on 53.6% of returns)
Here:
$41,800
State:
$28,907
Here:
15.5% of AGI
State:
18.2% of AGI
(% of AGI for various income ranges: 27.9% for AGIs below $25k, 22.3% for AGIs $25k-50k, 29.1% for AGIs $50k-75k, 16.1% for AGIs $75k-100k, 18.0% for AGIs $100k-200k, 11.0% for AGIs over 200k)
Charity contributions: $4,174 (reported on 44.9% of returns)
Here:
$4,174
State:
$4,208
(% of AGI for various income ranges: 1.2% for AGIs $25k-50k, 0.7% for AGIs $50k-75k, 0.7% for AGIs $75k-100k, 1.6% for AGIs $100k-200k, 1.1% for AGIs over 200k)
Taxes paid: $20,631 (reported on 52.2% of returns)
02462:
$20,631
State:
$13,303
(% of AGI for various income ranges: 12.0% for AGIs below $25k, 4.8% for AGIs $25k-50k, 5.4% for AGIs $50k-75k, 5.8% for AGIs $75k-100k, 8.6% for AGIs $100k-200k, 6.3% for AGIs over 200k)
Earned income credit: $1,550 (reported on 5.8% of returns)
Here:
$1,550
State:
$1,971
(% of AGI for various income ranges: 3.3% for AGIs below $25k)
Percentage of individuals using paid preparers for their 2012 taxes: 49.3%
Here:
49%
State:
56%
(% for various income ranges: 47.1% for AGIs below $25k, 36.4% for AGIs $25k-50k, 55.6% for AGIs $50k-75k, 50.0% for AGIs $75k-100k, 46.2% for AGIs $100k-200k, 61.5% for AGIs over 200k)
Averages for the 2004 tax year for zip code 02462, filed in 2005:
Average Adjusted Gross Income (AGI) in 2004: $82,707 (Individual Income Tax Returns)
Here:
$82,707
State:
$62,877
Salary/wage: $73,107 (reported on 71.5% of returns)
Here:
$73,107
State:
$52,969
(% of AGI for various income ranges: 332.6% for AGIs below $10k, 47.5% for AGIs $10k-25k, 65.4% for AGIs $25k-50k, 69.3% for AGIs $50k-75k, 71.7% for AGIs $75k-100k, 61.3% for AGIs over 100k)
Taxable interest for individuals: $3,317 (reported on 73.0% of returns)
This zip code:
$3,317
Massachusetts:
$1,945
(% of AGI for various income ranges: 52.2% for AGIs below $10k, 6.9% for AGIs $10k-25k, 4.2% for AGIs $25k-50k, 4.6% for AGIs $50k-75k, 1.3% for AGIs $75k-100k, 2.5% for AGIs over 100k)
Taxable dividends: $6,491 (reported on 56.0% of returns)
Here:
$6,491
State:
$5,323
(% of AGI for various income ranges: 91.3% for AGIs below $10k, 13.1% for AGIs $10k-25k, 5.5% for AGIs $25k-50k, 5.0% for AGIs $50k-75k, 2.1% for AGIs $75k-100k, 3.9% for AGIs over 100k)
Net capital gain/loss: +$19,337 (reported on 46.0% of returns)
Here:
+$19,337
State:
+$20,377
(% of AGI for various income ranges: -48.9% for AGIs below $10k, 5.9% for AGIs $10k-25k, 1.4% for AGIs $25k-50k, 0.4% for AGIs $50k-75k, -0.4% for AGIs $75k-100k, 14.6% for AGIs over 100k)
Profit/loss from business: +$33,922 (reported on 19.3% of returns)
Here:
+$33,922
State:
+$17,837
(% of AGI for various income ranges: 4.6% for AGIs $10k-25k, 3.9% for AGIs $25k-50k, 3.6% for AGIs $50k-75k, 8.5% for AGIs $75k-100k, 9.0% for AGIs over 100k)
IRA payment deduction: $2,364 (reported on 1.8% of returns)
02462:
$2,364
Massachusetts:
$3,100
Self-employed pension: $22,000 (reported on 3.5% of returns)
Here:
$22,000
Massachusetts:
$14,516
Total itemized deductions: $28,667 (21% of AGI, reported on 51.0% of returns)
Here:
$28,667
State:
$22,573
Here:
20.9% of AGI
State:
19.5% of AGI
(% of AGI for various income ranges: 153.3% for AGIs below $10k, 31.1% for AGIs $10k-25k, 19.8% for AGIs $25k-50k, 15.8% for AGIs $50k-75k, 25.5% for AGIs $75k-100k, 15.9% for AGIs over 100k)
Charity contributions deductions: $3,559 (2% of AGI, reported on 45.0% of returns)
Here:
$3,559
State:
$3,295
Here:
2.4% of AGI
State:
2.7% of AGI
(% of AGI for various income ranges: 1.3% for AGIs $10k-25k, 1.3% for AGIs $25k-50k, 1.2% for AGIs $50k-75k, 2.0% for AGIs $75k-100k, 2.1% for AGIs over 100k)
Total tax: $17,147 (reported on 78.2% of returns)
02462:
$17,147
State:
$11,494
(% of AGI for various income ranges: 18.5% for AGIs below $10k, 3.9% for AGIs $10k-25k, 7.4% for AGIs $25k-50k, 11.9% for AGIs $50k-75k, 10.0% for AGIs $75k-100k, 18.8% for AGIs over 100k)
Earned income credit: $1,871 (reported on 5.2% of returns)
Here:
$1,871
State:
$1,518
Percentage of individuals using paid preparers for their 2004 taxes: 52.8%
Here:
53%
State:
58%
(% for various income ranges: 37.3% for AGIs below $10k, 63.3% for AGIs $10k-25k, 52.1% for AGIs $25k-50k, 53.5% for AGIs $50k-75k, 59.6% for AGIs $75k-100k, 57.7% for AGIs over 100k)
Household received Food Stamps/SNAP in the past 12 months: 143 Household did not receive Food Stamps/SNAP in the past 12 months: 403
Women who had a birth in the past 12 months: 29 (30 now married, 0 unmarried) Women who did not have a birth in the past 12 months: 307 (101 now married, 207 unmarried)
Housing units in zip code 02462 with a mortgage: 275 (60 second mortgage, 62 both second mortgage and home equity loan) Houses without a mortgage: 10
Median monthly owner costs for units with a mortgage: $3,743 Median monthly owner costs for units without a mortgage: $1,340
Residents with income below the poverty level in 2022:
This zip code:
8.1%
Whole state:
10.4%
Residents with income below 50% of the poverty level in 2022:
This zip code:
3.4%
Whole state:
5.1%
Median number of rooms in houses and condos:
Here:
7.5
State:
6.5
Median number of rooms in apartments:
Here:
3.3
State:
4.0
Notable locations in this zip code not listed on our city pages
In group quarters: 192 (-1 institutionalized population)
Size of family households: 149 2-persons, 93 3-persons, 73 4-persons, 16 5-persons, 8 6-persons
Size of nonfamily households: 152 1-person, 41 2-persons
212 married couples with children.
0 single-parent households ().
78.8% of residents of 02462 zip code speak English at home.
3.6% of residents speak Spanish at home (100% well).
3.0% of residents speak other Indo-European language at home (81% very well, 19% well).
15.5% of residents speak Asian or Pacific Island language at home (86% very well, 8% well, 7% not well).
Foreign born population: 345 (24.0%) (77.1% of them are naturalized citizens)
This zip code:
24.0%
Whole state:
18.0%
29%Iraq
12%Sweden
10%Chile
8%Syria
7%Japan
6%Serbia
5%Bhutan
7%German
5%Italian
5%Lithuanian
5%Norwegian
5%Eastern European
5%Irish
4%Scotch-Irish
Year of entry for the foreign-born population
882010 or later
862000 to 2009
951990 to 1999
61Before 1990
Facilities with environmental interests located in this zip code:
MBTA RIVERSIDE CAR HOUSE (325 GROVE STREET in NEWTON, MA)
AIR MINOR (AIRS/AFS) CRITERIA AND HAZARDOUS AIR POLLUTANT INVENTORY (Inventory of air pollution sources) National Pollutant Discharge Elimination System NON-MAJOR (Tracking pollutant discharge elimination systems) - permit Small Quantity Generators, between 100 kg and 1000 kg of hazardous waste/month (Resource Conservation and Recovery Act (tracking hazardous waste)) - notification Business SIC classification: LOCAL AND SUBURBAN TRANSIT Organizations: MA BAY TRANSPORTATION AUTHORITY (CONTACT/OPERATOR)
, MASS BAY TRANSPORTATION AUTH (CONTACT/OWNER)
Alternative names: M B T A RIVERSIDE CARHOUSE, MA BAY TRANSPORTATION AUTHORITY, MBTA RIVERSIDE CARHO, MBTA - RIVERSIDE CARHOUSE, MBTARIVERSIDE
NEWTON WELLESLEY HOSPITAL (2014 WASHINGTON STREET in NEWTON, MA)
AIR SYNTHETIC MINOR (AIRS/AFS) CRITERIA AND HAZARDOUS AIR POLLUTANT INVENTORY (Inventory of air pollution sources) HAZARDOUS WASTE BIENNIAL REPORTER (Resource Conservation and Recovery Act (tracking hazardous waste)) Large Quantity Generators, more that 1000 kg of hazardous waste/month (Resource Conservation and Recovery Act (tracking hazardous waste)) - notification Business SIC classification: GENERAL MEDICAL AND SURGICAL HOSPITALS Organizations: NEWTON WELLESLEY HEALTHCARE SYSTEM (CONTACT/OPERATOR)
DONS REPAIR (2322 WASHINGTON ST in NEWTON, MA)
(Resource Conservation and Recovery Act (tracking hazardous waste))
AMERICAN DURAFILM CO INC (2300 WASHINGTON ST in NEWTON, MA)
ALGONQUIN GAS TRANSMISSION CO (QUINOBEQUIN RD in NEWTON, MA)
Small Quantity Generators, between 100 kg and 1000 kg of hazardous waste/month (Resource Conservation and Recovery Act (tracking hazardous waste)) - notification Organizations: ALGONQUIN GAS TRANSMISSION CO VALVE J10 (CONTACT/OPERATOR)
, ALGONQUIN GAS TRANSMISSION COMPANY (CONTACT/OWNER)
Alternative names: ALGONQUIN GAS TRANSMISSION CO VALVE J10
OLD TIME GARAGE LIMITED (1960 WASHINGTON ST in NEWTON, MA)
Conditionally Exempt Small Quantity Generators, less than 100 kg/month of hazardous waste (Resource Conservation and Recovery Act (tracking hazardous waste)) - notification Organizations: WILLIAM HURWITZ (CONTACT/OWNER)
Housing units lacking complete kitchen facilities: 3.5%
55.0%Utility gas
25.9%Fuel oil, kerosene, etc.
16.5%Electricity
3.3%Other fuel
Place of birth for U.S.-born residents:
This state: 706
Northeast: 184
Midwest: 50
South: 141
West: 22
66% of the 02462 zip code residents lived in the same house 5 years ago. Out of people who lived in different houses, 56% lived in this county. Out of people who lived in different counties, 50% lived in Massachusetts.
88% of the 02462 zip code residents lived in the same house 1 year ago. Out of people who lived in different houses, 33% moved from this county. Out of people who lived in different houses, 62% moved from different county within same state. Out of people who lived in different houses, 4% moved from different state.
Private vs. public school enrollment:
Students in private schools in grades 1 to 8 (elementary and middle school): 20
Here:
19.2%
Massachusetts:
10.3%
Students in private schools in grades 9 to 12 (high school):
Here:
0.0%
Massachusetts:
12.3%
Students in private undergraduate colleges: 25
Here:
42.2%
Massachusetts:
51.2%
Occupation by median earnings in the past 12 months ($)
183,814Management occupations
110,552Business and financial operations occupations
109,699Health diagnosing and treating practitioners and other technical occupations
73,080Architecture and engineering occupations
45,754Sales and related occupations
33,166Education, training, and library occupations
Companies with federal contracts located in this zip code:
RADIO SERVICES INC (25 LAFAYETTE RD in NEWTON, MA; small business) : $1,080,441 in 15 contractsfrom 2001 to 2006
Contracts for Maintenance, Repair and Rebuilding of Equipment -- Communication, Detection, and Coherent Radiation Equipment, Miscellaneous Communication Equipment by Air Force Signed by year:2000: $0; 2001: $508,194; 2002: $524,708; 2003: $23,580; 2004: $17,500; 2005: -$2,676; 2006: $9,135.
Biggest contracts:
$285,000 with Air Force for Maintenance, Repair and Rebuilding of Equipment -- Communication, Detection, and Coherent Radiation Equipment. Signed on 2002-10-01. Completion date: 2003-09-30.
$285,000, same as above.Signed on 2001-10-01. Completion date: 2002-09-30.
$255,708, same as above.Signed on 2002-10-01. Completion date: 2003-09-30.
$196,194, same as above.Signed on 2001-10-01. Completion date: 2002-09-30.
Top industries in this zip code by the number of employees in 2005:
Administrative and Support and Waste Management and Remediation Services: Facilities Support Services (over 1000 employees: 1 establishment)
Health Care and Social Assistance: General Medical and Surgical Hospitals (over 1000: 1)
Health Care and Social Assistance: Offices of Physicians (except Mental Health Specialists) (20-49: 7, 10-19: 10, 5-9: 11, 1-4: 26)
Accommodation and Food Services: Food Service Contractors (250-499: 1)
Real Estate and Rental and Leasing: Residential Property Managers (250-499: 1)
Health Care and Social Assistance: Nursing Care Facilities (100-249: 1)
Professional, Scientific, and Technical Services: Payroll Services (100-249: 1)
Finance and Insurance: Direct Health and Medical Insurance Carriers (50-99: 1, 10-19: 1, 1-4: 1)
Construction: Commercial and Institutional Building Construction (50-99: 1, 10-19: 1)
Accommodation and Food Services: Hotels (except Casino Hotels) and Motels (50-99: 1, 1-4: 1)
People in group quarters in 2010:
100 people in nursing facilities/skilled-nursing facilities
People in group quarters in 2000:
180 people in nursing homes
Fatal accident statistics in 2013:
Fatal accident count: 1
Vehicles involved in fatal accidents: 2
Fatal accidents caused by drunken drivers: 0
Fatalities: 1
Persons involved in fatal accidents: 2
Pedestrians involved in fatal accidents: 1
Home Mortgage Disclosure Act Aggregated Statistics For Year 2009 (Based on 2 partial tracts)
A) FHA, FSA/RHS & VA Home Purchase Loans
B) Conventional Home Purchase Loans
C) Refinancings
D) Home Improvement Loans
F) Non-occupant Loans on < 5 Family Dwellings (A B C & D)
Number
Average Value
Number
Average Value
Number
Average Value
Number
Average Value
Number
Average Value
LOANS ORIGINATED
2
$549,115
28
$428,950
121
$381,499
6
$261,892
4
$550,185
APPLICATIONS APPROVED, NOT ACCEPTED
0
$0
1
$292,580
4
$353,052
0
$0
0
$0
APPLICATIONS DENIED
0
$0
2
$770,690
20
$421,024
1
$570,880
3
$437,673
APPLICATIONS WITHDRAWN
0
$0
2
$427,445
13
$461,425
0
$0
1
$1,070,400
FILES CLOSED FOR INCOMPLETENESS
0
$0
3
$437,673
5
$305,136
0
$0
1
$570,880
Aggregated Statistics For Year 2008 (Based on 2 partial tracts)
A) FHA, FSA/RHS & VA Home Purchase Loans
B) Conventional Home Purchase Loans
C) Refinancings
D) Home Improvement Loans
F) Non-occupant Loans on < 5 Family Dwellings (A B C & D)
Number
Average Value
Number
Average Value
Number
Average Value
Number
Average Value
Number
Average Value
LOANS ORIGINATED
1
$394,620
17
$493,265
43
$404,993
1
$239,060
1
$1,584,910
APPLICATIONS APPROVED, NOT ACCEPTED
0
$0
1
$740,000
6
$372,262
1
$167,700
1
$129,880
APPLICATIONS DENIED
1
$406,750
3
$367,980
7
$530,103
1
$107,040
1
$1,698,370
APPLICATIONS WITHDRAWN
0
$0
1
$542,340
4
$410,678
2
$177,330
0
$0
FILES CLOSED FOR INCOMPLETENESS
0
$0
0
$0
3
$1,095,137
1
$149,860
0
$0
Aggregated Statistics For Year 2007 (Based on 2 partial tracts)
B) Conventional Home Purchase Loans
C) Refinancings
D) Home Improvement Loans
F) Non-occupant Loans on < 5 Family Dwellings (A B C & D)
Number
Average Value
Number
Average Value
Number
Average Value
Number
Average Value
LOANS ORIGINATED
24
$394,770
31
$407,765
5
$43,672
3
$378,447
APPLICATIONS APPROVED, NOT ACCEPTED
5
$404,468
4
$344,490
1
$10,700
0
$0
APPLICATIONS DENIED
1
$508,800
4
$239,055
1
$3,570
1
$192,670
APPLICATIONS WITHDRAWN
3
$489,293
4
$449,390
0
$0
1
$192,670
FILES CLOSED FOR INCOMPLETENESS
0
$0
1
$463,840
0
$0
0
$0
Aggregated Statistics For Year 2006 (Based on 2 partial tracts)
B) Conventional Home Purchase Loans
C) Refinancings
D) Home Improvement Loans
E) Loans on Dwellings For 5+ Families
F) Non-occupant Loans on < 5 Family Dwellings (A B C & D)
G) Loans On Manufactured Home Dwelling (A B C & D)
Number
Average Value
Number
Average Value
Number
Average Value
Number
Average Value
Number
Average Value
Number
Average Value
LOANS ORIGINATED
47
$386,513
37
$324,958
8
$325,848
0
$0
6
$605,490
0
$0
APPLICATIONS APPROVED, NOT ACCEPTED
6
$452,780
8
$326,740
0
$0
0
$0
1
$545,900
0
$0
APPLICATIONS DENIED
6
$210,512
7
$345,790
3
$29,497
0
$0
0
$0
1
$35,680
APPLICATIONS WITHDRAWN
4
$370,892
8
$265,905
1
$71,360
1
$10,704,000
0
$0
0
$0
FILES CLOSED FOR INCOMPLETENESS
1
$297,570
1
$285,440
0
$0
0
$0
0
$0
0
$0
Aggregated Statistics For Year 2005 (Based on 2 partial tracts)
B) Conventional Home Purchase Loans
C) Refinancings
D) Home Improvement Loans
F) Non-occupant Loans on < 5 Family Dwellings (A B C & D)
Number
Average Value
Number
Average Value
Number
Average Value
Number
Average Value
LOANS ORIGINATED
31
$380,142
51
$360,942
4
$150,212
4
$291,505
APPLICATIONS APPROVED, NOT ACCEPTED
2
$458,845
6
$330,635
0
$0
1
$313,980
APPLICATIONS DENIED
6
$374,640
8
$336,284
1
$264,030
4
$352,340
APPLICATIONS WITHDRAWN
3
$541,623
14
$392,480
1
$321,120
0
$0
FILES CLOSED FOR INCOMPLETENESS
0
$0
3
$292,577
0
$0
0
$0
Aggregated Statistics For Year 2004 (Based on 2 partial tracts)
B) Conventional Home Purchase Loans
C) Refinancings
D) Home Improvement Loans
E) Loans on Dwellings For 5+ Families
F) Non-occupant Loans on < 5 Family Dwellings (A B C & D)
Number
Average Value
Number
Average Value
Number
Average Value
Number
Average Value
Number
Average Value
LOANS ORIGINATED
41
$431,136
54
$306,650
6
$316,125
1
$428,160
5
$277,876
APPLICATIONS APPROVED, NOT ACCEPTED
3
$513,317
6
$335,868
1
$142,720
0
$0
0
$0
APPLICATIONS DENIED
5
$319,836
6
$466,218
1
$185,540
0
$0
0
$0
APPLICATIONS WITHDRAWN
0
$0
7
$340,081
1
$149,860
0
$0
0
$0
FILES CLOSED FOR INCOMPLETENESS
3
$470,263
4
$365,362
0
$0
0
$0
0
$0
Aggregated Statistics For Year 2003 (Based on 2 partial tracts)
B) Conventional Home Purchase Loans
C) Refinancings
D) Home Improvement Loans
F) Non-occupant Loans on < 5 Family Dwellings (A B C & D)
Number
Average Value
Number
Average Value
Number
Average Value
Number
Average Value
LOANS ORIGINATED
31
$407,443
216
$288,400
2
$85,990
6
$315,412
APPLICATIONS APPROVED, NOT ACCEPTED
2
$503,800
14
$240,789
1
$107,040
0
$0
APPLICATIONS DENIED
3
$255,943
24
$287,016
1
$353,230
1
$275,450
APPLICATIONS WITHDRAWN
5
$295,002
12
$232,337
0
$0
1
$224,780
FILES CLOSED FOR INCOMPLETENESS
2
$274,020
3
$265,460
0
$0
0
$0
Aggregated Statistics For Year 2002 (Based on 2 partial tracts)
B) Conventional Home Purchase Loans
C) Refinancings
D) Home Improvement Loans
F) Non-occupant Loans on < 5 Family Dwellings (A B C & D)
Number
Average Value
Number
Average Value
Number
Average Value
Number
Average Value
LOANS ORIGINATED
31
$350,055
138
$288,134
6
$140,817
4
$250,295
APPLICATIONS APPROVED, NOT ACCEPTED
5
$427,160
13
$247,070
2
$124,880
0
$0
APPLICATIONS DENIED
2
$341,100
14
$316,584
3
$117,030
2
$296,500
APPLICATIONS WITHDRAWN
3
$1,062,313
13
$344,724
1
$10,700
0
$0
FILES CLOSED FOR INCOMPLETENESS
1
$417,460
1
$551,610
0
$0
0
$0
Aggregated Statistics For Year 2001 (Based on 2 partial tracts)
B) Conventional Home Purchase Loans
C) Refinancings
D) Home Improvement Loans
F) Non-occupant Loans on < 5 Family Dwellings (A B C & D)
Number
Average Value
Number
Average Value
Number
Average Value
Number
Average Value
LOANS ORIGINATED
41
$360,977
78
$260,958
4
$42,995
3
$319,453
APPLICATIONS APPROVED, NOT ACCEPTED
5
$355,230
14
$286,256
1
$78,500
1
$338,960
APPLICATIONS DENIED
6
$267,362
10
$207,872
4
$105,612
1
$10,700
APPLICATIONS WITHDRAWN
1
$600,850
8
$285,261
0
$0
1
$160,560
FILES CLOSED FOR INCOMPLETENESS
0
$0
1
$171,260
0
$0
0
$0
Aggregated Statistics For Year 2000 (Based on 2 partial tracts)
B) Conventional Home Purchase Loans
C) Refinancings
D) Home Improvement Loans
F) Non-occupant Loans on < 5 Family Dwellings (A B C & D)
Number
Average Value
Number
Average Value
Number
Average Value
Number
Average Value
LOANS ORIGINATED
16
$240,082
11
$271,363
1
$214,080
0
$0
APPLICATIONS APPROVED, NOT ACCEPTED
2
$249,760
4
$171,442
1
$28,540
1
$154,140
APPLICATIONS DENIED
1
$28,540
4
$324,688
1
$10,700
0
$0
APPLICATIONS WITHDRAWN
0
$0
3
$180,780
1
$64,220
0
$0
FILES CLOSED FOR INCOMPLETENESS
0
$0
0
$0
0
$0
0
$0
Aggregated Statistics For Year 1999 (Based on 1 partial tract)
B) Conventional Home Purchase Loans
C) Refinancings
D) Home Improvement Loans
F) Non-occupant Loans on < 5 Family Dwellings (A B C & D)
Detailed PMIC statistics for the following Tracts:3748.00
2002 - 2018 National Fire Incident Reporting System (NFIRS) incidents
According to the data from the years 2002 - 2018 the average number of fires per year is 6. The highest number of fires - 14 took place in 2003, and the least - 1 in 2010. The data has a growing trend.
When looking into fire subcategories, the most incidents belonged to: Structure Fires (52.8%), and Outside Fires (24.1%).
Fire incident types reported to NFIRS in Zip Code 02462


 Nearest zip codes: 02466, 02481, 02468, 02457, 02465, 02494.


 According to the data from the years 2002 - 2018 the average number of fires per year is 6. The highest number of fires - 14 took place in 2003, and the least - 1 in 2010. The data has a growing trend.
 When looking into fire subcategories, the most incidents belonged to: Structure Fires (52.8%), and Outside Fires (24.1%).