Taft, California Submit your own pictures of this city and show them to the world
OSM Map
General Map
Google Map
MSN Map
OSM Map
General Map
Google Map
MSN Map
OSM Map
General Map
Google Map
MSN Map
OSM Map
General Map
Google Map
MSN Map
Please wait while loading the map...
Population in 2022: 7,034 (99% urban, 1% rural). Population change since 2000: +9.9%Males: 3,598 Females: 3,436
March 2022 cost of living index in Taft: 91.2 (less than average, U.S. average is 100) Percentage of residents living in poverty in 2022: 21.8%for White Non-Hispanic residents , 100.0% for Black residents , 32.7% for Hispanic or Latino residents , 18.1% for other race residents , 38.4% for two or more races residents )
Profiles of local businesses
Business Search - 14 Million verified businesses
Data:
Median household income ($)
Median household income (% change since 2000)
Household income diversity
Ratio of average income to average house value (%)
Ratio of average income to average rent
Median household income ($) - White
Median household income ($) - Black or African American
Median household income ($) - Asian
Median household income ($) - Hispanic or Latino
Median household income ($) - American Indian and Alaska Native
Median household income ($) - Multirace
Median household income ($) - Other Race
Median household income for houses/condos with a mortgage ($)
Median household income for apartments without a mortgage ($)
Races - White alone (%)
Races - White alone (% change since 2000)
Races - Black alone (%)
Races - Black alone (% change since 2000)
Races - American Indian alone (%)
Races - American Indian alone (% change since 2000)
Races - Asian alone (%)
Races - Asian alone (% change since 2000)
Races - Hispanic (%)
Races - Hispanic (% change since 2000)
Races - Native Hawaiian and Other Pacific Islander alone (%)
Races - Native Hawaiian and Other Pacific Islander alone (% change since 2000)
Races - Two or more races (%)
Races - Two or more races (% change since 2000)
Races - Other race alone (%)
Races - Other race alone (% change since 2000)
Racial diversity
Unemployment (%)
Unemployment (% change since 2000)
Unemployment (%) - White
Unemployment (%) - Black or African American
Unemployment (%) - Asian
Unemployment (%) - Hispanic or Latino
Unemployment (%) - American Indian and Alaska Native
Unemployment (%) - Multirace
Unemployment (%) - Other Race
Population density (people per square mile)
Population - Males (%)
Population - Females (%)
Population - Males (%) - White
Population - Males (%) - Black or African American
Population - Males (%) - Asian
Population - Males (%) - Hispanic or Latino
Population - Males (%) - American Indian and Alaska Native
Population - Males (%) - Multirace
Population - Males (%) - Other Race
Population - Females (%) - White
Population - Females (%) - Black or African American
Population - Females (%) - Asian
Population - Females (%) - Hispanic or Latino
Population - Females (%) - American Indian and Alaska Native
Population - Females (%) - Multirace
Population - Females (%) - Other Race
Coronavirus confirmed cases (Jun 08, 2024)
Deaths caused by coronavirus (Jun 08, 2024)
Coronavirus confirmed cases (per 100k population) (Jun 08, 2024)
Deaths caused by coronavirus (per 100k population) (Jun 08, 2024)
Daily increase in number of cases (Jun 08, 2024)
Weekly increase in number of cases (Jun 08, 2024)
Cases doubled (in days) (Jun 08, 2024)
Hospitalized patients (Apr 18, 2022)
Negative test results (Apr 18, 2022)
Total test results (Apr 18, 2022)
COVID Vaccine doses distributed (per 100k population) (Sep 19, 2023)
COVID Vaccine doses administered (per 100k population) (Sep 19, 2023)
COVID Vaccine doses distributed (Sep 19, 2023)
COVID Vaccine doses administered (Sep 19, 2023)
Likely homosexual households (%)
Likely homosexual households (% change since 2000)
Likely homosexual households - Lesbian couples (%)
Likely homosexual households - Lesbian couples (% change since 2000)
Likely homosexual households - Gay men (%)
Likely homosexual households - Gay men (% change since 2000)
Cost of living index
Median gross rent ($)
Median contract rent ($)
Median monthly housing costs ($)
Median house or condo value ($)
Median house or condo value ($ change since 2000)
Mean house or condo value by units in structure - 1, detached ($)
Mean house or condo value by units in structure - 1, attached ($)
Mean house or condo value by units in structure - 2 ($)
Mean house or condo value by units in structure by units in structure - 3 or 4 ($)
Mean house or condo value by units in structure - 5 or more ($)
Mean house or condo value by units in structure - Boat, RV, van, etc. ($)
Mean house or condo value by units in structure - Mobile home ($)
Median house or condo value ($) - White
Median house or condo value ($) - Black or African American
Median house or condo value ($) - Asian
Median house or condo value ($) - Hispanic or Latino
Median house or condo value ($) - American Indian and Alaska Native
Median house or condo value ($) - Multirace
Median house or condo value ($) - Other Race
Median resident age
Resident age diversity
Median resident age - Males
Median resident age - Females
Median resident age - White
Median resident age - Black or African American
Median resident age - Asian
Median resident age - Hispanic or Latino
Median resident age - American Indian and Alaska Native
Median resident age - Multirace
Median resident age - Other Race
Median resident age - Males - White
Median resident age - Males - Black or African American
Median resident age - Males - Asian
Median resident age - Males - Hispanic or Latino
Median resident age - Males - American Indian and Alaska Native
Median resident age - Males - Multirace
Median resident age - Males - Other Race
Median resident age - Females - White
Median resident age - Females - Black or African American
Median resident age - Females - Asian
Median resident age - Females - Hispanic or Latino
Median resident age - Females - American Indian and Alaska Native
Median resident age - Females - Multirace
Median resident age - Females - Other Race
Commute - mean travel time to work (minutes)
Travel time to work - Less than 5 minutes (%)
Travel time to work - Less than 5 minutes (% change since 2000)
Travel time to work - 5 to 9 minutes (%)
Travel time to work - 5 to 9 minutes (% change since 2000)
Travel time to work - 10 to 19 minutes (%)
Travel time to work - 10 to 19 minutes (% change since 2000)
Travel time to work - 20 to 29 minutes (%)
Travel time to work - 20 to 29 minutes (% change since 2000)
Travel time to work - 30 to 39 minutes (%)
Travel time to work - 30 to 39 minutes (% change since 2000)
Travel time to work - 40 to 59 minutes (%)
Travel time to work - 40 to 59 minutes (% change since 2000)
Travel time to work - 60 to 89 minutes (%)
Travel time to work - 60 to 89 minutes (% change since 2000)
Travel time to work - 90 or more minutes (%)
Travel time to work - 90 or more minutes (% change since 2000)
Marital status - Never married (%)
Marital status - Now married (%)
Marital status - Separated (%)
Marital status - Widowed (%)
Marital status - Divorced (%)
Median family income ($)
Median family income (% change since 2000)
Median non-family income ($)
Median non-family income (% change since 2000)
Median per capita income ($)
Median per capita income (% change since 2000)
Median family income ($) - White
Median family income ($) - Black or African American
Median family income ($) - Asian
Median family income ($) - Hispanic or Latino
Median family income ($) - American Indian and Alaska Native
Median family income ($) - Multirace
Median family income ($) - Other Race
Median year house/condo built
Median year apartment built
Year house built - Built 2005 or later (%)
Year house built - Built 2000 to 2004 (%)
Year house built - Built 1990 to 1999 (%)
Year house built - Built 1980 to 1989 (%)
Year house built - Built 1970 to 1979 (%)
Year house built - Built 1960 to 1969 (%)
Year house built - Built 1950 to 1959 (%)
Year house built - Built 1940 to 1949 (%)
Year house built - Built 1939 or earlier (%)
Average household size
Household density (households per square mile)
Average household size - White
Average household size - Black or African American
Average household size - Asian
Average household size - Hispanic or Latino
Average household size - American Indian and Alaska Native
Average household size - Multirace
Average household size - Other Race
Occupied housing units (%)
Vacant housing units (%)
Owner occupied housing units (%)
Renter occupied housing units (%)
Vacancy status - For rent (%)
Vacancy status - For sale only (%)
Vacancy status - Rented or sold, not occupied (%)
Vacancy status - For seasonal, recreational, or occasional use (%)
Vacancy status - For migrant workers (%)
Vacancy status - Other vacant (%)
Residents with income below the poverty level (%)
Residents with income below 50% of the poverty level (%)
Children below poverty level (%)
Poor families by family type - Married-couple family (%)
Poor families by family type - Male, no wife present (%)
Poor families by family type - Female, no husband present (%)
Poverty status for native-born residents (%)
Poverty status for foreign-born residents (%)
Poverty among high school graduates not in families (%)
Poverty among people who did not graduate high school not in families (%)
Residents with income below the poverty level (%) - White
Residents with income below the poverty level (%) - Black or African American
Residents with income below the poverty level (%) - Asian
Residents with income below the poverty level (%) - Hispanic or Latino
Residents with income below the poverty level (%) - American Indian and Alaska Native
Residents with income below the poverty level (%) - Multirace
Residents with income below the poverty level (%) - Other Race
Air pollution - Air Quality Index (AQI)
Air pollution - CO
Air pollution - NO2
Air pollution - SO2
Air pollution - Ozone
Air pollution - PM10
Air pollution - PM25
Air pollution - Pb
Crime - Murders per 100,000 population
Crime - Rapes per 100,000 population
Crime - Robberies per 100,000 population
Crime - Assaults per 100,000 population
Crime - Burglaries per 100,000 population
Crime - Thefts per 100,000 population
Crime - Auto thefts per 100,000 population
Crime - Arson per 100,000 population
Crime - City-data.com crime index
Crime - Violent crime index
Crime - Property crime index
Crime - Murders per 100,000 population (5 year average)
Crime - Rapes per 100,000 population (5 year average)
Crime - Robberies per 100,000 population (5 year average)
Crime - Assaults per 100,000 population (5 year average)
Crime - Burglaries per 100,000 population (5 year average)
Crime - Thefts per 100,000 population (5 year average)
Crime - Auto thefts per 100,000 population (5 year average)
Crime - Arson per 100,000 population (5 year average)
Crime - City-data.com crime index (5 year average)
Crime - Violent crime index (5 year average)
Crime - Property crime index (5 year average)
1996 Presidential Elections Results (%) - Democratic Party (Clinton)
1996 Presidential Elections Results (%) - Republican Party (Dole)
1996 Presidential Elections Results (%) - Other
2000 Presidential Elections Results (%) - Democratic Party (Gore)
2000 Presidential Elections Results (%) - Republican Party (Bush)
2000 Presidential Elections Results (%) - Other
2004 Presidential Elections Results (%) - Democratic Party (Kerry)
2004 Presidential Elections Results (%) - Republican Party (Bush)
2004 Presidential Elections Results (%) - Other
2008 Presidential Elections Results (%) - Democratic Party (Obama)
2008 Presidential Elections Results (%) - Republican Party (McCain)
2008 Presidential Elections Results (%) - Other
2012 Presidential Elections Results (%) - Democratic Party (Obama)
2012 Presidential Elections Results (%) - Republican Party (Romney)
2012 Presidential Elections Results (%) - Other
2016 Presidential Elections Results (%) - Democratic Party (Clinton)
2016 Presidential Elections Results (%) - Republican Party (Trump)
2016 Presidential Elections Results (%) - Other
2020 Presidential Elections Results (%) - Democratic Party (Biden)
2020 Presidential Elections Results (%) - Republican Party (Trump)
2020 Presidential Elections Results (%) - Other
Ancestries Reported - Arab (%)
Ancestries Reported - Czech (%)
Ancestries Reported - Danish (%)
Ancestries Reported - Dutch (%)
Ancestries Reported - English (%)
Ancestries Reported - French (%)
Ancestries Reported - French Canadian (%)
Ancestries Reported - German (%)
Ancestries Reported - Greek (%)
Ancestries Reported - Hungarian (%)
Ancestries Reported - Irish (%)
Ancestries Reported - Italian (%)
Ancestries Reported - Lithuanian (%)
Ancestries Reported - Norwegian (%)
Ancestries Reported - Polish (%)
Ancestries Reported - Portuguese (%)
Ancestries Reported - Russian (%)
Ancestries Reported - Scotch-Irish (%)
Ancestries Reported - Scottish (%)
Ancestries Reported - Slovak (%)
Ancestries Reported - Subsaharan African (%)
Ancestries Reported - Swedish (%)
Ancestries Reported - Swiss (%)
Ancestries Reported - Ukrainian (%)
Ancestries Reported - United States (%)
Ancestries Reported - Welsh (%)
Ancestries Reported - West Indian (%)
Ancestries Reported - Other (%)
Educational Attainment - No schooling completed (%)
Educational Attainment - Less than high school (%)
Educational Attainment - High school or equivalent (%)
Educational Attainment - Less than 1 year of college (%)
Educational Attainment - 1 or more years of college (%)
Educational Attainment - Associate degree (%)
Educational Attainment - Bachelor's degree (%)
Educational Attainment - Master's degree (%)
Educational Attainment - Professional school degree (%)
Educational Attainment - Doctorate degree (%)
School Enrollment - Nursery, preschool (%)
School Enrollment - Kindergarten (%)
School Enrollment - Grade 1 to 4 (%)
School Enrollment - Grade 5 to 8 (%)
School Enrollment - Grade 9 to 12 (%)
School Enrollment - College undergrad (%)
School Enrollment - Graduate or professional (%)
School Enrollment - Not enrolled in school (%)
School enrollment - Public schools (%)
School enrollment - Private schools (%)
School enrollment - Not enrolled (%)
Median number of rooms in houses and condos
Median number of rooms in apartments
Housing units lacking complete plumbing facilities (%)
Housing units lacking complete kitchen facilities (%)
Density of houses
Urban houses (%)
Rural houses (%)
Households with people 60 years and over (%)
Households with people 65 years and over (%)
Households with people 75 years and over (%)
Households with one or more nonrelatives (%)
Households with no nonrelatives (%)
Population in households (%)
Family households (%)
Nonfamily households (%)
Population in families (%)
Family households with own children (%)
Median number of bedrooms in owner occupied houses
Mean number of bedrooms in owner occupied houses
Median number of bedrooms in renter occupied houses
Mean number of bedrooms in renter occupied houses
Median number of vehichles in owner occupied houses
Mean number of vehichles in owner occupied houses
Median number of vehichles in renter occupied houses
Mean number of vehichles in renter occupied houses
Mortgage status - with mortgage (%)
Mortgage status - with second mortgage (%)
Mortgage status - with home equity loan (%)
Mortgage status - with both second mortgage and home equity loan (%)
Mortgage status - without a mortgage (%)
Average family size
Average family size - White
Average family size - Black or African American
Average family size - Asian
Average family size - Hispanic or Latino
Average family size - American Indian and Alaska Native
Average family size - Multirace
Average family size - Other Race
Geographical mobility - Same house 1 year ago (%)
Geographical mobility - Moved within same county (%)
Geographical mobility - Moved from different county within same state (%)
Geographical mobility - Moved from different state (%)
Geographical mobility - Moved from abroad (%)
Place of birth - Born in state of residence (%)
Place of birth - Born in other state (%)
Place of birth - Native, outside of US (%)
Place of birth - Foreign born (%)
Housing units in structures - 1, detached (%)
Housing units in structures - 1, attached (%)
Housing units in structures - 2 (%)
Housing units in structures - 3 or 4 (%)
Housing units in structures - 5 to 9 (%)
Housing units in structures - 10 to 19 (%)
Housing units in structures - 20 to 49 (%)
Housing units in structures - 50 or more (%)
Housing units in structures - Mobile home (%)
Housing units in structures - Boat, RV, van, etc. (%)
House/condo owner moved in on average (years ago)
Renter moved in on average (years ago)
Year householder moved into unit - Moved in 1999 to March 2000 (%)
Year householder moved into unit - Moved in 1995 to 1998 (%)
Year householder moved into unit - Moved in 1990 to 1994 (%)
Year householder moved into unit - Moved in 1980 to 1989 (%)
Year householder moved into unit - Moved in 1970 to 1979 (%)
Year householder moved into unit - Moved in 1969 or earlier (%)
Means of transportation to work - Drove car alone (%)
Means of transportation to work - Carpooled (%)
Means of transportation to work - Public transportation (%)
Means of transportation to work - Bus or trolley bus (%)
Means of transportation to work - Streetcar or trolley car (%)
Means of transportation to work - Subway or elevated (%)
Means of transportation to work - Railroad (%)
Means of transportation to work - Ferryboat (%)
Means of transportation to work - Taxicab (%)
Means of transportation to work - Motorcycle (%)
Means of transportation to work - Bicycle (%)
Means of transportation to work - Walked (%)
Means of transportation to work - Other means (%)
Working at home (%)
Industry diversity
Most Common Industries - Agriculture, forestry, fishing and hunting, and mining (%)
Most Common Industries - Agriculture, forestry, fishing and hunting (%)
Most Common Industries - Mining, quarrying, and oil and gas extraction (%)
Most Common Industries - Construction (%)
Most Common Industries - Manufacturing (%)
Most Common Industries - Wholesale trade (%)
Most Common Industries - Retail trade (%)
Most Common Industries - Transportation and warehousing, and utilities (%)
Most Common Industries - Transportation and warehousing (%)
Most Common Industries - Utilities (%)
Most Common Industries - Information (%)
Most Common Industries - Finance and insurance, and real estate and rental and leasing (%)
Most Common Industries - Finance and insurance (%)
Most Common Industries - Real estate and rental and leasing (%)
Most Common Industries - Professional, scientific, and management, and administrative and waste management services (%)
Most Common Industries - Professional, scientific, and technical services (%)
Most Common Industries - Management of companies and enterprises (%)
Most Common Industries - Administrative and support and waste management services (%)
Most Common Industries - Educational services, and health care and social assistance (%)
Most Common Industries - Educational services (%)
Most Common Industries - Health care and social assistance (%)
Most Common Industries - Arts, entertainment, and recreation, and accommodation and food services (%)
Most Common Industries - Arts, entertainment, and recreation (%)
Most Common Industries - Accommodation and food services (%)
Most Common Industries - Other services, except public administration (%)
Most Common Industries - Public administration (%)
Occupation diversity
Most Common Occupations - Management, business, science, and arts occupations (%)
Most Common Occupations - Management, business, and financial occupations (%)
Most Common Occupations - Management occupations (%)
Most Common Occupations - Business and financial operations occupations (%)
Most Common Occupations - Computer, engineering, and science occupations (%)
Most Common Occupations - Computer and mathematical occupations (%)
Most Common Occupations - Architecture and engineering occupations (%)
Most Common Occupations - Life, physical, and social science occupations (%)
Most Common Occupations - Education, legal, community service, arts, and media occupations (%)
Most Common Occupations - Community and social service occupations (%)
Most Common Occupations - Legal occupations (%)
Most Common Occupations - Education, training, and library occupations (%)
Most Common Occupations - Arts, design, entertainment, sports, and media occupations (%)
Most Common Occupations - Healthcare practitioners and technical occupations (%)
Most Common Occupations - Health diagnosing and treating practitioners and other technical occupations (%)
Most Common Occupations - Health technologists and technicians (%)
Most Common Occupations - Service occupations (%)
Most Common Occupations - Healthcare support occupations (%)
Most Common Occupations - Protective service occupations (%)
Most Common Occupations - Fire fighting and prevention, and other protective service workers including supervisors (%)
Most Common Occupations - Law enforcement workers including supervisors (%)
Most Common Occupations - Food preparation and serving related occupations (%)
Most Common Occupations - Building and grounds cleaning and maintenance occupations (%)
Most Common Occupations - Personal care and service occupations (%)
Most Common Occupations - Sales and office occupations (%)
Most Common Occupations - Sales and related occupations (%)
Most Common Occupations - Office and administrative support occupations (%)
Most Common Occupations - Natural resources, construction, and maintenance occupations (%)
Most Common Occupations - Farming, fishing, and forestry occupations (%)
Most Common Occupations - Construction and extraction occupations (%)
Most Common Occupations - Installation, maintenance, and repair occupations (%)
Most Common Occupations - Production, transportation, and material moving occupations (%)
Most Common Occupations - Production occupations (%)
Most Common Occupations - Transportation occupations (%)
Most Common Occupations - Material moving occupations (%)
People in Group quarters - Institutionalized population (%)
People in Group quarters - Correctional institutions (%)
People in Group quarters - Federal prisons and detention centers (%)
People in Group quarters - Halfway houses (%)
People in Group quarters - Local jails and other confinement facilities (including police lockups) (%)
People in Group quarters - Military disciplinary barracks (%)
People in Group quarters - State prisons (%)
People in Group quarters - Other types of correctional institutions (%)
People in Group quarters - Nursing homes (%)
People in Group quarters - Hospitals/wards, hospices, and schools for the handicapped (%)
People in Group quarters - Hospitals/wards and hospices for chronically ill (%)
People in Group quarters - Hospices or homes for chronically ill (%)
People in Group quarters - Military hospitals or wards for chronically ill (%)
People in Group quarters - Other hospitals or wards for chronically ill (%)
People in Group quarters - Hospitals or wards for drug/alcohol abuse (%)
People in Group quarters - Mental (Psychiatric) hospitals or wards (%)
People in Group quarters - Schools, hospitals, or wards for the mentally retarded (%)
People in Group quarters - Schools, hospitals, or wards for the physically handicapped (%)
People in Group quarters - Institutions for the deaf (%)
People in Group quarters - Institutions for the blind (%)
People in Group quarters - Orthopedic wards and institutions for the physically handicapped (%)
People in Group quarters - Wards in general hospitals for patients who have no usual home elsewhere (%)
People in Group quarters - Wards in military hospitals for patients who have no usual home elsewhere (%)
People in Group quarters - Juvenile institutions (%)
People in Group quarters - Long-term care (%)
People in Group quarters - Homes for abused, dependent, and neglected children (%)
People in Group quarters - Residential treatment centers for emotionally disturbed children (%)
People in Group quarters - Training schools for juvenile delinquents (%)
People in Group quarters - Short-term care, detention or diagnostic centers for delinquent children (%)
People in Group quarters - Type of juvenile institution unknown (%)
People in Group quarters - Noninstitutionalized population (%)
People in Group quarters - College dormitories (includes college quarters off campus) (%)
People in Group quarters - Military quarters (%)
People in Group quarters - On base (%)
People in Group quarters - Barracks, unaccompanied personnel housing (UPH), (Enlisted/Officer), ;and similar group living quarters for military personnel (%)
People in Group quarters - Transient quarters for temporary residents (%)
People in Group quarters - Military ships (%)
People in Group quarters - Group homes (%)
People in Group quarters - Homes or halfway houses for drug/alcohol abuse (%)
People in Group quarters - Homes for the mentally ill (%)
People in Group quarters - Homes for the mentally retarded (%)
People in Group quarters - Homes for the physically handicapped (%)
People in Group quarters - Other group homes (%)
People in Group quarters - Religious group quarters (%)
People in Group quarters - Dormitories (%)
People in Group quarters - Agriculture workers' dormitories on farms (%)
People in Group quarters - Job Corps and vocational training facilities (%)
People in Group quarters - Other workers' dormitories (%)
People in Group quarters - Crews of maritime vessels (%)
People in Group quarters - Other nonhousehold living situations (%)
People in Group quarters - Other noninstitutional group quarters (%)
Residents speaking English at home (%)
Residents speaking English at home - Born in the United States (%)
Residents speaking English at home - Native, born elsewhere (%)
Residents speaking English at home - Foreign born (%)
Residents speaking Spanish at home (%)
Residents speaking Spanish at home - Born in the United States (%)
Residents speaking Spanish at home - Native, born elsewhere (%)
Residents speaking Spanish at home - Foreign born (%)
Residents speaking other language at home (%)
Residents speaking other language at home - Born in the United States (%)
Residents speaking other language at home - Native, born elsewhere (%)
Residents speaking other language at home - Foreign born (%)
Class of Workers - Employee of private company (%)
Class of Workers - Self-employed in own incorporated business (%)
Class of Workers - Private not-for-profit wage and salary workers (%)
Class of Workers - Local government workers (%)
Class of Workers - State government workers (%)
Class of Workers - Federal government workers (%)
Class of Workers - Self-employed workers in own not incorporated business and Unpaid family workers (%)
House heating fuel used in houses and condos - Utility gas (%)
House heating fuel used in houses and condos - Bottled, tank, or LP gas (%)
House heating fuel used in houses and condos - Electricity (%)
House heating fuel used in houses and condos - Fuel oil, kerosene, etc. (%)
House heating fuel used in houses and condos - Coal or coke (%)
House heating fuel used in houses and condos - Wood (%)
House heating fuel used in houses and condos - Solar energy (%)
House heating fuel used in houses and condos - Other fuel (%)
House heating fuel used in houses and condos - No fuel used (%)
House heating fuel used in apartments - Utility gas (%)
House heating fuel used in apartments - Bottled, tank, or LP gas (%)
House heating fuel used in apartments - Electricity (%)
House heating fuel used in apartments - Fuel oil, kerosene, etc. (%)
House heating fuel used in apartments - Coal or coke (%)
House heating fuel used in apartments - Wood (%)
House heating fuel used in apartments - Solar energy (%)
House heating fuel used in apartments - Other fuel (%)
House heating fuel used in apartments - No fuel used (%)
Armed forces status - In Armed Forces (%)
Armed forces status - Civilian (%)
Armed forces status - Civilian - Veteran (%)
Armed forces status - Civilian - Nonveteran (%)
Fatal accidents locations in years 2005-2021
Fatal accidents locations in 2005
Fatal accidents locations in 2006
Fatal accidents locations in 2007
Fatal accidents locations in 2008
Fatal accidents locations in 2009
Fatal accidents locations in 2010
Fatal accidents locations in 2011
Fatal accidents locations in 2012
Fatal accidents locations in 2013
Fatal accidents locations in 2014
Fatal accidents locations in 2015
Fatal accidents locations in 2016
Fatal accidents locations in 2017
Fatal accidents locations in 2018
Fatal accidents locations in 2019
Fatal accidents locations in 2020
Fatal accidents locations in 2021
Alcohol use - People drinking some alcohol every month (%)
Alcohol use - People not drinking at all (%)
Alcohol use - Average days/month drinking alcohol
Alcohol use - Average drinks/week
Alcohol use - Average days/year people drink much
Audiometry - Average condition of hearing (%)
Audiometry - People that can hear a whisper from across a quiet room (%)
Audiometry - People that can hear normal voice from across a quiet room (%)
Audiometry - Ears ringing, roaring, buzzing (%)
Audiometry - Had a job exposure to loud noise (%)
Audiometry - Had off-work exposure to loud noise (%)
Blood Pressure & Cholesterol - Has high blood pressure (%)
Blood Pressure & Cholesterol - Checking blood pressure at home (%)
Blood Pressure & Cholesterol - Frequently checking blood cholesterol (%)
Blood Pressure & Cholesterol - Has high cholesterol level (%)
Consumer Behavior - Money monthly spent on food at supermarket/grocery store
Consumer Behavior - Money monthly spent on food at other stores
Consumer Behavior - Money monthly spent on eating out
Consumer Behavior - Money monthly spent on carryout/delivered foods
Consumer Behavior - Income spent on food at supermarket/grocery store (%)
Consumer Behavior - Income spent on food at other stores (%)
Consumer Behavior - Income spent on eating out (%)
Consumer Behavior - Income spent on carryout/delivered foods (%)
Current Health Status - General health condition (%)
Current Health Status - Blood donors (%)
Current Health Status - Has blood ever tested for HIV virus (%)
Current Health Status - Left-handed people (%)
Dermatology - People using sunscreen (%)
Diabetes - Diabetics (%)
Diabetes - Had a blood test for high blood sugar (%)
Diabetes - People taking insulin (%)
Diet Behavior & Nutrition - Diet health (%)
Diet Behavior & Nutrition - Milk product consumption (# of products/month)
Diet Behavior & Nutrition - Meals not home prepared (#/week)
Diet Behavior & Nutrition - Meals from fast food or pizza place (#/week)
Diet Behavior & Nutrition - Ready-to-eat foods (#/month)
Diet Behavior & Nutrition - Frozen meals/pizza (#/month)
Drug Use - People that ever used marijuana or hashish (%)
Drug Use - Ever used hard drugs (%)
Drug Use - Ever used any form of cocaine (%)
Drug Use - Ever used heroin (%)
Drug Use - Ever used methamphetamine (%)
Health Insurance - People covered by health insurance (%)
Kidney Conditions-Urology - Avg. # of times urinating at night
Medical Conditions - People with asthma (%)
Medical Conditions - People with anemia (%)
Medical Conditions - People with psoriasis (%)
Medical Conditions - People with overweight (%)
Medical Conditions - Elderly people having difficulties in thinking or remembering (%)
Medical Conditions - People who ever received blood transfusion (%)
Medical Conditions - People having trouble seeing even with glass/contacts (%)
Medical Conditions - People with arthritis (%)
Medical Conditions - People with gout (%)
Medical Conditions - People with congestive heart failure (%)
Medical Conditions - People with coronary heart disease (%)
Medical Conditions - People with angina pectoris (%)
Medical Conditions - People who ever had heart attack (%)
Medical Conditions - People who ever had stroke (%)
Medical Conditions - People with emphysema (%)
Medical Conditions - People with thyroid problem (%)
Medical Conditions - People with chronic bronchitis (%)
Medical Conditions - People with any liver condition (%)
Medical Conditions - People who ever had cancer or malignancy (%)
Mental Health - People who have little interest in doing things (%)
Mental Health - People feeling down, depressed, or hopeless (%)
Mental Health - People who have trouble sleeping or sleeping too much (%)
Mental Health - People feeling tired or having little energy (%)
Mental Health - People with poor appetite or overeating (%)
Mental Health - People feeling bad about themself (%)
Mental Health - People who have trouble concentrating on things (%)
Mental Health - People moving or speaking slowly or too fast (%)
Mental Health - People having thoughts they would be better off dead (%)
Oral Health - Average years since last visit a dentist
Oral Health - People embarrassed because of mouth (%)
Oral Health - People with gum disease (%)
Oral Health - General health of teeth and gums (%)
Oral Health - Average days a week using dental floss/device
Oral Health - Average days a week using mouthwash for dental problem
Oral Health - Average number of teeth
Pesticide Use - Households using pesticides to control insects (%)
Pesticide Use - Households using pesticides to kill weeds (%)
Physical Activity - People doing vigorous-intensity work activities (%)
Physical Activity - People doing moderate-intensity work activities (%)
Physical Activity - People walking or bicycling (%)
Physical Activity - People doing vigorous-intensity recreational activities (%)
Physical Activity - People doing moderate-intensity recreational activities (%)
Physical Activity - Average hours a day doing sedentary activities
Physical Activity - Average hours a day watching TV or videos
Physical Activity - Average hours a day using computer
Physical Functioning - People having limitations keeping them from working (%)
Physical Functioning - People limited in amount of work they can do (%)
Physical Functioning - People that need special equipment to walk (%)
Physical Functioning - People experiencing confusion/memory problems (%)
Physical Functioning - People requiring special healthcare equipment (%)
Prescription Medications - Average number of prescription medicines taking
Preventive Aspirin Use - Adults 40+ taking low-dose aspirin (%)
Reproductive Health - Vaginal deliveries (%)
Reproductive Health - Cesarean deliveries (%)
Reproductive Health - Deliveries resulted in a live birth (%)
Reproductive Health - Pregnancies resulted in a delivery (%)
Reproductive Health - Women breastfeeding newborns (%)
Reproductive Health - Women that had a hysterectomy (%)
Reproductive Health - Women that had both ovaries removed (%)
Reproductive Health - Women that have ever taken birth control pills (%)
Reproductive Health - Women taking birth control pills (%)
Reproductive Health - Women that have ever used Depo-Provera or injectables (%)
Reproductive Health - Women that have ever used female hormones (%)
Sexual Behavior - People 18+ that ever had sex (vaginal, anal, or oral) (%)
Sexual Behavior - Males 18+ that ever had vaginal sex with a woman (%)
Sexual Behavior - Males 18+ that ever performed oral sex on a woman (%)
Sexual Behavior - Males 18+ that ever had anal sex with a woman (%)
Sexual Behavior - Males 18+ that ever had any sex with a man (%)
Sexual Behavior - Females 18+ that ever had vaginal sex with a man (%)
Sexual Behavior - Females 18+ that ever performed oral sex on a man (%)
Sexual Behavior - Females 18+ that ever had anal sex with a man (%)
Sexual Behavior - Females 18+ that ever had any kind of sex with a woman (%)
Sexual Behavior - Average age people first had sex
Sexual Behavior - Average number of female sex partners in lifetime (males 18+)
Sexual Behavior - Average number of female vaginal sex partners in lifetime (males 18+)
Sexual Behavior - Average age people first performed oral sex on a woman (18+)
Sexual Behavior - Average number of woman performed oral sex on in lifetime (18+)
Sexual Behavior - Average number of male sex partners in lifetime (males 18+)
Sexual Behavior - Average number of male anal sex partners in lifetime (males 18+)
Sexual Behavior - Average age people first performed oral sex on a man (18+)
Sexual Behavior - Average number of male oral sex partners in lifetime (18+)
Sexual Behavior - People using protection when performing oral sex (%)
Sexual Behavior - Average number of times people have vaginal or anal sex a year
Sexual Behavior - People having sex without condom (%)
Sexual Behavior - Average number of male sex partners in lifetime (females 18+)
Sexual Behavior - Average number of male vaginal sex partners in lifetime (females 18+)
Sexual Behavior - Average number of female sex partners in lifetime (females 18+)
Sexual Behavior - Circumcised males 18+ (%)
Sleep Disorders - Average hours sleeping at night
Sleep Disorders - People that has trouble sleeping (%)
Smoking-Cigarette Use - People smoking cigarettes (%)
Taste & Smell - People 40+ having problems with smell (%)
Taste & Smell - People 40+ having problems with taste (%)
Taste & Smell - People 40+ that ever had wisdom teeth removed (%)
Taste & Smell - People 40+ that ever had tonsils teeth removed (%)
Taste & Smell - People 40+ that ever had a loss of consciousness because of a head injury (%)
Taste & Smell - People 40+ that ever had a broken nose or other serious injury to face or skull (%)
Taste & Smell - People 40+ that ever had two or more sinus infections (%)
Weight - Average height (inches)
Weight - Average weight (pounds)
Weight - Average BMI
Weight - People that are obese (%)
Weight - People that ever were obese (%)
Weight - People trying to lose weight (%)
4,351 58.1% White alone 2,392 31.9% Hispanic 376 5.0% Two or more races 124 1.7% Black alone 37 0.5% Asian alone 12 0.2% Native Hawaiian and Other
Officers per 1,000 residents here:
1.31California average:
2.30
Latest news from Taft, CA collected exclusively by city-data.com from local newspapers, TV, and radio stations
Ancestries: American (8.0%), English (7.3%), Irish (2.1%), German (1.8%), European (1.6%), Italian (1.2%).
Current Local Time:
Land area: 15.1 square miles.
Population density: 464 people per square mile (low).
433 residents are foreign born (5.1% Latin America ).
This city:
5.8%California:
26.5%
Median real estate property taxes paid for housing units with mortgages in 2022: $3,260 (1.1%)Median real estate property taxes paid for housing units with no mortgage in 2022: $1,701 (0.7%)
Nearest city with pop. 50,000+: Bakersfield, CA
Nearest city with pop. 1,000,000+: Los Angeles, CA
Nearest cities:
Fellows, CA (2.6 miles),
Latitude: 35.13 N, Longitude: 119.44 W
Daytime population change due to commuting: +1,778 (+23.7%)Workers who live and work in this city: 1,599 (59.1%)
Property values in Taft, CA
Single-family new house construction building permits:
2022: 2 buildings , average cost: $153,8002021: 9 buildings , average cost: $169,9002020: 5 buildings , average cost: $164,0002019: 12 buildings , average cost: $159,2002018: 13 buildings , average cost: $178,9002017: 12 buildings , average cost: $179,2002016: 8 buildings , average cost: $177,5002015: 19 buildings , average cost: $164,3002013: 1 building , cost: $120,0002012: 1 building , cost: $534,5002009: 2 buildings , average cost: $102,2002008: 4 buildings , average cost: $148,6002007: 2 buildings , average cost: $163,0002006: 9 buildings , average cost: $187,4002005: 9 buildings , average cost: $109,9002004: 9 buildings , average cost: $120,3002003: 13 buildings , average cost: $132,3002002: 25 buildings , average cost: $121,9002001: 3 buildings , average cost: $119,3002000: 16 buildings , average cost: $119,1001999: 10 buildings , average cost: $137,7001998: 7 buildings , average cost: $92,6001997: 6 buildings , average cost: $92,600Unemployment in December 2023:
Most common occupations in Taft, CA (%)
Both Males Females
Law enforcement workers, including supervisors (6.6%)
Building and grounds cleaning and maintenance occupations (6.3%)
Other office and administrative support workers, including supervisors (4.5%)
Electrical equipment mechanics and other installation, maintenance, and repair workers, including supervisors (4.5%)
Extraction workers (3.9%)
Secretaries and administrative assistants (3.8%)
Other management occupations, except farmers and farm managers (3.6%)
Law enforcement workers, including supervisors (10.3%)
Electrical equipment mechanics and other installation, maintenance, and repair workers, including supervisors (7.4%)
Building and grounds cleaning and maintenance occupations (7.1%)
Extraction workers (6.4%)
Supervisors, construction and extraction workers (5.4%)
Driver/sales workers and truck drivers (4.5%)
Other management occupations, except farmers and farm managers (4.5%)
Other office and administrative support workers, including supervisors (10.7%)
Secretaries and administrative assistants (9.7%)
Preschool, kindergarten, elementary, and middle school teachers (7.0%)
Cashiers (5.6%)
Bookkeeping, accounting, and auditing clerks (5.2%)
Building and grounds cleaning and maintenance occupations (5.1%)
Supervisors and other personal care and service workers, except child care workers (4.2%)
Air pollution and air quality trends(lower is better)
AQI Ozone
Earthquake activity:
Taft-area historical earthquake activity is significantly above California state average. It is 7400% greater than the overall U.S. average. On 7/21/1952 at 11:52:14, a magnitude 7.7 (7.7 UK, Class: Major, Intensity: VIII - XII) earthquake occurred 26.5 miles away from Taft center, causing $50,000,000 total damage On 11/4/1927 at 13:51:53, a magnitude 7.5 (7.5 UK) earthquake occurred 91.2 miles away from the city center On 6/28/1992 at 11:57:34, a magnitude 7.6 (6.2 MB, 7.6 MS, 7.3 MW, Depth: 0.7 mi) earthquake occurred 177.9 miles away from the city center, causing 3 deaths ( 1 shaking deaths, 2 other deaths) and 400 injuries, causing $100,000,000 total damage and $40,000,000 insured lossesOn 4/18/1906 at 13:12:21, a magnitude 7.9 (7.9 UK) earthquake occurred 280.3 miles away from the city center, causing $524,000,000 total damage On 10/16/1999 at 09:46:44, a magnitude 7.4 (6.3 MB, 7.4 MS, 7.2 MW, 7.3 ML) earthquake occurred 175.9 miles away from the city center On 1/17/1994 at 12:30:55, a magnitude 6.8 (6.4 MB, 6.8 MS, 6.7 MW, Depth: 11.4 mi, Class: Strong, Intensity: VII - IX) earthquake occurred 83.3 miles away from the city center, causing 60 deaths ( 60 shaking deaths) and 7000 injuriesMagnitude types: body-wave magnitude (MB), local magnitude (ML), surface-wave magnitude (MS), moment magnitude (MW) Natural disasters: The number of natural disasters in Kern County (29) is a lot greater than the US average (15).Major Disasters (Presidential) Declared: 14Emergencies Declared: 3Fires: 12, Floods: 12, Storms: 7, Winter Storms: 5, Mudslides: 4, Landslides: 3, Freezes: 2, Drought: 1, Heavy Rain: 1, Hurricane: 1, Snow: 1, Tornado: 1, Wind: 1, Other: 1 (Note: some incidents may be assigned to more than one category). Hospitals and medical centers in Taft: MERCY WESTSIDE HOSPT D/P SNF (110 EAST NORTH STREET)
WEST SIDE DISTRICT HOSP AND NURSING HOME (111 WEST ASH STREET)
Airports located in Taft:
College/University in Taft: Taft College Full-time enrollment: 2,121; Location: 29 Cougar Court; Public; Website: www.taftcollege.edu)
Other colleges/universities with over 2000 students near Taft:
California State University-Bakersfield (about 25 miles; Bakersfield, CA ; Full-time enrollment: 7,564)
Bakersfield College (about 33 miles; Bakersfield, CA ; FT enrollment: 10,325)
Santa Barbara City College (about 52 miles; Santa Barbara, CA ; FT enrollment: 12,568)
University of California-Santa Barbara (about 55 miles; Santa Barbara, CA ; FT enrollment: 22,806)
Allan Hancock College (about 57 miles; Santa Maria, CA ; FT enrollment: 6,639)
Ventura College (about 60 miles; Ventura, CA ; FT enrollment: 8,460)
Moorpark College (about 67 miles; Moorpark, CA ; FT enrollment: 9,338)
Public high schools in Taft:
Public elementary/middle schools in Taft: LINCOLN JUNIOR HIGH Students: 612, Location: 810 SIXTH ST., Grades: 6-8)ROOSEVELT ELEMENTARY Students: 433, Location: 811 SIXTH ST., Grades: 2-5)PARKVIEW ELEMENTARY Students: 127, Location: 520 A ST., Grades: KG-3)CONLEY ELEMENTARY Students: 112, Location: 623 ROSE AVE., Grades: KG-3)TAFT PRIMARY Students: 77, Location: 212 LUCARD ST., Grades: KG-3)JEFFERSON ELEMENTARY Students: 68, Location: 318 TAYLOR ST., Grades: KG-3)See full list of schools located in Taft User-submitted facts and corrections:
strongest fm radio stations, KRAB 106.1
Notable locations in Taft: (A) , Standard Oil Signa Station (B) , Taft City Corporation Yard (C) , Petroleum Club (D) , Kern County Fire Department Station 21 Taft (E) , Taft Community Center (F) , Taft Community Correctional Facility (G) , Taft College Library (H) , Taft Civic Center (I) , Taft City Hall (J) , Taft Chamber of Commerce (K) , Taft Branch Kern County Library (L) , California Department of Natural Resources (M) . Display/hide their locations on the map
Shopping Centers: (1) , Taft Hills Plaza Shopping Center (2) , Hall Mart Shopping Center (3) . Display/hide their locations on the map
Churches in Taft include: (A) , Church of Christ (B) , The Church of Jesus Christ of Latter Day Saints (C) , First Assembly of God Church (D) , First Baptist Church (E) , First Church of Christ Scientist (F) , First Presbyterian Church (G) , First United Methodist Church (H) , Laborers of the Harvest Church (I) . Display/hide their locations on the map
Parks in Taft include: (1) , Civic Center Park (2) , Cougar Sports Center (3) . Display/hide their locations on the map
Tourist attraction: (1) . Display/hide its approximate location on the map
Court: (1) . Display/hide its approximate location on the map
Birthplace of: Jeanne Cooper - Soap opera actor, Sam Andrew - Rock guitarist, Dennis Fimple - Actor, Tim Bright - Athletics competitor.
Kern County has a predicted average indoor radon screening level between 2 and 4 pCi/L (pico curies per liter) - Moderate Potential Average household size: This city:
2.8 peopleCalifornia:
2.9 people
Percentage of family households: This city:
70.4%Whole state:
68.7%
Percentage of households with unmarried partners: This city:
8.2%Whole state:
7.2%
Likely homosexual households (counted as self-reported same-sex unmarried-partner households)
Lesbian couples: 0.2% of all households Gay men: 0.2% of all households
People in group quarters in Taft in 2010:
2,351 people in federal prisons
481 people in state prisons
123 people in college/university student housing
People in group quarters in Taft in 2000:
419 people in state prisons
63 people in college dormitories (includes college quarters off campus)
29 people in orthopedic wards and institutions for the physically handicapped
26 people in agriculture workers' dormitories on farms
22 people in nursing homes
Banks with branches in Taft (2011 data):
Westamerica Bank: Taft Branch at 811 Center Street, branch established on 1966/07/29. Info updated 2011/06/21: Bank assets: $4,998.1 mil, Deposits: $4,253.2 mil, headquarters in San Rafael, CA, positive income , Commercial Lending Specialization, 98 total offices , Holding Company: Westamerica Bancorporation
Bank of America, National Association: Taft In-Store Branch at 1044 W. Kern, branch established on 1904/10/17. Info updated 2009/11/18: Bank assets: $1,451,969.3 mil, Deposits: $1,077,176.8 mil, headquarters in Charlotte, NC, positive income , 5782 total offices , Holding Company: Bank Of America Corporation
United Security Bank: Taft Branch at 523 Cascade Place, branch established on 1983/01/03. Info updated 2007/02/28: Bank assets: $656.0 mil, Deposits: $574.5 mil, headquarters in Fresno, CA, negative income in the last year , Commercial Lending Specialization, 13 total offices , Holding Company: United Security Bancshares
JPMorgan Chase Bank, National Association: 329 Kern Street Branch at 329 Kern Street, branch established on 1919/01/01. Info updated 2011/11/10: Bank assets: $1,811,678.0 mil, Deposits: $1,190,738.0 mil, headquarters in Columbus, OH, positive income , International Specialization, 5577 total offices , Holding Company: Jpmorgan Chase & Co.
For population 15 years and over in Taft:
Never married: 38.7%Now married: 40.2%Separated: 2.3%Widowed: 5.2%Divorced: 13.7% For population 25 years and over in Taft:
High school or higher: 82.7%Bachelor's degree or higher: 10.2%Graduate or professional degree: 4.2%Unemployed: 11.6%Mean travel time to work (commute): 28.6 minutes
Education Gini index (Inequality in education) Here:
9.7California average:
15.5
Religion statistics for Taft, CA (based on Kern County data)
Religion Adherents Congregations Catholic 245,836 30 Evangelical Protestant 114,724 436 Other 30,687 83 Mainline Protestant 7,459 38 Black Protestant 4,026 25 Orthodox 450 3 None 436,449 -
Source: Clifford Grammich, Kirk Hadaway, Richard Houseal, Dale E.Jones, Alexei Krindatch, Richie Stanley and Richard H.Taylor. 2012. 2010 U.S.Religion Census: Religious Congregations & Membership Study. Association of Statisticians of American Religious Bodies. Jones, Dale E., et al. 2002. Congregations and Membership in the United States 2000. Nashville, TN: Glenmary Research Center. Graphs represent county-level data
Food Environment Statistics: Number of grocery stores : 190Kern County :
2.41 / 10,000 pop.State :
2.14 / 10,000 pop.
Number of supercenters and club stores : 3Kern County :
0.04 / 10,000 pop.California :
0.04 / 10,000 pop.
Number of convenience stores (no gas) : 63Kern County :
0.80 / 10,000 pop.California :
0.62 / 10,000 pop.
Number of convenience stores (with gas) : 165This county :
2.10 / 10,000 pop.California :
1.49 / 10,000 pop.
Number of full-service restaurants : 362Here :
4.60 / 10,000 pop.California :
7.42 / 10,000 pop.
Adult diabetes rate : This county :
8.0%California :
7.3%
Adult obesity rate : This county :
29.4%California :
21.3%
Low-income preschool obesity rate : Kern County :
15.9%State :
17.9%
Health and Nutrition:
Average overall health of teeth and gums : Taft:
42.7%California:
48.0%
People feeling badly about themselves : This city:
21.6%California:
20.2%
People not drinking alcohol at all : Taft:
12.3%California:
11.2%
Average hours sleeping at night : Overweight people : This city:
35.0%California:
31.5%
General health condition : This city:
53.7%California:
56.4%
Average condition of hearing : More about Health and Nutrition of Taft, CA Residents
Local government employment and payroll (March 2022)
Function
Full-time employees
Monthly full-time payroll
Average yearly full-time wage
Part-time employees
Monthly part-time payroll
Police Protection - Officers
43 $311,999 $87,069 0 $0 Other Government Administration
24 $135,647 $67,824 0 $0 Police - Other
24 $91,608 $45,804 2 $1,174 Streets and Highways
22 $108,681 $59,281 4 $6,574 Transit
19 $56,127 $35,449 0 $0 Financial Administration
14 $73,099 $62,656 0 $0 Housing and Community Development (Local)
2 $20,744 $124,464 0 $0
Totals for Government
148 $797,905 $64,695 6 $7,748
Taft government finances - Expenditure in 2017 (per resident):
Construction - Parks and Recreation: $207,000 ($29.43)
General - Other: $156,000 ($22.18)Current Operations - Correctional Institutions: $11,614,000 ($1651.12)
Police Protection: $3,196,000 ($454.36)Sewerage: $2,397,000 ($340.77)Central Staff Services: $2,164,000 ($307.65)Transit Utilities: $1,312,000 ($186.52)Regular Highways: $915,000 ($130.08)Solid Waste Management: $840,000 ($119.42)Local Fire Protection: $540,000 ($76.77)Housing and Community Development: $368,000 ($52.32)Protective Inspection and Regulation - Other: $267,000 ($37.96)General - Other: $226,000 ($32.13)Health - Other: $142,000 ($20.19)Other Capital Outlay - Sewerage: $160,000 ($22.75)
Regular Highways: $122,000 ($17.34)Police Protection: $62,000 ($8.81)Transit Utilities: $42,000 ($5.97)Solid Waste Management: $32,000 ($4.55)Central Staff Services: $8,000 ($1.14)Total Salaries and Wages: $298,000 ($42.37)
Transit Utilities - Interest on Debt: $15,000 ($2.13)
Taft government finances - Revenue in 2017 (per resident):
Charges - Other: $14,629,000 ($2079.76)
Sewerage: $1,157,000 ($164.49)Solid Waste Management: $999,000 ($142.02)Regular Highways: $9,000 ($1.28)Federal Intergovernmental - Other: $3,515,000 ($499.72)
Housing and Community Development: $94,000 ($13.36)Local Intergovernmental - Other: $339,000 ($48.19)
Miscellaneous - General Revenue - Other: $3,292,000 ($468.01)
Interest Earnings: $130,000 ($18.48)Rents: $127,000 ($18.06)Fines and Forfeits: $34,000 ($4.83)Revenue - Transit Utilities: $96,000 ($13.65)
State Intergovernmental - Other: $1,403,000 ($199.46)
Transit Utilities: $637,000 ($90.56)Highways: $102,000 ($14.50)General Local Government Support: $5,000 ($0.71)Tax - Property: $1,365,000 ($194.06)
General Sales and Gross Receipts: $1,195,000 ($169.89)Public Utilities Sales: $351,000 ($49.90)Other Selective Sales: $163,000 ($23.17)Other License: $137,000 ($19.48)Occupation and Business License - Other: $133,000 ($18.91)Documentary and Stock Transfer: $19,000 ($2.70)Other: $4,000 ($0.57)
Taft government finances - Debt in 2017 (per resident):
Long Term Debt - Outstanding Unspecified Public Purpose: $2,263,000 ($321.72)
Issue, Unspecified Public Purpose: $1,895,000 ($269.41)Beginning Outstanding - Unspecified Public Purpose: $367,000 ($52.18)
Taft government finances - Cash and Securities in 2017 (per resident):
Bond Funds - Cash and Securities: $4,050,000 ($575.77)
Other Funds - Cash and Securities: $16,643,000 ($2366.08)
Sinking Funds - Cash and Securities: $160,000 ($22.75)
4.83% of this county's 2021 resident taxpayers lived in other counties in 2020 ($47,246 average adjusted gross income )
Here:
4.83%California average:
5.19%
0.03% of residents moved from foreign countries ($334 average AGI )Kern County:
0.03%California average:
0.03%
Top counties from which taxpayers relocated into this county between 2020 and 2021:
4.56% of this county's 2020 resident taxpayers moved to other counties in 2021 ($61,654 average adjusted gross income )
Here:
4.56%California average:
6.14%
0.03% of residents moved to foreign countries ($342 average AGI )Kern County:
0.03%California average:
0.02%
Top counties to which taxpayers relocated from this county between 2020 and 2021:
Businesses in Taft, CA
Name Count Name Count
7-Eleven 1 H&R Block 1 AT&T 2 KFC 1 Albertsons 1 Kmart 1 AutoZone 1 La-Z-Boy 1 Burger King 1 McDonald's 1 Chevrolet 1 RadioShack 1 Domino's Pizza 1 Rite Aid 1 FedEx 1 Sears 2 GNC 1 True Value 1 Goodwill 3 UPS 1
Strongest AM radio stations in Taft:
KERI (1180 AM; 50 kW; WASCO-GREENACRES, CA; Owner: KWSO, INC.)
KNZR (1560 AM; 25 kW; BAKERSFIELD, CA; Owner: BUCKLEY BROADCASTING CORP. OF CALIF.)
KGDP (660 AM; 50 kW; ORCUTT, CA; Owner: RADIO REPRESENTATIVES, INC.)
KMAP (1050 AM; 10 kW; FRAZIER PARK, CA; Owner: KMAP, INC.)
KIRN (670 AM; 35 kW; SIMI VALLEY, CA; Owner: LOTUS OXNARD CORP.)
KSPN (710 AM; 50 kW; LOS ANGELES, CA; Owner: KABC-AM RADIO, INC.)
KUZZ (550 AM; 5 kW; BAKERSFIELD, CA; Owner: OWENS ONE COMPANY)
KMJ (580 AM; 50 kW; FRESNO, CA; Owner: INFINITY RADIO OPERATIONS INC.)
KLAC (570 AM; 50 kW; LOS ANGELES, CA; Owner: AMFM RADIO LICENSES, L.L.C.)
KWRU (940 AM; 50 kW; FRESNO, CA)
KACD (850 AM; 25 kW; THOUSAND OAKS, CA; Owner: CITICASTERS LICENSES, L.P.)
KFI (640 AM; 50 kW; LOS ANGELES, CA; Owner: CAPSTAR TX LIMITED PARTNERSHIP)
KFWB (980 AM; 50 kW; LOS ANGELES, CA; Owner: INFINITY BROADCASTING OPERATIONS, INC.)
Strongest FM radio stations in Taft:
KBDS (103.9 FM; TAFT, CA; Owner: RADIO CAMPESINA BAKERSFIELD, INC.)
K293AG (106.5 FM; TAFT, CA; Owner: CENTRO CRISTIANO DE FE, INC.)
KGZO (90.9 FM; SHAFTER, CA; Owner: THE ASSOCIATION FOR COMMUNITY EDUCATION, INC.)
K266AH (101.1 FM; BENA, CA; Owner: CALVARY CHAPEL OF TWIN FALLS, INC.)
KTQX (90.1 FM; BAKERSFIELD, CA; Owner: RADIO BILINGUE, INC.)
K254AH (98.7 FM; ISLA VISTA, CA; Owner: PACIFICA FOUNDATION, INC.)
KMYX-FM (92.5 FM; ARVIN, CA; Owner: FARMWORKER EDUC. RADIO NETWORK, INC.)
KRAZ (105.9 FM; SANTA YNEZ, CA; Owner: KNIGHT BROADCASTING, INC.)
KRUZ (103.3 FM; SANTA BARBARA, CA; Owner: CUMULUS LICENSING CORP.)
KSPE-FM (94.5 FM; ELLWOOD, CA; Owner: CITICASTERS LICENSES, L.P.)
KMGQ (97.5 FM; SANTA BARBARA, CA; Owner: CUMULUS LICENSING CORP.)
KCSB-FM (91.9 FM; SANTA BARBARA, CA; Owner: UNIVERSITY OF CALIFORNIA)
KKBB (99.3 FM; BAKERSFIELD, CA; Owner: BUCKLEY COMMUNICATIONS, INC.)
KXFM (99.1 FM; SANTA MARIA, CA; Owner: CLEAR CHANNEL BROADCASTING LICENSES, INC.)
K295AH (106.9 FM; GOLETA, CA; Owner: THE ASSOC., FOR COMMUNITY EDUC., INC)
KIST-FM (107.7 FM; SANTA BARBARA, CA; Owner: CITICASTERS LICENSES, L.P.)
KFRB (91.3 FM; BAKERSFIELD, CA; Owner: FAMILY STATIONS, INC.)
KUZZ-FM (107.9 FM; BAKERSFIELD, CA; Owner: OWENS ONE COMPANY, INC)
KISV (94.1 FM; BAKERSFIELD, CA; Owner: AMERICAN GENERAL MEDIA CORP.)
KGFM (101.5 FM; BAKERSFIELD, CA; Owner: LAGNIAPPE BROADCASTING, INC.)
TV broadcast stations around Taft:
KNXT-LP (Channel 57; MARICOPA, ETC., CA; Owner: GARY M. COCOLA FAMILY TRUST, GARY M. COCOLA TRUSTEE)
KTRO-LP (Channel 50; LANCASTER, CA; Owner: ROBERT D. ADELMAN)
KPMC-LP (Channel 42; BAKERSFIELD, CA; Owner: GARY M. COCOLA FAMILY TRUST)
National Bridge Inventory (NBI) Statistics 13 Number of bridges89ft / 26.6m Total length $572,000 Total costs50,110 Total average daily traffic4,756 Total average daily truck traffic68,158 Total future (year 2037) average daily traffic
New bridges - historical statistics
1 1920-1929 3 1950-1959 3 1960-1969 6 1970-1979
See full National Bridge Inventory statistics for Taft, CA
Home Mortgage Disclosure Act Aggregated Statistics For Year 2009(Based on 1 full and 1 partial tracts) A) FHA, FSA/RHS & VA B) Conventional C) Refinancings D) Home Improvement Loans F) Non-occupant Loans on G) Loans On Manufactured Number Average Value Number Average Value Number Average Value Number Average Value Number Average Value Number Average Value
LOANS ORIGINATED 40 $150,329 10 $100,183 46 $176,365 9 $69,700 8 $78,534 4 $176,005 APPLICATIONS APPROVED, NOT ACCEPTED 3 $133,913 1 $129,430 6 $124,453 0 $0 0 $0 1 $62,620 APPLICATIONS DENIED 4 $172,260 5 $71,420 47 $143,654 4 $67,272 15 $86,608 2 $83,835 APPLICATIONS WITHDRAWN 6 $161,593 5 $121,668 20 $180,756 1 $111,740 3 $119,763 0 $0 FILES CLOSED FOR INCOMPLETENESS 0 $0 2 $250,520 7 $160,606 1 $29,410 0 $0 0 $0
Aggregated Statistics For Year 2008(Based on 1 full and 1 partial tracts) A) FHA, FSA/RHS & VA B) Conventional C) Refinancings D) Home Improvement Loans F) Non-occupant Loans on G) Loans On Manufactured Number Average Value Number Average Value Number Average Value Number Average Value Number Average Value Number Average Value
LOANS ORIGINATED 18 $163,126 21 $141,210 73 $136,853 12 $55,799 17 $103,855 2 $82,340 APPLICATIONS APPROVED, NOT ACCEPTED 6 $147,672 4 $99,528 8 $189,610 2 $142,375 3 $69,703 2 $119,265 APPLICATIONS DENIED 3 $139,350 10 $162,023 89 $162,685 12 $75,914 17 $129,438 1 $40,200 APPLICATIONS WITHDRAWN 3 $108,387 3 $51,477 26 $155,911 2 $68,635 3 $114,810 3 $41,987 FILES CLOSED FOR INCOMPLETENESS 0 $0 1 $147,070 4 $203,872 1 $75,500 1 $193,160 0 $0
Aggregated Statistics For Year 2007(Based on 1 full and 1 partial tracts) A) FHA, FSA/RHS & VA B) Conventional C) Refinancings D) Home Improvement Loans E) Loans on Dwellings For 5+ Families F) Non-occupant Loans on G) Loans On Manufactured Number Average Value Number Average Value Number Average Value Number Average Value Number Average Value Number Average Value Number Average Value
LOANS ORIGINATED 8 $170,638 87 $139,123 200 $158,120 33 $95,285 1 $637,320 51 $119,926 7 $184,860 APPLICATIONS APPROVED, NOT ACCEPTED 0 $0 19 $135,163 32 $165,470 6 $73,658 0 $0 6 $132,047 4 $68,390 APPLICATIONS DENIED 0 $0 46 $146,922 135 $162,887 24 $56,887 1 $196,100 35 $144,630 5 $100,942 APPLICATIONS WITHDRAWN 2 $184,825 14 $143,152 60 $168,440 3 $69,510 2 $514,760 15 $139,815 0 $0 FILES CLOSED FOR INCOMPLETENESS 0 $0 5 $136,118 12 $146,310 0 $0 0 $0 1 $109,820 0 $0
Aggregated Statistics For Year 2006(Based on 1 full and 1 partial tracts) A) FHA, FSA/RHS & VA B) Conventional C) Refinancings D) Home Improvement Loans E) Loans on Dwellings For 5+ Families F) Non-occupant Loans on G) Loans On Manufactured Number Average Value Number Average Value Number Average Value Number Average Value Number Average Value Number Average Value Number Average Value
LOANS ORIGINATED 7 $166,544 186 $118,203 272 $147,913 35 $104,940 1 $257,870 82 $129,391 4 $86,530 APPLICATIONS APPROVED, NOT ACCEPTED 1 $150,020 41 $148,911 42 $161,782 5 $89,048 0 $0 16 $155,988 4 $104,668 APPLICATIONS DENIED 1 $208,650 67 $118,161 148 $141,595 18 $85,086 2 $291,700 32 $115,927 5 $86,084 APPLICATIONS WITHDRAWN 2 $186,295 47 $135,501 153 $141,125 10 $145,088 0 $0 23 $136,789 1 $264,730 FILES CLOSED FOR INCOMPLETENESS 0 $0 6 $149,600 27 $132,554 0 $0 0 $0 4 $107,632 0 $0
Aggregated Statistics For Year 2005(Based on 1 full and 1 partial tracts) A) FHA, FSA/RHS & VA B) Conventional C) Refinancings D) Home Improvement Loans E) Loans on Dwellings For 5+ Families F) Non-occupant Loans on G) Loans On Manufactured Number Average Value Number Average Value Number Average Value Number Average Value Number Average Value Number Average Value Number Average Value
LOANS ORIGINATED 9 $120,227 223 $101,687 260 $130,460 28 $97,755 0 $0 88 $96,962 3 $44,430 APPLICATIONS APPROVED, NOT ACCEPTED 0 $0 34 $101,640 53 $117,966 2 $97,530 0 $0 17 $98,019 3 $50,613 APPLICATIONS DENIED 2 $115,325 73 $96,594 155 $109,990 22 $71,815 1 $196,100 28 $109,105 4 $81,005 APPLICATIONS WITHDRAWN 0 $0 40 $107,484 170 $120,984 26 $104,650 0 $0 20 $87,654 0 $0 FILES CLOSED FOR INCOMPLETENESS 0 $0 12 $97,184 38 $137,124 1 $267,510 0 $0 8 $135,714 1 $101,970
Aggregated Statistics For Year 2004(Based on 1 full and 1 partial tracts) A) FHA, FSA/RHS & VA B) Conventional C) Refinancings D) Home Improvement Loans E) Loans on Dwellings For 5+ Families F) Non-occupant Loans on G) Loans On Manufactured Number Average Value Number Average Value Number Average Value Number Average Value Number Average Value Number Average Value Number Average Value
LOANS ORIGINATED 26 $102,077 149 $87,346 208 $94,715 40 $51,425 3 $410,830 59 $69,565 1 $161,780 APPLICATIONS APPROVED, NOT ACCEPTED 1 $116,660 18 $88,056 64 $100,758 9 $38,200 0 $0 12 $90,447 1 $40,200 APPLICATIONS DENIED 0 $0 50 $87,176 187 $95,017 46 $55,869 0 $0 29 $92,042 1 $32,710 APPLICATIONS WITHDRAWN 3 $92,167 18 $120,493 140 $97,122 15 $71,042 0 $0 11 $87,985 0 $0 FILES CLOSED FOR INCOMPLETENESS 0 $0 5 $96,080 20 $96,166 1 $47,740 0 $0 3 $76,047 0 $0
Aggregated Statistics For Year 2003(Based on 1 full and 1 partial tracts) A) FHA, FSA/RHS & VA B) Conventional C) Refinancings D) Home Improvement Loans E) Loans on Dwellings For 5+ Families F) Non-occupant Loans on Number Average Value Number Average Value Number Average Value Number Average Value Number Average Value Number Average Value
LOANS ORIGINATED 39 $96,607 82 $90,039 244 $86,860 12 $26,164 0 $0 36 $78,573 APPLICATIONS APPROVED, NOT ACCEPTED 3 $84,080 17 $80,799 43 $90,037 4 $26,922 0 $0 5 $89,412 APPLICATIONS DENIED 4 $89,470 24 $86,995 149 $82,758 10 $27,494 0 $0 18 $82,041 APPLICATIONS WITHDRAWN 5 $98,736 19 $113,449 87 $87,338 4 $27,992 1 $539,270 12 $108,772 FILES CLOSED FOR INCOMPLETENESS 1 $134,330 0 $0 15 $93,255 0 $0 0 $0 1 $78,440
Aggregated Statistics For Year 2002(Based on 1 full and 1 partial tracts) A) FHA, FSA/RHS & VA B) Conventional C) Refinancings D) Home Improvement Loans F) Non-occupant Loans on Number Average Value Number Average Value Number Average Value Number Average Value Number Average Value
LOANS ORIGINATED 43 $85,568 53 $70,085 114 $75,932 13 $28,029 19 $45,849 APPLICATIONS APPROVED, NOT ACCEPTED 4 $76,548 8 $60,012 17 $70,417 2 $37,965 3 $57,910 APPLICATIONS DENIED 2 $50,300 6 $57,132 98 $78,110 14 $23,077 5 $82,602 APPLICATIONS WITHDRAWN 5 $67,330 10 $63,062 57 $78,263 5 $22,010 7 $74,366 FILES CLOSED FOR INCOMPLETENESS 0 $0 5 $60,900 9 $83,071 0 $0 2 $57,450
Aggregated Statistics For Year 2001(Based on 1 full and 1 partial tracts) A) FHA, FSA/RHS & VA B) Conventional C) Refinancings D) Home Improvement Loans E) Loans on Dwellings For 5+ Families F) Non-occupant Loans on Number Average Value Number Average Value Number Average Value Number Average Value Number Average Value Number Average Value
LOANS ORIGINATED 75 $85,595 51 $52,664 76 $72,896 6 $29,627 2 $574,575 16 $53,529 APPLICATIONS APPROVED, NOT ACCEPTED 3 $75,327 1 $45,130 10 $60,419 0 $0 0 $0 0 $0 APPLICATIONS DENIED 1 $91,980 19 $49,902 56 $53,918 13 $18,423 0 $0 5 $49,716 APPLICATIONS WITHDRAWN 4 $54,935 8 $85,072 44 $66,828 3 $18,807 0 $0 4 $57,665 FILES CLOSED FOR INCOMPLETENESS 1 $60,790 1 $102,930 19 $82,255 0 $0 0 $0 0 $0
Aggregated Statistics For Year 2000(Based on 1 full and 1 partial tracts) A) FHA, FSA/RHS & VA B) Conventional C) Refinancings D) Home Improvement Loans E) Loans on Dwellings For 5+ Families F) Non-occupant Loans on Number Average Value Number Average Value Number Average Value Number Average Value Number Average Value Number Average Value
LOANS ORIGINATED 53 $76,112 31 $62,605 31 $61,655 7 $22,294 0 $0 9 $40,121 APPLICATIONS APPROVED, NOT ACCEPTED 2 $55,825 2 $57,825 10 $44,156 7 $31,883 0 $0 2 $44,615 APPLICATIONS DENIED 1 $147,780 15 $41,298 41 $45,812 5 $22,056 1 $993,250 7 $46,047 APPLICATIONS WITHDRAWN 6 $62,097 5 $55,252 25 $59,808 5 $14,980 0 $0 1 $35,910 FILES CLOSED FOR INCOMPLETENESS 0 $0 2 $48,705 7 $54,019 1 $47,890 0 $0 2 $38,645
Aggregated Statistics For Year 1999(Based on 1 full and 1 partial tracts) A) FHA, FSA/RHS & VA B) Conventional C) Refinancings D) Home Improvement Loans E) Loans on Dwellings For 5+ Families F) Non-occupant Loans on Number Average Value Number Average Value Number Average Value Number Average Value Number Average Value Number Average Value
LOANS ORIGINATED 49 $73,100 29 $64,990 74 $56,913 15 $21,855 3 $318,137 11 $39,055 APPLICATIONS APPROVED, NOT ACCEPTED 1 $101,820 3 $52,847 20 $48,036 11 $22,052 0 $0 5 $35,650 APPLICATIONS DENIED 4 $52,772 11 $47,282 69 $48,958 14 $23,209 0 $0 10 $41,469 APPLICATIONS WITHDRAWN 6 $74,103 12 $55,850 41 $61,778 0 $0 0 $0 6 $30,803 FILES CLOSED FOR INCOMPLETENESS 0 $0 0 $0 6 $75,233 0 $0 0 $0 1 $75,890
Detailed HMDA statistics for the following Tracts:
0035.00
, 0036.00
Private Mortgage Insurance Companies Aggregated Statistics For Year 2009(Based on 1 full tract) A) Conventional B) Refinancings C) Non-occupant Loans on Number Average Value Number Average Value Number Average Value
LOANS ORIGINATED 1 $98,050 2 $162,765 0 $0 APPLICATIONS APPROVED, NOT ACCEPTED 2 $151,975 0 $0 1 $79,420 APPLICATIONS DENIED 0 $0 0 $0 0 $0 APPLICATIONS WITHDRAWN 0 $0 0 $0 0 $0 FILES CLOSED FOR INCOMPLETENESS 0 $0 0 $0 0 $0
Aggregated Statistics For Year 2008(Based on 1 full and 1 partial tracts) A) Conventional B) Refinancings C) Non-occupant Loans on Number Average Value Number Average Value Number Average Value
LOANS ORIGINATED 15 $178,727 7 $155,054 3 $101,657 APPLICATIONS APPROVED, NOT ACCEPTED 3 $146,470 6 $157,315 0 $0 APPLICATIONS DENIED 2 $73,405 1 $151,980 2 $42,160 APPLICATIONS WITHDRAWN 1 $264,730 1 $117,660 0 $0 FILES CLOSED FOR INCOMPLETENESS 0 $0 2 $181,390 1 $196,100
Aggregated Statistics For Year 2007(Based on 1 full and 1 partial tracts) A) Conventional B) Refinancings C) Non-occupant Loans on Number Average Value Number Average Value Number Average Value
LOANS ORIGINATED 21 $180,482 21 $207,741 1 $96,260 APPLICATIONS APPROVED, NOT ACCEPTED 5 $182,528 6 $213,895 0 $0 APPLICATIONS DENIED 2 $215,255 2 $196,100 0 $0 APPLICATIONS WITHDRAWN 1 $217,010 1 $328,550 0 $0 FILES CLOSED FOR INCOMPLETENESS 0 $0 0 $0 0 $0
Aggregated Statistics For Year 2006(Based on 1 full and 1 partial tracts) A) Conventional B) Refinancings C) Non-occupant Loans on Number Average Value Number Average Value Number Average Value
LOANS ORIGINATED 12 $158,098 8 $218,162 4 $129,370 APPLICATIONS APPROVED, NOT ACCEPTED 4 $199,878 1 $220,290 1 $293,820 APPLICATIONS DENIED 0 $0 0 $0 0 $0 APPLICATIONS WITHDRAWN 1 $118,670 0 $0 1 $78,270 FILES CLOSED FOR INCOMPLETENESS 0 $0 0 $0 0 $0
Aggregated Statistics For Year 2005(Based on 1 full and 1 partial tracts) A) Conventional B) Refinancings C) Non-occupant Loans on Number Average Value Number Average Value Number Average Value
LOANS ORIGINATED 22 $149,193 16 $151,304 7 $103,516 APPLICATIONS APPROVED, NOT ACCEPTED 3 $80,800 2 $131,385 2 $40,800 APPLICATIONS DENIED 0 $0 0 $0 0 $0 APPLICATIONS WITHDRAWN 3 $116,680 0 $0 1 $123,540 FILES CLOSED FOR INCOMPLETENESS 0 $0 0 $0 0 $0
Aggregated Statistics For Year 2004(Based on 1 full and 1 partial tracts) A) Conventional B) Refinancings C) Non-occupant Loans on Number Average Value Number Average Value Number Average Value
LOANS ORIGINATED 31 $116,411 15 $117,303 5 $84,342 APPLICATIONS APPROVED, NOT ACCEPTED 5 $123,748 5 $93,082 1 $64,380 APPLICATIONS DENIED 0 $0 0 $0 0 $0 APPLICATIONS WITHDRAWN 1 $70,600 3 $92,617 0 $0 FILES CLOSED FOR INCOMPLETENESS 0 $0 0 $0 0 $0
Aggregated Statistics For Year 2003(Based on 1 full and 1 partial tracts) A) Conventional B) Refinancings C) Non-occupant Loans on Number Average Value Number Average Value Number Average Value
LOANS ORIGINATED 23 $108,005 35 $107,638 4 $78,708 APPLICATIONS APPROVED, NOT ACCEPTED 2 $129,880 4 $122,895 0 $0 APPLICATIONS DENIED 0 $0 1 $86,280 0 $0 APPLICATIONS WITHDRAWN 1 $65,690 2 $79,910 0 $0 FILES CLOSED FOR INCOMPLETENESS 1 $112,760 0 $0 0 $0
Aggregated Statistics For Year 2002(Based on 1 full and 1 partial tracts) A) Conventional B) Refinancings C) Non-occupant Loans on Number Average Value Number Average Value Number Average Value
LOANS ORIGINATED 17 $87,879 13 $95,628 2 $61,270 APPLICATIONS APPROVED, NOT ACCEPTED 1 $144,040 3 $90,643 0 $0 APPLICATIONS DENIED 0 $0 0 $0 0 $0 APPLICATIONS WITHDRAWN 4 $83,342 0 $0 0 $0 FILES CLOSED FOR INCOMPLETENESS 0 $0 0 $0 0 $0
Aggregated Statistics For Year 2001(Based on 1 full and 1 partial tracts) A) Conventional B) Refinancings Number Average Value Number Average Value
LOANS ORIGINATED 10 $71,953 8 $115,726 APPLICATIONS APPROVED, NOT ACCEPTED 1 $77,930 1 $101,970 APPLICATIONS DENIED 0 $0 0 $0 APPLICATIONS WITHDRAWN 0 $0 0 $0 FILES CLOSED FOR INCOMPLETENESS 0 $0 0 $0
Aggregated Statistics For Year 2000(Based on 1 full and 1 partial tracts) A) Conventional B) Refinancings C) Non-occupant Loans on Number Average Value Number Average Value Number Average Value
LOANS ORIGINATED 10 $102,095 5 $82,860 3 $54,083 APPLICATIONS APPROVED, NOT ACCEPTED 0 $0 0 $0 0 $0 APPLICATIONS DENIED 2 $68,085 0 $0 1 $91,190 APPLICATIONS WITHDRAWN 0 $0 0 $0 0 $0 FILES CLOSED FOR INCOMPLETENESS 0 $0 0 $0 0 $0
Aggregated Statistics For Year 1999(Based on 1 full and 1 partial tracts) A) Conventional B) Refinancings C) Non-occupant Loans on Number Average Value Number Average Value Number Average Value
LOANS ORIGINATED 11 $90,295 5 $89,440 1 $54,480 APPLICATIONS APPROVED, NOT ACCEPTED 1 $161,500 2 $87,075 0 $0 APPLICATIONS DENIED 3 $76,210 2 $98,265 0 $0 APPLICATIONS WITHDRAWN 1 $106,030 1 $83,670 0 $0 FILES CLOSED FOR INCOMPLETENESS 0 $0 0 $0 0 $0
Detailed PMIC statistics for the following Tracts:
0035.00
, 0036.00 Taft compared to California state average:
Median household income below state average. Median house value significantly below state average. Black race population percentage below state average. Foreign-born population percentage significantly below state average. Length of stay since moving in significantly above state average. Institutionalized population percentage significantly above state average. Percentage of population with a bachelor's degree or higher significantly below state average.
#20 on the list of "Top 101 cities with the most recent year of entry for the foreign-born population (2,000+ people)+"
#22 on the list of "Top 101 cities with largest percentage of males in industries: mining, quarrying, and oil and gas extraction (population 5,000+)"
#41 on the list of "Top 101 cities with largest percentage of males in industries: other services, except public administration (population 5,000+)"
#46 on the list of "Top 101 cities with the largest percentage of people in orthopedic wards and institutions for the physically handicapped (population 1,000+)"
#48 on the list of "Top 100 cities with the largest percentage of males (pop. 5,000+)"
#58 on the list of "Top 101 cities with largest percentage of males in occupations: installation, maintenance, and repair occupations (population 5,000+)"
#73 on the list of "Top 101 cities with the most residents born in Armenia (population 500+)"
#80 on the list of "Top 101 cities with largest percentage of females in occupations: farming, fishing, and forestry occupations (population 5,000+)"
#86 on the list of "Top 101 cities with largest percentage of females in industries: mining, quarrying, and oil and gas extraction (population 5,000+)"
#99 on the list of "Top 101 cities with largest percentage of females in industries: educational services (population 5,000+)"
#6 on the list of "Top 101 counties with the highest Particulate Matter (PM10 ) Annual air pollution readings in 2012 (µg/m3 )"
#13 on the list of "Top 101 counties with the highest carbon monoxide air pollution readings in 2012 (ppm)"
#13 on the list of "Top 101 counties with the highest lead air pollution readings in 2012 (µg/m3 )"
#13 on the list of "Top 101 counties with the lowest lead air pollution readings in 2012 (µg/m3 )"
#17 on the list of "Top 101 counties with the highest ground withdrawal of fresh water for public supply"
Top Patent Applicants
Joel R. Lehman (4)
Edward Showalter (3)
Stephen Calanari Sayre (1)
Travis D. Neumann (1)
Dalton Wires (1)
Clint L. Deckert (1)
Albert Richard Farquhar (1)
Stacy L. Boyd (1)
Total of 12 patent applications in 2008-2024.

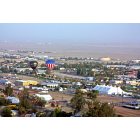

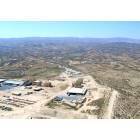
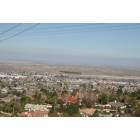
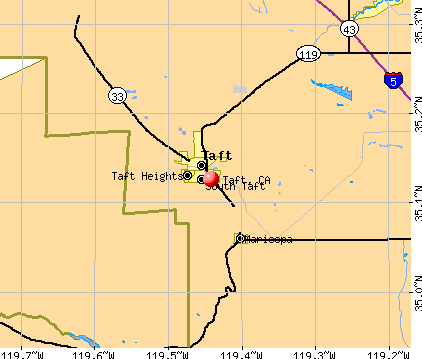


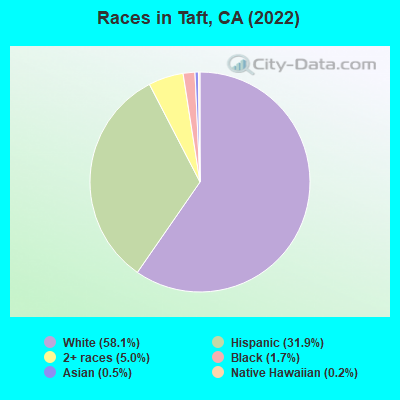
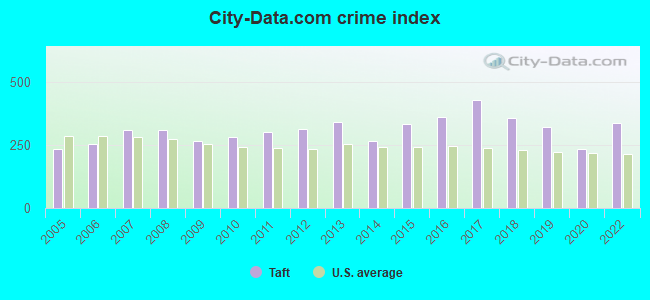
 Recent articles from our blog. Our writers, many of them Ph.D. graduates or candidates, create easy-to-read articles on a wide variety of topics.

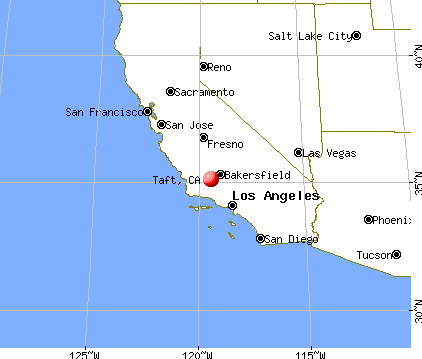
 (28.2 miles
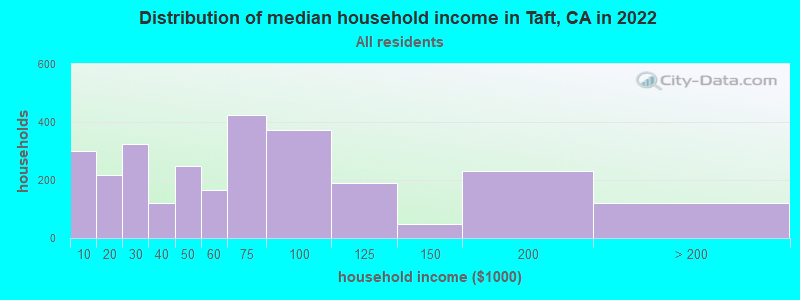
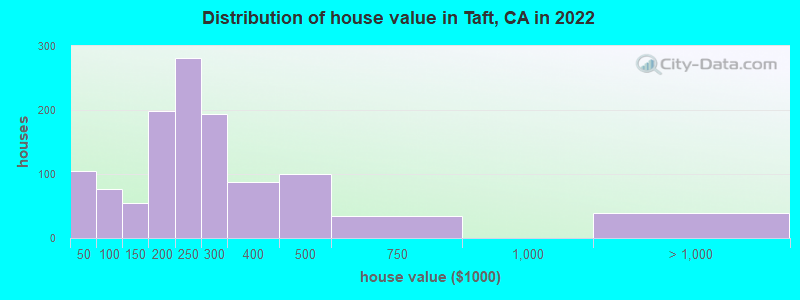
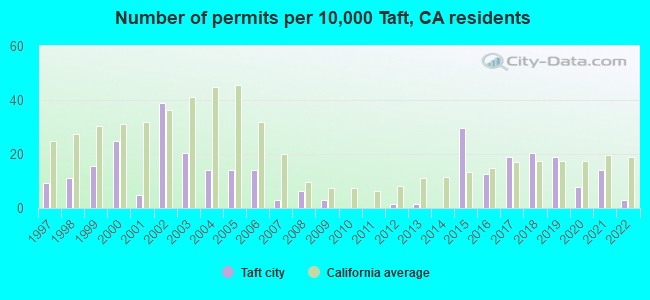
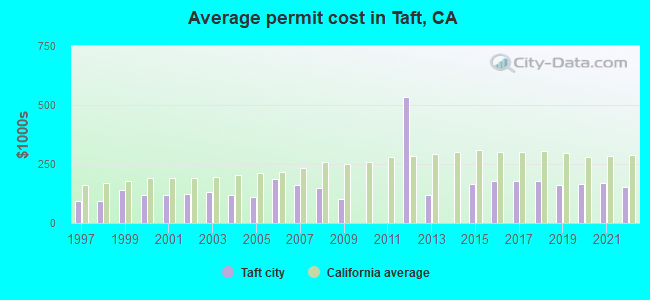
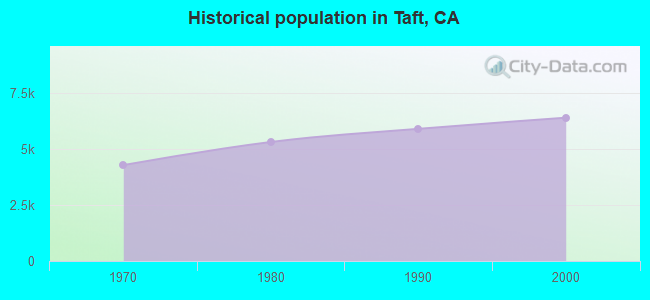
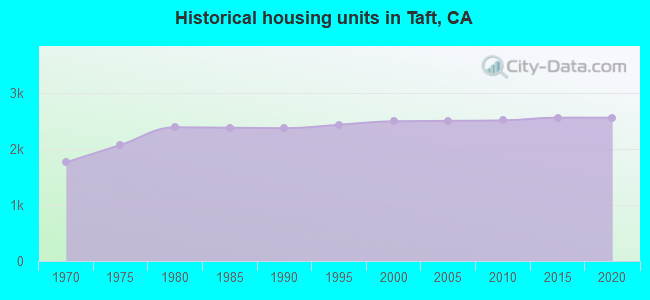
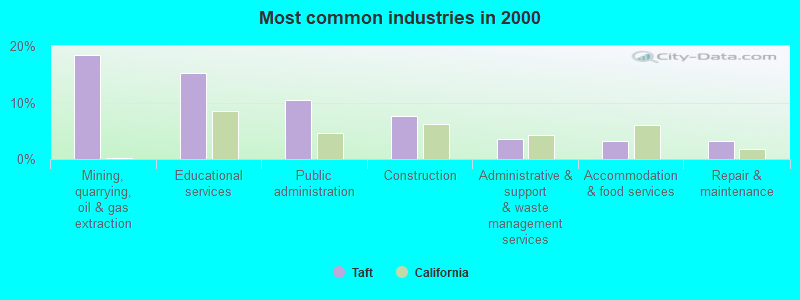
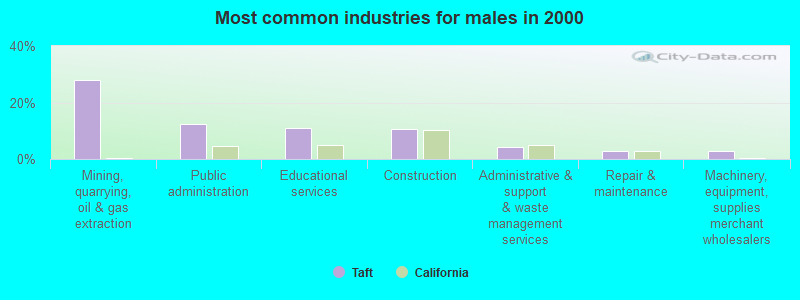
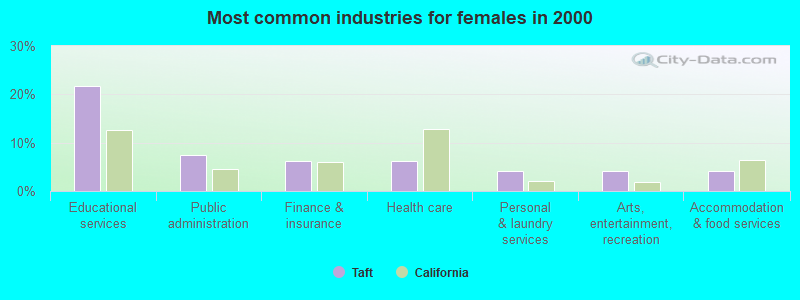
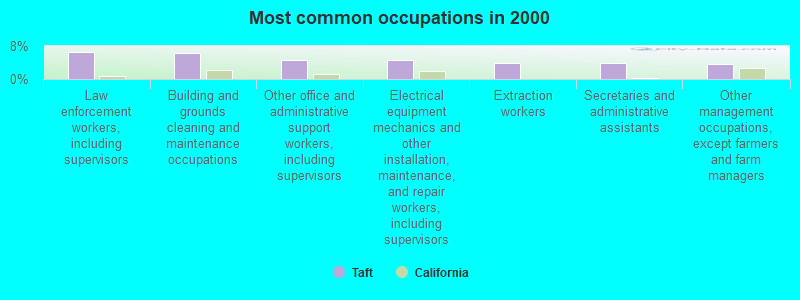
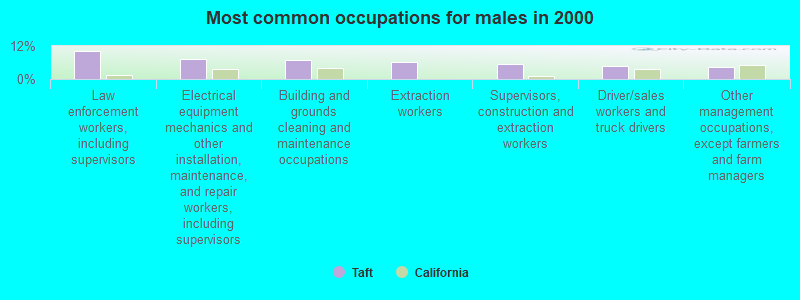
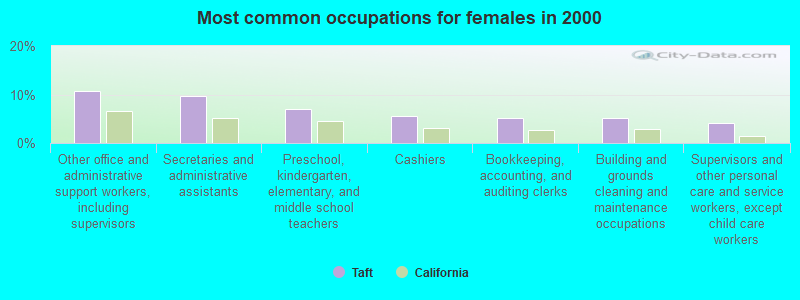
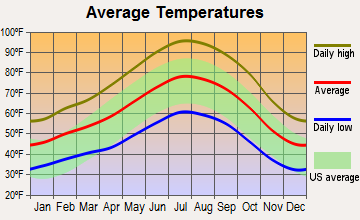
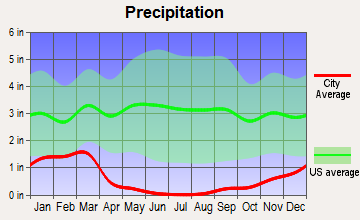
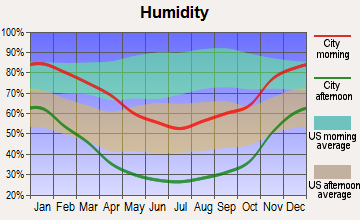
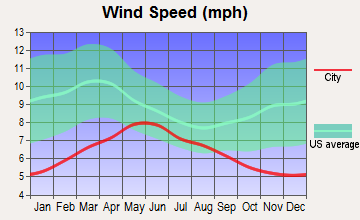
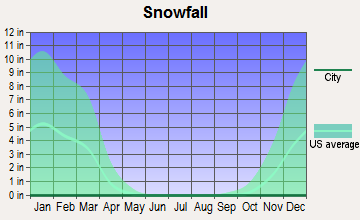
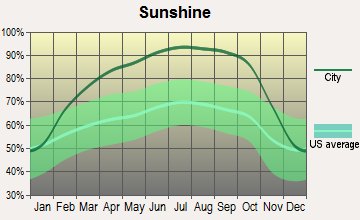
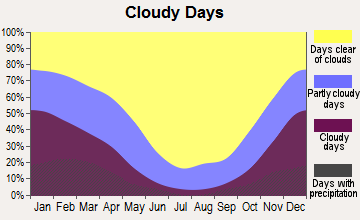
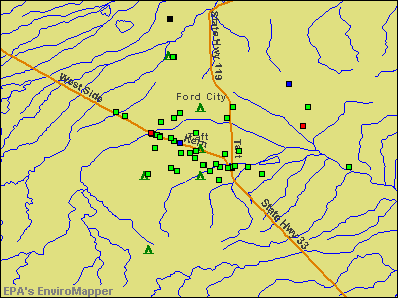

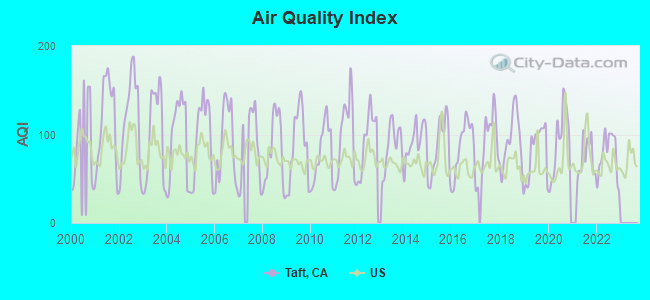
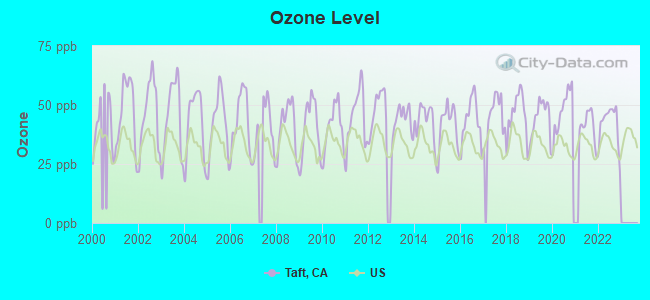
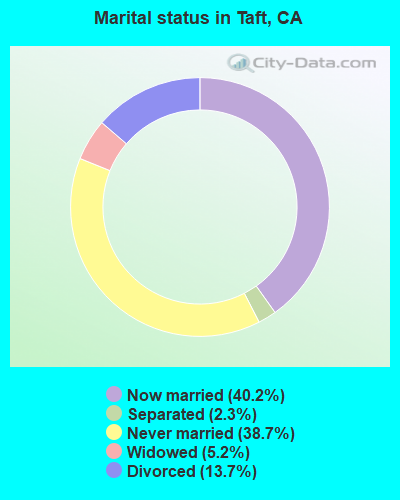
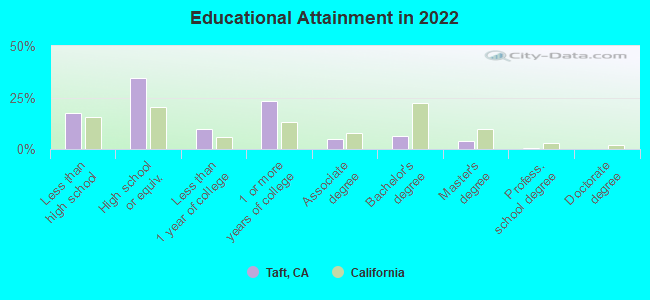
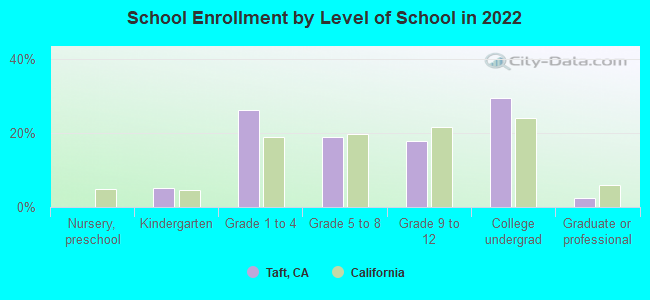
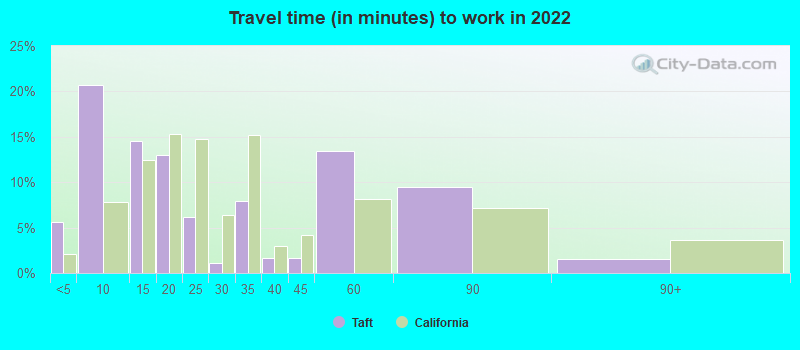
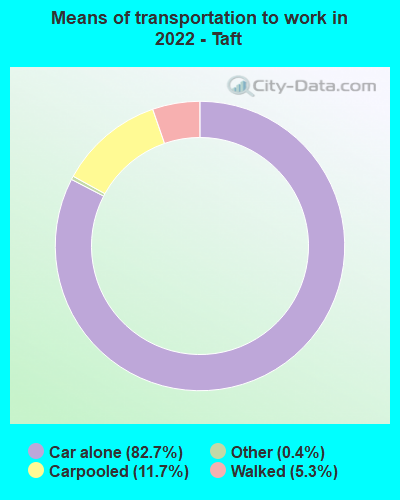
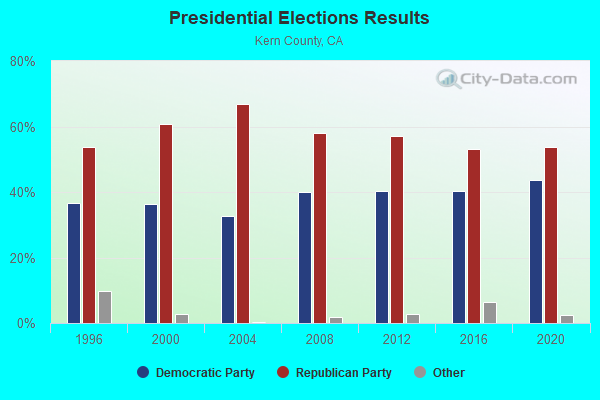
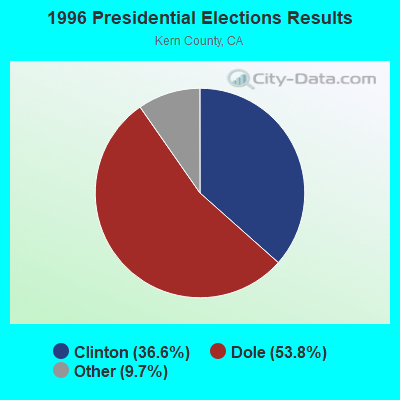
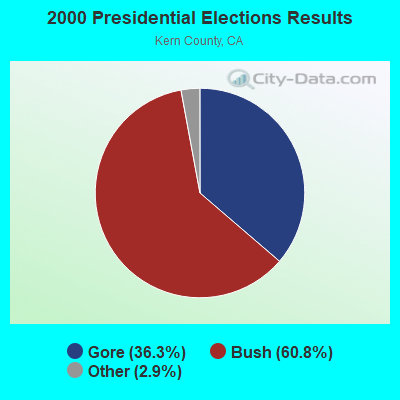
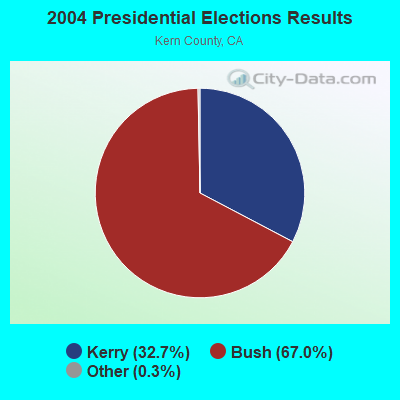
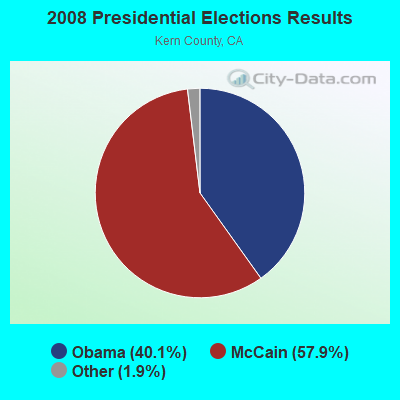
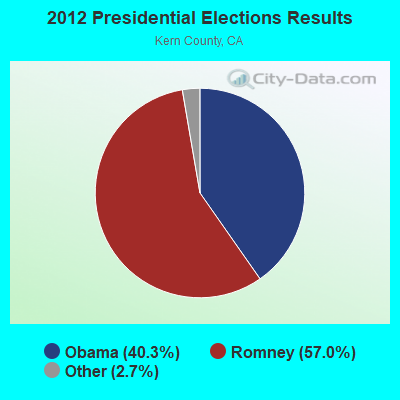
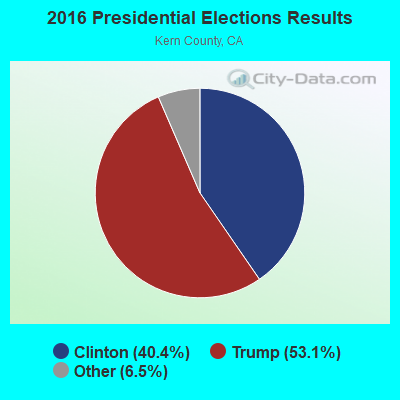
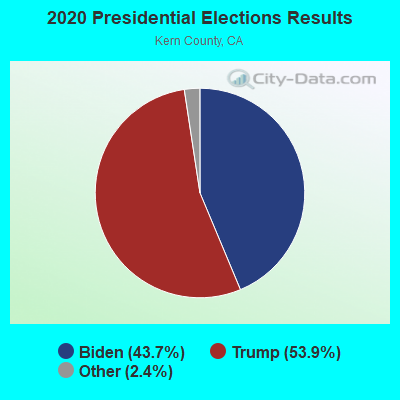
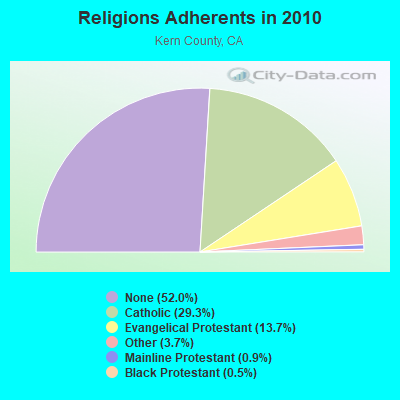
 Based on the data from the years 2005 - 2018 the average number of fires per year is 40. The highest number of fires - 89 took place in 2018, and the least - 0 in 2010. The data has a growing trend.
 When looking into fire subcategories, the most incidents belonged to: Structure Fires (44.0%), and Outside Fires (40.7%).