North Canton, Ohio Submit your own pictures of this city and show them to the world
OSM Map
General Map
Google Map
MSN Map
OSM Map
General Map
Google Map
MSN Map
OSM Map
General Map
Google Map
MSN Map
OSM Map
General Map
Google Map
MSN Map
Please wait while loading the map...
Population in 2022: 17,687 (100% urban, 0% rural). Population change since 2000: +8.1%Males: 8,200 Females: 9,487
March 2022 cost of living index in North Canton: 89.9 (less than average, U.S. average is 100) Percentage of residents living in poverty in 2022: 7.0%for White Non-Hispanic residents , 24.1% for Black residents , 21.6% for Hispanic or Latino residents , 16.3% for other race residents , 25.8% for two or more races residents )
Profiles of local businesses
Business Search - 14 Million verified businesses
Data:
Median household income ($)
Median household income (% change since 2000)
Household income diversity
Ratio of average income to average house value (%)
Ratio of average income to average rent
Median household income ($) - White
Median household income ($) - Black or African American
Median household income ($) - Asian
Median household income ($) - Hispanic or Latino
Median household income ($) - American Indian and Alaska Native
Median household income ($) - Multirace
Median household income ($) - Other Race
Median household income for houses/condos with a mortgage ($)
Median household income for apartments without a mortgage ($)
Races - White alone (%)
Races - White alone (% change since 2000)
Races - Black alone (%)
Races - Black alone (% change since 2000)
Races - American Indian alone (%)
Races - American Indian alone (% change since 2000)
Races - Asian alone (%)
Races - Asian alone (% change since 2000)
Races - Hispanic (%)
Races - Hispanic (% change since 2000)
Races - Native Hawaiian and Other Pacific Islander alone (%)
Races - Native Hawaiian and Other Pacific Islander alone (% change since 2000)
Races - Two or more races (%)
Races - Two or more races (% change since 2000)
Races - Other race alone (%)
Races - Other race alone (% change since 2000)
Racial diversity
Unemployment (%)
Unemployment (% change since 2000)
Unemployment (%) - White
Unemployment (%) - Black or African American
Unemployment (%) - Asian
Unemployment (%) - Hispanic or Latino
Unemployment (%) - American Indian and Alaska Native
Unemployment (%) - Multirace
Unemployment (%) - Other Race
Population density (people per square mile)
Population - Males (%)
Population - Females (%)
Population - Males (%) - White
Population - Males (%) - Black or African American
Population - Males (%) - Asian
Population - Males (%) - Hispanic or Latino
Population - Males (%) - American Indian and Alaska Native
Population - Males (%) - Multirace
Population - Males (%) - Other Race
Population - Females (%) - White
Population - Females (%) - Black or African American
Population - Females (%) - Asian
Population - Females (%) - Hispanic or Latino
Population - Females (%) - American Indian and Alaska Native
Population - Females (%) - Multirace
Population - Females (%) - Other Race
Coronavirus confirmed cases (Jun 08, 2024)
Deaths caused by coronavirus (Jun 08, 2024)
Coronavirus confirmed cases (per 100k population) (Jun 08, 2024)
Deaths caused by coronavirus (per 100k population) (Jun 08, 2024)
Daily increase in number of cases (Jun 08, 2024)
Weekly increase in number of cases (Jun 08, 2024)
Cases doubled (in days) (Jun 08, 2024)
Hospitalized patients (Apr 18, 2022)
Negative test results (Apr 18, 2022)
Total test results (Apr 18, 2022)
COVID Vaccine doses distributed (per 100k population) (Sep 19, 2023)
COVID Vaccine doses administered (per 100k population) (Sep 19, 2023)
COVID Vaccine doses distributed (Sep 19, 2023)
COVID Vaccine doses administered (Sep 19, 2023)
Likely homosexual households (%)
Likely homosexual households (% change since 2000)
Likely homosexual households - Lesbian couples (%)
Likely homosexual households - Lesbian couples (% change since 2000)
Likely homosexual households - Gay men (%)
Likely homosexual households - Gay men (% change since 2000)
Cost of living index
Median gross rent ($)
Median contract rent ($)
Median monthly housing costs ($)
Median house or condo value ($)
Median house or condo value ($ change since 2000)
Mean house or condo value by units in structure - 1, detached ($)
Mean house or condo value by units in structure - 1, attached ($)
Mean house or condo value by units in structure - 2 ($)
Mean house or condo value by units in structure by units in structure - 3 or 4 ($)
Mean house or condo value by units in structure - 5 or more ($)
Mean house or condo value by units in structure - Boat, RV, van, etc. ($)
Mean house or condo value by units in structure - Mobile home ($)
Median house or condo value ($) - White
Median house or condo value ($) - Black or African American
Median house or condo value ($) - Asian
Median house or condo value ($) - Hispanic or Latino
Median house or condo value ($) - American Indian and Alaska Native
Median house or condo value ($) - Multirace
Median house or condo value ($) - Other Race
Median resident age
Resident age diversity
Median resident age - Males
Median resident age - Females
Median resident age - White
Median resident age - Black or African American
Median resident age - Asian
Median resident age - Hispanic or Latino
Median resident age - American Indian and Alaska Native
Median resident age - Multirace
Median resident age - Other Race
Median resident age - Males - White
Median resident age - Males - Black or African American
Median resident age - Males - Asian
Median resident age - Males - Hispanic or Latino
Median resident age - Males - American Indian and Alaska Native
Median resident age - Males - Multirace
Median resident age - Males - Other Race
Median resident age - Females - White
Median resident age - Females - Black or African American
Median resident age - Females - Asian
Median resident age - Females - Hispanic or Latino
Median resident age - Females - American Indian and Alaska Native
Median resident age - Females - Multirace
Median resident age - Females - Other Race
Commute - mean travel time to work (minutes)
Travel time to work - Less than 5 minutes (%)
Travel time to work - Less than 5 minutes (% change since 2000)
Travel time to work - 5 to 9 minutes (%)
Travel time to work - 5 to 9 minutes (% change since 2000)
Travel time to work - 10 to 19 minutes (%)
Travel time to work - 10 to 19 minutes (% change since 2000)
Travel time to work - 20 to 29 minutes (%)
Travel time to work - 20 to 29 minutes (% change since 2000)
Travel time to work - 30 to 39 minutes (%)
Travel time to work - 30 to 39 minutes (% change since 2000)
Travel time to work - 40 to 59 minutes (%)
Travel time to work - 40 to 59 minutes (% change since 2000)
Travel time to work - 60 to 89 minutes (%)
Travel time to work - 60 to 89 minutes (% change since 2000)
Travel time to work - 90 or more minutes (%)
Travel time to work - 90 or more minutes (% change since 2000)
Marital status - Never married (%)
Marital status - Now married (%)
Marital status - Separated (%)
Marital status - Widowed (%)
Marital status - Divorced (%)
Median family income ($)
Median family income (% change since 2000)
Median non-family income ($)
Median non-family income (% change since 2000)
Median per capita income ($)
Median per capita income (% change since 2000)
Median family income ($) - White
Median family income ($) - Black or African American
Median family income ($) - Asian
Median family income ($) - Hispanic or Latino
Median family income ($) - American Indian and Alaska Native
Median family income ($) - Multirace
Median family income ($) - Other Race
Median year house/condo built
Median year apartment built
Year house built - Built 2005 or later (%)
Year house built - Built 2000 to 2004 (%)
Year house built - Built 1990 to 1999 (%)
Year house built - Built 1980 to 1989 (%)
Year house built - Built 1970 to 1979 (%)
Year house built - Built 1960 to 1969 (%)
Year house built - Built 1950 to 1959 (%)
Year house built - Built 1940 to 1949 (%)
Year house built - Built 1939 or earlier (%)
Average household size
Household density (households per square mile)
Average household size - White
Average household size - Black or African American
Average household size - Asian
Average household size - Hispanic or Latino
Average household size - American Indian and Alaska Native
Average household size - Multirace
Average household size - Other Race
Occupied housing units (%)
Vacant housing units (%)
Owner occupied housing units (%)
Renter occupied housing units (%)
Vacancy status - For rent (%)
Vacancy status - For sale only (%)
Vacancy status - Rented or sold, not occupied (%)
Vacancy status - For seasonal, recreational, or occasional use (%)
Vacancy status - For migrant workers (%)
Vacancy status - Other vacant (%)
Residents with income below the poverty level (%)
Residents with income below 50% of the poverty level (%)
Children below poverty level (%)
Poor families by family type - Married-couple family (%)
Poor families by family type - Male, no wife present (%)
Poor families by family type - Female, no husband present (%)
Poverty status for native-born residents (%)
Poverty status for foreign-born residents (%)
Poverty among high school graduates not in families (%)
Poverty among people who did not graduate high school not in families (%)
Residents with income below the poverty level (%) - White
Residents with income below the poverty level (%) - Black or African American
Residents with income below the poverty level (%) - Asian
Residents with income below the poverty level (%) - Hispanic or Latino
Residents with income below the poverty level (%) - American Indian and Alaska Native
Residents with income below the poverty level (%) - Multirace
Residents with income below the poverty level (%) - Other Race
Air pollution - Air Quality Index (AQI)
Air pollution - CO
Air pollution - NO2
Air pollution - SO2
Air pollution - Ozone
Air pollution - PM10
Air pollution - PM25
Air pollution - Pb
Crime - Murders per 100,000 population
Crime - Rapes per 100,000 population
Crime - Robberies per 100,000 population
Crime - Assaults per 100,000 population
Crime - Burglaries per 100,000 population
Crime - Thefts per 100,000 population
Crime - Auto thefts per 100,000 population
Crime - Arson per 100,000 population
Crime - City-data.com crime index
Crime - Violent crime index
Crime - Property crime index
Crime - Murders per 100,000 population (5 year average)
Crime - Rapes per 100,000 population (5 year average)
Crime - Robberies per 100,000 population (5 year average)
Crime - Assaults per 100,000 population (5 year average)
Crime - Burglaries per 100,000 population (5 year average)
Crime - Thefts per 100,000 population (5 year average)
Crime - Auto thefts per 100,000 population (5 year average)
Crime - Arson per 100,000 population (5 year average)
Crime - City-data.com crime index (5 year average)
Crime - Violent crime index (5 year average)
Crime - Property crime index (5 year average)
1996 Presidential Elections Results (%) - Democratic Party (Clinton)
1996 Presidential Elections Results (%) - Republican Party (Dole)
1996 Presidential Elections Results (%) - Other
2000 Presidential Elections Results (%) - Democratic Party (Gore)
2000 Presidential Elections Results (%) - Republican Party (Bush)
2000 Presidential Elections Results (%) - Other
2004 Presidential Elections Results (%) - Democratic Party (Kerry)
2004 Presidential Elections Results (%) - Republican Party (Bush)
2004 Presidential Elections Results (%) - Other
2008 Presidential Elections Results (%) - Democratic Party (Obama)
2008 Presidential Elections Results (%) - Republican Party (McCain)
2008 Presidential Elections Results (%) - Other
2012 Presidential Elections Results (%) - Democratic Party (Obama)
2012 Presidential Elections Results (%) - Republican Party (Romney)
2012 Presidential Elections Results (%) - Other
2016 Presidential Elections Results (%) - Democratic Party (Clinton)
2016 Presidential Elections Results (%) - Republican Party (Trump)
2016 Presidential Elections Results (%) - Other
2020 Presidential Elections Results (%) - Democratic Party (Biden)
2020 Presidential Elections Results (%) - Republican Party (Trump)
2020 Presidential Elections Results (%) - Other
Ancestries Reported - Arab (%)
Ancestries Reported - Czech (%)
Ancestries Reported - Danish (%)
Ancestries Reported - Dutch (%)
Ancestries Reported - English (%)
Ancestries Reported - French (%)
Ancestries Reported - French Canadian (%)
Ancestries Reported - German (%)
Ancestries Reported - Greek (%)
Ancestries Reported - Hungarian (%)
Ancestries Reported - Irish (%)
Ancestries Reported - Italian (%)
Ancestries Reported - Lithuanian (%)
Ancestries Reported - Norwegian (%)
Ancestries Reported - Polish (%)
Ancestries Reported - Portuguese (%)
Ancestries Reported - Russian (%)
Ancestries Reported - Scotch-Irish (%)
Ancestries Reported - Scottish (%)
Ancestries Reported - Slovak (%)
Ancestries Reported - Subsaharan African (%)
Ancestries Reported - Swedish (%)
Ancestries Reported - Swiss (%)
Ancestries Reported - Ukrainian (%)
Ancestries Reported - United States (%)
Ancestries Reported - Welsh (%)
Ancestries Reported - West Indian (%)
Ancestries Reported - Other (%)
Educational Attainment - No schooling completed (%)
Educational Attainment - Less than high school (%)
Educational Attainment - High school or equivalent (%)
Educational Attainment - Less than 1 year of college (%)
Educational Attainment - 1 or more years of college (%)
Educational Attainment - Associate degree (%)
Educational Attainment - Bachelor's degree (%)
Educational Attainment - Master's degree (%)
Educational Attainment - Professional school degree (%)
Educational Attainment - Doctorate degree (%)
School Enrollment - Nursery, preschool (%)
School Enrollment - Kindergarten (%)
School Enrollment - Grade 1 to 4 (%)
School Enrollment - Grade 5 to 8 (%)
School Enrollment - Grade 9 to 12 (%)
School Enrollment - College undergrad (%)
School Enrollment - Graduate or professional (%)
School Enrollment - Not enrolled in school (%)
School enrollment - Public schools (%)
School enrollment - Private schools (%)
School enrollment - Not enrolled (%)
Median number of rooms in houses and condos
Median number of rooms in apartments
Housing units lacking complete plumbing facilities (%)
Housing units lacking complete kitchen facilities (%)
Density of houses
Urban houses (%)
Rural houses (%)
Households with people 60 years and over (%)
Households with people 65 years and over (%)
Households with people 75 years and over (%)
Households with one or more nonrelatives (%)
Households with no nonrelatives (%)
Population in households (%)
Family households (%)
Nonfamily households (%)
Population in families (%)
Family households with own children (%)
Median number of bedrooms in owner occupied houses
Mean number of bedrooms in owner occupied houses
Median number of bedrooms in renter occupied houses
Mean number of bedrooms in renter occupied houses
Median number of vehichles in owner occupied houses
Mean number of vehichles in owner occupied houses
Median number of vehichles in renter occupied houses
Mean number of vehichles in renter occupied houses
Mortgage status - with mortgage (%)
Mortgage status - with second mortgage (%)
Mortgage status - with home equity loan (%)
Mortgage status - with both second mortgage and home equity loan (%)
Mortgage status - without a mortgage (%)
Average family size
Average family size - White
Average family size - Black or African American
Average family size - Asian
Average family size - Hispanic or Latino
Average family size - American Indian and Alaska Native
Average family size - Multirace
Average family size - Other Race
Geographical mobility - Same house 1 year ago (%)
Geographical mobility - Moved within same county (%)
Geographical mobility - Moved from different county within same state (%)
Geographical mobility - Moved from different state (%)
Geographical mobility - Moved from abroad (%)
Place of birth - Born in state of residence (%)
Place of birth - Born in other state (%)
Place of birth - Native, outside of US (%)
Place of birth - Foreign born (%)
Housing units in structures - 1, detached (%)
Housing units in structures - 1, attached (%)
Housing units in structures - 2 (%)
Housing units in structures - 3 or 4 (%)
Housing units in structures - 5 to 9 (%)
Housing units in structures - 10 to 19 (%)
Housing units in structures - 20 to 49 (%)
Housing units in structures - 50 or more (%)
Housing units in structures - Mobile home (%)
Housing units in structures - Boat, RV, van, etc. (%)
House/condo owner moved in on average (years ago)
Renter moved in on average (years ago)
Year householder moved into unit - Moved in 1999 to March 2000 (%)
Year householder moved into unit - Moved in 1995 to 1998 (%)
Year householder moved into unit - Moved in 1990 to 1994 (%)
Year householder moved into unit - Moved in 1980 to 1989 (%)
Year householder moved into unit - Moved in 1970 to 1979 (%)
Year householder moved into unit - Moved in 1969 or earlier (%)
Means of transportation to work - Drove car alone (%)
Means of transportation to work - Carpooled (%)
Means of transportation to work - Public transportation (%)
Means of transportation to work - Bus or trolley bus (%)
Means of transportation to work - Streetcar or trolley car (%)
Means of transportation to work - Subway or elevated (%)
Means of transportation to work - Railroad (%)
Means of transportation to work - Ferryboat (%)
Means of transportation to work - Taxicab (%)
Means of transportation to work - Motorcycle (%)
Means of transportation to work - Bicycle (%)
Means of transportation to work - Walked (%)
Means of transportation to work - Other means (%)
Working at home (%)
Industry diversity
Most Common Industries - Agriculture, forestry, fishing and hunting, and mining (%)
Most Common Industries - Agriculture, forestry, fishing and hunting (%)
Most Common Industries - Mining, quarrying, and oil and gas extraction (%)
Most Common Industries - Construction (%)
Most Common Industries - Manufacturing (%)
Most Common Industries - Wholesale trade (%)
Most Common Industries - Retail trade (%)
Most Common Industries - Transportation and warehousing, and utilities (%)
Most Common Industries - Transportation and warehousing (%)
Most Common Industries - Utilities (%)
Most Common Industries - Information (%)
Most Common Industries - Finance and insurance, and real estate and rental and leasing (%)
Most Common Industries - Finance and insurance (%)
Most Common Industries - Real estate and rental and leasing (%)
Most Common Industries - Professional, scientific, and management, and administrative and waste management services (%)
Most Common Industries - Professional, scientific, and technical services (%)
Most Common Industries - Management of companies and enterprises (%)
Most Common Industries - Administrative and support and waste management services (%)
Most Common Industries - Educational services, and health care and social assistance (%)
Most Common Industries - Educational services (%)
Most Common Industries - Health care and social assistance (%)
Most Common Industries - Arts, entertainment, and recreation, and accommodation and food services (%)
Most Common Industries - Arts, entertainment, and recreation (%)
Most Common Industries - Accommodation and food services (%)
Most Common Industries - Other services, except public administration (%)
Most Common Industries - Public administration (%)
Occupation diversity
Most Common Occupations - Management, business, science, and arts occupations (%)
Most Common Occupations - Management, business, and financial occupations (%)
Most Common Occupations - Management occupations (%)
Most Common Occupations - Business and financial operations occupations (%)
Most Common Occupations - Computer, engineering, and science occupations (%)
Most Common Occupations - Computer and mathematical occupations (%)
Most Common Occupations - Architecture and engineering occupations (%)
Most Common Occupations - Life, physical, and social science occupations (%)
Most Common Occupations - Education, legal, community service, arts, and media occupations (%)
Most Common Occupations - Community and social service occupations (%)
Most Common Occupations - Legal occupations (%)
Most Common Occupations - Education, training, and library occupations (%)
Most Common Occupations - Arts, design, entertainment, sports, and media occupations (%)
Most Common Occupations - Healthcare practitioners and technical occupations (%)
Most Common Occupations - Health diagnosing and treating practitioners and other technical occupations (%)
Most Common Occupations - Health technologists and technicians (%)
Most Common Occupations - Service occupations (%)
Most Common Occupations - Healthcare support occupations (%)
Most Common Occupations - Protective service occupations (%)
Most Common Occupations - Fire fighting and prevention, and other protective service workers including supervisors (%)
Most Common Occupations - Law enforcement workers including supervisors (%)
Most Common Occupations - Food preparation and serving related occupations (%)
Most Common Occupations - Building and grounds cleaning and maintenance occupations (%)
Most Common Occupations - Personal care and service occupations (%)
Most Common Occupations - Sales and office occupations (%)
Most Common Occupations - Sales and related occupations (%)
Most Common Occupations - Office and administrative support occupations (%)
Most Common Occupations - Natural resources, construction, and maintenance occupations (%)
Most Common Occupations - Farming, fishing, and forestry occupations (%)
Most Common Occupations - Construction and extraction occupations (%)
Most Common Occupations - Installation, maintenance, and repair occupations (%)
Most Common Occupations - Production, transportation, and material moving occupations (%)
Most Common Occupations - Production occupations (%)
Most Common Occupations - Transportation occupations (%)
Most Common Occupations - Material moving occupations (%)
People in Group quarters - Institutionalized population (%)
People in Group quarters - Correctional institutions (%)
People in Group quarters - Federal prisons and detention centers (%)
People in Group quarters - Halfway houses (%)
People in Group quarters - Local jails and other confinement facilities (including police lockups) (%)
People in Group quarters - Military disciplinary barracks (%)
People in Group quarters - State prisons (%)
People in Group quarters - Other types of correctional institutions (%)
People in Group quarters - Nursing homes (%)
People in Group quarters - Hospitals/wards, hospices, and schools for the handicapped (%)
People in Group quarters - Hospitals/wards and hospices for chronically ill (%)
People in Group quarters - Hospices or homes for chronically ill (%)
People in Group quarters - Military hospitals or wards for chronically ill (%)
People in Group quarters - Other hospitals or wards for chronically ill (%)
People in Group quarters - Hospitals or wards for drug/alcohol abuse (%)
People in Group quarters - Mental (Psychiatric) hospitals or wards (%)
People in Group quarters - Schools, hospitals, or wards for the mentally retarded (%)
People in Group quarters - Schools, hospitals, or wards for the physically handicapped (%)
People in Group quarters - Institutions for the deaf (%)
People in Group quarters - Institutions for the blind (%)
People in Group quarters - Orthopedic wards and institutions for the physically handicapped (%)
People in Group quarters - Wards in general hospitals for patients who have no usual home elsewhere (%)
People in Group quarters - Wards in military hospitals for patients who have no usual home elsewhere (%)
People in Group quarters - Juvenile institutions (%)
People in Group quarters - Long-term care (%)
People in Group quarters - Homes for abused, dependent, and neglected children (%)
People in Group quarters - Residential treatment centers for emotionally disturbed children (%)
People in Group quarters - Training schools for juvenile delinquents (%)
People in Group quarters - Short-term care, detention or diagnostic centers for delinquent children (%)
People in Group quarters - Type of juvenile institution unknown (%)
People in Group quarters - Noninstitutionalized population (%)
People in Group quarters - College dormitories (includes college quarters off campus) (%)
People in Group quarters - Military quarters (%)
People in Group quarters - On base (%)
People in Group quarters - Barracks, unaccompanied personnel housing (UPH), (Enlisted/Officer), ;and similar group living quarters for military personnel (%)
People in Group quarters - Transient quarters for temporary residents (%)
People in Group quarters - Military ships (%)
People in Group quarters - Group homes (%)
People in Group quarters - Homes or halfway houses for drug/alcohol abuse (%)
People in Group quarters - Homes for the mentally ill (%)
People in Group quarters - Homes for the mentally retarded (%)
People in Group quarters - Homes for the physically handicapped (%)
People in Group quarters - Other group homes (%)
People in Group quarters - Religious group quarters (%)
People in Group quarters - Dormitories (%)
People in Group quarters - Agriculture workers' dormitories on farms (%)
People in Group quarters - Job Corps and vocational training facilities (%)
People in Group quarters - Other workers' dormitories (%)
People in Group quarters - Crews of maritime vessels (%)
People in Group quarters - Other nonhousehold living situations (%)
People in Group quarters - Other noninstitutional group quarters (%)
Residents speaking English at home (%)
Residents speaking English at home - Born in the United States (%)
Residents speaking English at home - Native, born elsewhere (%)
Residents speaking English at home - Foreign born (%)
Residents speaking Spanish at home (%)
Residents speaking Spanish at home - Born in the United States (%)
Residents speaking Spanish at home - Native, born elsewhere (%)
Residents speaking Spanish at home - Foreign born (%)
Residents speaking other language at home (%)
Residents speaking other language at home - Born in the United States (%)
Residents speaking other language at home - Native, born elsewhere (%)
Residents speaking other language at home - Foreign born (%)
Class of Workers - Employee of private company (%)
Class of Workers - Self-employed in own incorporated business (%)
Class of Workers - Private not-for-profit wage and salary workers (%)
Class of Workers - Local government workers (%)
Class of Workers - State government workers (%)
Class of Workers - Federal government workers (%)
Class of Workers - Self-employed workers in own not incorporated business and Unpaid family workers (%)
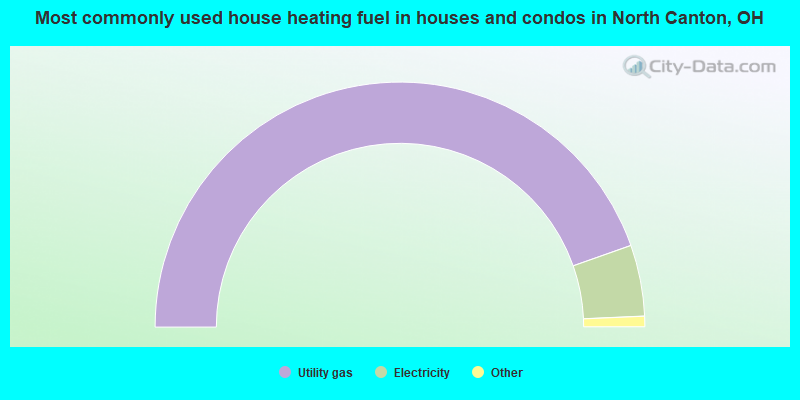
House heating fuel used in houses and condos - Utility gas (%)
House heating fuel used in houses and condos - Bottled, tank, or LP gas (%)
House heating fuel used in houses and condos - Electricity (%)
House heating fuel used in houses and condos - Fuel oil, kerosene, etc. (%)
House heating fuel used in houses and condos - Coal or coke (%)
House heating fuel used in houses and condos - Wood (%)
House heating fuel used in houses and condos - Solar energy (%)
House heating fuel used in houses and condos - Other fuel (%)
House heating fuel used in houses and condos - No fuel used (%)
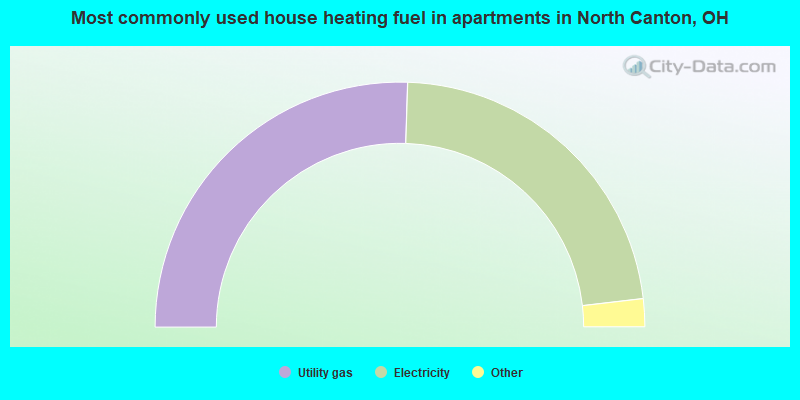
House heating fuel used in apartments - Utility gas (%)
House heating fuel used in apartments - Bottled, tank, or LP gas (%)
House heating fuel used in apartments - Electricity (%)
House heating fuel used in apartments - Fuel oil, kerosene, etc. (%)
House heating fuel used in apartments - Coal or coke (%)
House heating fuel used in apartments - Wood (%)
House heating fuel used in apartments - Solar energy (%)
House heating fuel used in apartments - Other fuel (%)
House heating fuel used in apartments - No fuel used (%)
Armed forces status - In Armed Forces (%)
Armed forces status - Civilian (%)
Armed forces status - Civilian - Veteran (%)
Armed forces status - Civilian - Nonveteran (%)
Fatal accidents locations in years 2005-2021
Fatal accidents locations in 2005
Fatal accidents locations in 2006
Fatal accidents locations in 2007
Fatal accidents locations in 2008
Fatal accidents locations in 2009
Fatal accidents locations in 2010
Fatal accidents locations in 2011
Fatal accidents locations in 2012
Fatal accidents locations in 2013
Fatal accidents locations in 2014
Fatal accidents locations in 2015
Fatal accidents locations in 2016
Fatal accidents locations in 2017
Fatal accidents locations in 2018
Fatal accidents locations in 2019
Fatal accidents locations in 2020
Fatal accidents locations in 2021
Alcohol use - People drinking some alcohol every month (%)
Alcohol use - People not drinking at all (%)
Alcohol use - Average days/month drinking alcohol
Alcohol use - Average drinks/week
Alcohol use - Average days/year people drink much
Audiometry - Average condition of hearing (%)
Audiometry - People that can hear a whisper from across a quiet room (%)
Audiometry - People that can hear normal voice from across a quiet room (%)
Audiometry - Ears ringing, roaring, buzzing (%)
Audiometry - Had a job exposure to loud noise (%)
Audiometry - Had off-work exposure to loud noise (%)
Blood Pressure & Cholesterol - Has high blood pressure (%)
Blood Pressure & Cholesterol - Checking blood pressure at home (%)
Blood Pressure & Cholesterol - Frequently checking blood cholesterol (%)
Blood Pressure & Cholesterol - Has high cholesterol level (%)
Consumer Behavior - Money monthly spent on food at supermarket/grocery store
Consumer Behavior - Money monthly spent on food at other stores
Consumer Behavior - Money monthly spent on eating out
Consumer Behavior - Money monthly spent on carryout/delivered foods
Consumer Behavior - Income spent on food at supermarket/grocery store (%)
Consumer Behavior - Income spent on food at other stores (%)
Consumer Behavior - Income spent on eating out (%)
Consumer Behavior - Income spent on carryout/delivered foods (%)
Current Health Status - General health condition (%)
Current Health Status - Blood donors (%)
Current Health Status - Has blood ever tested for HIV virus (%)
Current Health Status - Left-handed people (%)
Dermatology - People using sunscreen (%)
Diabetes - Diabetics (%)
Diabetes - Had a blood test for high blood sugar (%)
Diabetes - People taking insulin (%)
Diet Behavior & Nutrition - Diet health (%)
Diet Behavior & Nutrition - Milk product consumption (# of products/month)
Diet Behavior & Nutrition - Meals not home prepared (#/week)
Diet Behavior & Nutrition - Meals from fast food or pizza place (#/week)
Diet Behavior & Nutrition - Ready-to-eat foods (#/month)
Diet Behavior & Nutrition - Frozen meals/pizza (#/month)
Drug Use - People that ever used marijuana or hashish (%)
Drug Use - Ever used hard drugs (%)
Drug Use - Ever used any form of cocaine (%)
Drug Use - Ever used heroin (%)
Drug Use - Ever used methamphetamine (%)
Health Insurance - People covered by health insurance (%)
Kidney Conditions-Urology - Avg. # of times urinating at night
Medical Conditions - People with asthma (%)
Medical Conditions - People with anemia (%)
Medical Conditions - People with psoriasis (%)
Medical Conditions - People with overweight (%)
Medical Conditions - Elderly people having difficulties in thinking or remembering (%)
Medical Conditions - People who ever received blood transfusion (%)
Medical Conditions - People having trouble seeing even with glass/contacts (%)
Medical Conditions - People with arthritis (%)
Medical Conditions - People with gout (%)
Medical Conditions - People with congestive heart failure (%)
Medical Conditions - People with coronary heart disease (%)
Medical Conditions - People with angina pectoris (%)
Medical Conditions - People who ever had heart attack (%)
Medical Conditions - People who ever had stroke (%)
Medical Conditions - People with emphysema (%)
Medical Conditions - People with thyroid problem (%)
Medical Conditions - People with chronic bronchitis (%)
Medical Conditions - People with any liver condition (%)
Medical Conditions - People who ever had cancer or malignancy (%)
Mental Health - People who have little interest in doing things (%)
Mental Health - People feeling down, depressed, or hopeless (%)
Mental Health - People who have trouble sleeping or sleeping too much (%)
Mental Health - People feeling tired or having little energy (%)
Mental Health - People with poor appetite or overeating (%)
Mental Health - People feeling bad about themself (%)
Mental Health - People who have trouble concentrating on things (%)
Mental Health - People moving or speaking slowly or too fast (%)
Mental Health - People having thoughts they would be better off dead (%)
Oral Health - Average years since last visit a dentist
Oral Health - People embarrassed because of mouth (%)
Oral Health - People with gum disease (%)
Oral Health - General health of teeth and gums (%)
Oral Health - Average days a week using dental floss/device
Oral Health - Average days a week using mouthwash for dental problem
Oral Health - Average number of teeth
Pesticide Use - Households using pesticides to control insects (%)
Pesticide Use - Households using pesticides to kill weeds (%)
Physical Activity - People doing vigorous-intensity work activities (%)
Physical Activity - People doing moderate-intensity work activities (%)
Physical Activity - People walking or bicycling (%)
Physical Activity - People doing vigorous-intensity recreational activities (%)
Physical Activity - People doing moderate-intensity recreational activities (%)
Physical Activity - Average hours a day doing sedentary activities
Physical Activity - Average hours a day watching TV or videos
Physical Activity - Average hours a day using computer
Physical Functioning - People having limitations keeping them from working (%)
Physical Functioning - People limited in amount of work they can do (%)
Physical Functioning - People that need special equipment to walk (%)
Physical Functioning - People experiencing confusion/memory problems (%)
Physical Functioning - People requiring special healthcare equipment (%)
Prescription Medications - Average number of prescription medicines taking
Preventive Aspirin Use - Adults 40+ taking low-dose aspirin (%)
Reproductive Health - Vaginal deliveries (%)
Reproductive Health - Cesarean deliveries (%)
Reproductive Health - Deliveries resulted in a live birth (%)
Reproductive Health - Pregnancies resulted in a delivery (%)
Reproductive Health - Women breastfeeding newborns (%)
Reproductive Health - Women that had a hysterectomy (%)
Reproductive Health - Women that had both ovaries removed (%)
Reproductive Health - Women that have ever taken birth control pills (%)
Reproductive Health - Women taking birth control pills (%)
Reproductive Health - Women that have ever used Depo-Provera or injectables (%)
Reproductive Health - Women that have ever used female hormones (%)
Sexual Behavior - People 18+ that ever had sex (vaginal, anal, or oral) (%)
Sexual Behavior - Males 18+ that ever had vaginal sex with a woman (%)
Sexual Behavior - Males 18+ that ever performed oral sex on a woman (%)
Sexual Behavior - Males 18+ that ever had anal sex with a woman (%)
Sexual Behavior - Males 18+ that ever had any sex with a man (%)
Sexual Behavior - Females 18+ that ever had vaginal sex with a man (%)
Sexual Behavior - Females 18+ that ever performed oral sex on a man (%)
Sexual Behavior - Females 18+ that ever had anal sex with a man (%)
Sexual Behavior - Females 18+ that ever had any kind of sex with a woman (%)
Sexual Behavior - Average age people first had sex
Sexual Behavior - Average number of female sex partners in lifetime (males 18+)
Sexual Behavior - Average number of female vaginal sex partners in lifetime (males 18+)
Sexual Behavior - Average age people first performed oral sex on a woman (18+)
Sexual Behavior - Average number of woman performed oral sex on in lifetime (18+)
Sexual Behavior - Average number of male sex partners in lifetime (males 18+)
Sexual Behavior - Average number of male anal sex partners in lifetime (males 18+)
Sexual Behavior - Average age people first performed oral sex on a man (18+)
Sexual Behavior - Average number of male oral sex partners in lifetime (18+)
Sexual Behavior - People using protection when performing oral sex (%)
Sexual Behavior - Average number of times people have vaginal or anal sex a year
Sexual Behavior - People having sex without condom (%)
Sexual Behavior - Average number of male sex partners in lifetime (females 18+)
Sexual Behavior - Average number of male vaginal sex partners in lifetime (females 18+)
Sexual Behavior - Average number of female sex partners in lifetime (females 18+)
Sexual Behavior - Circumcised males 18+ (%)
Sleep Disorders - Average hours sleeping at night
Sleep Disorders - People that has trouble sleeping (%)
Smoking-Cigarette Use - People smoking cigarettes (%)
Taste & Smell - People 40+ having problems with smell (%)
Taste & Smell - People 40+ having problems with taste (%)
Taste & Smell - People 40+ that ever had wisdom teeth removed (%)
Taste & Smell - People 40+ that ever had tonsils teeth removed (%)
Taste & Smell - People 40+ that ever had a loss of consciousness because of a head injury (%)
Taste & Smell - People 40+ that ever had a broken nose or other serious injury to face or skull (%)
Taste & Smell - People 40+ that ever had two or more sinus infections (%)
Weight - Average height (inches)
Weight - Average weight (pounds)
Weight - Average BMI
Weight - People that are obese (%)
Weight - People that ever were obese (%)
Weight - People trying to lose weight (%)
According to our research of Ohio and other state lists, there were 31 registered sex offenders living in North Canton, Ohio as of June 08, 2024 . The ratio of all residents to sex offenders in North Canton is 560 to 1.The ratio of registered sex offenders to all residents in this city is near the state average.
Officers per 1,000 residents here:
1.26Ohio average:
2.23
Latest news from North Canton, OH collected exclusively by city-data.com from local newspapers, TV, and radio stations
Ancestries: German (17.1%), Irish (11.1%), Italian (10.2%), American (9.0%), English (8.9%), European (4.6%).
Current Local Time:
Land area: 6.07 square miles.
Population density: 2,914 people per square mile (average).
349 residents are foreign born
Median real estate property taxes paid for housing units with mortgages in 2022: $2,808 (1.4%)Median real estate property taxes paid for housing units with no mortgage in 2022: $2,650 (1.4%)
Nearest city with pop. 50,000+: Canton, OH
Nearest city with pop. 200,000+: Akron, OH
Nearest city with pop. 1,000,000+: Chicago, IL
Nearest cities:
Latitude: 40.88 N, Longitude: 81.40 W
Daytime population change due to commuting: +74 (+0.4%)Workers who live and work in this city: 2,861 (30.6%)
Single-family new house construction building permits:
2022: 12 buildings , average cost: $505,0002021: 16 buildings , average cost: $420,3002020: 18 buildings , average cost: $369,7002019: 15 buildings , average cost: $410,3002017: 21 buildings , average cost: $324,0002016: 19 buildings , average cost: $324,0002015: 20 buildings , average cost: $304,4002014: 12 buildings , average cost: $290,0002013: 18 buildings , average cost: $319,5002012: 7 buildings , average cost: $249,1002011: 4 buildings , average cost: $258,4002010: 3 buildings , average cost: $380,6002009: 4 buildings , average cost: $208,3002008: 7 buildings , average cost: $385,2002007: 30 buildings , average cost: $191,9002006: 37 buildings , average cost: $10,2002005: 18 buildings , average cost: $218,2002004: 57 buildings , average cost: $212,4002003: 55 buildings , average cost: $220,0002002: 54 buildings , average cost: $219,2002001: 49 buildings , average cost: $242,1002000: 63 buildings , average cost: $212,7001999: 92 buildings , average cost: $232,8001998: 62 buildings , average cost: $203,9001997: 31 buildings , average cost: $164,400Unemployment in December 2023:
Population change in the 1990s: +995 (+6.5%).
Most common industries in North Canton, OH (%)
Both Males Females
Health care (11.9%)
Educational services (11.3%)
Finance & insurance (5.3%)
Accommodation & food services (5.2%)
Electrical equipment, appliances, components (5.1%)
Metal & metal products (4.5%)
Professional, scientific, technical services (4.5%)
Electrical equipment, appliances, components (8.3%)
Metal & metal products (6.9%)
Health care (6.2%)
Construction (6.0%)
Educational services (5.8%)
Professional, scientific, technical services (5.0%)
Accommodation & food services (4.5%)
Health care (17.9%)
Educational services (17.0%)
Finance & insurance (7.0%)
Accommodation & food services (5.9%)
Professional, scientific, technical services (4.0%)
Public administration (3.6%)
Social assistance (3.4%)
Most common occupations in North Canton, OH (%)
Both Males Females
Other management occupations, except farmers and farm managers (5.0%)
Other office and administrative support workers, including supervisors (4.9%)
Preschool, kindergarten, elementary, and middle school teachers (3.9%)
Other sales and related occupations, including supervisors (3.8%)
Other production occupations, including supervisors (3.6%)
Sales representatives, services, wholesale and manufacturing (3.3%)
Retail sales workers, except cashiers (2.9%)
Other management occupations, except farmers and farm managers (6.1%)
Other production occupations, including supervisors (5.4%)
Engineers (5.0%)
Other sales and related occupations, including supervisors (4.1%)
Sales representatives, services, wholesale and manufacturing (4.0%)
Metal workers and plastic workers (3.8%)
Retail sales workers, except cashiers (3.3%)
Other office and administrative support workers, including supervisors (7.9%)
Preschool, kindergarten, elementary, and middle school teachers (5.8%)
Secretaries and administrative assistants (5.5%)
Health technologists and technicians (4.4%)
Bookkeeping, accounting, and auditing clerks (4.3%)
Registered nurses (4.0%)
Information and record clerks, except customer service representatives (4.0%)
Tornado activity:
North Canton-area historical tornado activity is near Ohio state average. It is 11% greater than the overall U.S. average.
On 5/31/1985, a category F5 (max. wind speeds 261-318 mph) tornado 26.0 miles away from the North Canton city center killed 18 people and injured 310 people and caused between $50,000,000 and $500,000,000 in damages.
On 4/11/1965, a category F4 (max. wind speeds 207-260 mph) tornado 38.6 miles away from the city center killed 18 people and injured 200 people and caused between $5,000,000 and $50,000,000 in damages.
Earthquake activity:
North Canton-area historical earthquake activity is significantly above Ohio state average. It is 47% smaller than the overall U.S. average. On 9/25/1998 at 19:52:52, a magnitude 5.2 (4.8 MB, 4.3 MS, 5.2 LG, 4.5 MW, Depth: 3.1 mi, Class: Moderate, Intensity: VI - VII) earthquake occurred 67.5 miles away from the city center On 1/31/1986 at 16:46:43, a magnitude 5.0 (5.0 MB) earthquake occurred 51.8 miles away from the city center On 8/23/2011 at 17:51:04, a magnitude 5.8 (5.8 MW, Depth: 3.7 mi) earthquake occurred 276.3 miles away from North Canton center On 7/27/1980 at 18:52:21, a magnitude 5.2 (5.1 MB, 4.7 MS, 5.0 UK, 5.2 UK) earthquake occurred 229.1 miles away from North Canton center On 12/31/2011 at 20:05:01, a magnitude 4.0 (4.0 ML, Depth: 3.1 mi, Class: Light, Intensity: IV - V) earthquake occurred 41.1 miles away from North Canton center On 6/10/2019 at 14:50:45, a magnitude 4.0 (4.0 MB, Depth: 1.2 mi) earthquake occurred 55.7 miles away from the city center Magnitude types: regional Lg-wave magnitude (LG), body-wave magnitude (MB), local magnitude (ML), surface-wave magnitude (MS), moment magnitude (MW) Natural disasters: The number of natural disasters in Stark County (10) is smaller than the US average (15).Major Disasters (Presidential) Declared: 6Emergencies Declared: 3Floods: 6, Storms: 5, Tornadoes: 3, Snowstorms: 2, Winds: 2, Blizzard: 1, Hurricane: 1, Mudslide: 1, Winter Storm: 1, Other: 1 (Note: some incidents may be assigned to more than one category). Main business address for: BELDEN & BLAKE CORP /OH/ DRILLING OIL & GAS WELLS ).
Hospitals and medical centers in North Canton: ABSOLUTE SKILLED HOME HEALTH, INC (339 EAST MAPLE STREET)
MERCY MEDICAL CENTER HOMECARE (7568 WHIPPLE AVENUE NW)
NORTHEAST PROFESSIONAL HOME CARE (1177 SOUTH MAIN STREET)
SAINT LUKE LUTHERAN HOME (220 APPLEGROVE STREET NE)
ST LUKE LUTHERAN HM FOR AGED (220 APPLEGROVE ST)
Airports located in North Canton: Amtrak stations near North Canton: 16 miles: AKRON (906 E. BOWERY ST.) Services: enclosed waiting area, public restrooms, public payphones, free short-term parking, free long-term parking, taxi stand.
17 miles: ALLIANCE (MAIN & WEBB STS.) Services: public payphones, free short-term parking, free long-term parking.
Colleges/Universities in North Canton: Stark State College Full-time enrollment: 7,707; Location: 6200 Frank Ave NW; Public; Website: www.starkstate.edu)
Walsh University Full-time enrollment: 2,553; Location: 2020 East Maple St; Private, not-for-profit; Website: www.walsh.edu; Offers Doctor's degree )
Other colleges/universities with over 2000 students near North Canton:
Kent State University at Stark (about 2 miles; Canton, OH ; Full-time enrollment: 3,259)
Malone University (about 4 miles; Canton, OH ; FT enrollment: 2,201)
University of Akron Main Campus (about 16 miles; Akron, OH ; FT enrollment: 22,216)
University of Mount Union (about 16 miles; Alliance, OH ; FT enrollment: 2,302)
Kent State University at Kent (about 20 miles; Kent, OH ; FT enrollment: 25,431)
The College of Wooster (about 29 miles; Wooster, OH ; FT enrollment: 2,112)
Baldwin Wallace University (about 42 miles; Berea, OH ; FT enrollment: 3,699)
Public high school in North Canton:
Public elementary/middle schools in North Canton: NORTH CANTON MIDDLE SCHOOL Students: 1,120, Location: 605 FAIR OAKS AVE SW, Grades: 6-8)NORTHWOOD ELEMENTARY SCHOOL Students: 479, Location: 1500 SCHOOL AVE NE, Grades: KG-2)CLEARMOUNT ELEMENTARY SCHOOL Students: 354, Location: 150 CLEARMOUNT AVE SE, Grades: KG-2)GREENTOWN INTERMEDIATE SCHOOL Location: 3330 STATE ST NW, Grades: 3-5)
ORCHARD HILL INTERMEDIATE SCHOOL Location: 1305 JONATHAN AVE SW, Grades: 3-5)
Private elementary/middle school in North Canton: ST PAUL SCHOOL Students: 421, Location: 303 S MAIN ST, Grades: PK-8)
See full list of schools located in North Canton Library in North Canton: NORTH CANTON PUBLIC LIBRARY Operating income: $1,859,225; Location: 185 N. MAIN ST.; 115,977 books ; 99 e-books ; 16,490 audio materials ; 19,530 video materials ; 5 local licensed databases ; 266 state licensed databases ; 417 print serial subscriptions )
Notable locations in North Canton: (A) , Memorial Stadium (B) , North Canton Fire and Emergency Medical Services Station 1 (C) , North Canton Fire and Emergency Medical Services Station 2 (D) , North Canton Public Library (E) , Hoover Historical Center (F) , North Canton City Hall (G) . Display/hide their locations on the map
Shopping Centers: (1) , North Canton Plaza Shopping Center (2) . Display/hide their locations on the map
Churches in North Canton include: (A) , Faith United Methodist Church (B) , North Canton Church of Christ (C) , Zion Evangelical Lutheran Church (D) , Saint Pauls Roman Catholic Church (E) , Gospel Tabernacle (F) , Zion United Church of Christ (G) . Display/hide their locations on the map
Cemetery: (1) . Display/hide its location on the map
Parks in North Canton include: (1) , Price Park (2) , Hoover Park (3) , Dogwood Park (4) . Display/hide their locations on the map
Tourist attractions:
Hotel:
Birthplace of: Eddie McClintock - Television actor, Dick Snyder - Basketball player, Jeffrey Mylett - Actor.
Stark County has a predicted average indoor radon screening level greater than 4 pCi/L (pico curies per liter) - Highest Potential Drinking water stations with addresses in North Canton and their reported violations in the past:
J AND K SUBWAY INC #2312 (Population served: 146, Groundwater):
Past health violations:
MCL, Monthly (TCR) - In NOV-2013, Contaminant: Coliform. Follow-up actions: St Public Notif received (NOV-25-2013), St Public Notif requested (NOV-26-2013), St Violation/Reminder Notice (NOV-26-2013)
MCL, Monthly (TCR) - Between OCT-2013 and DEC-2013, Contaminant: Coliform. Follow-up actions: St Public Notif requested (NOV-05-2013), St Violation/Reminder Notice (NOV-05-2013), St Public Notif received (NOV-25-2013)
MCL, Monthly (TCR) - Between OCT-2011 and DEC-2011, Contaminant: Coliform. Follow-up actions: St Violation/Reminder Notice (OCT-31-2011), St Public Notif requested (OCT-31-2011)
Population served: 75, Groundwater):
Past monitoring violations:
4 routine major monitoring violations
Address: 5441 GLOBAL GATEWAY Population served: 75, Groundwater):
Past health violations:
MCL, Monthly (TCR) - Between APR-2005 and JUN-2005, Contaminant: Coliform. Follow-up actions: St Public Notif requested (MAY-26-2005), St Violation/Reminder Notice (MAY-26-2005), St Compliance achieved (APR-19-2007)
Drinking water stations with addresses in North Canton that have no violations reported:
WILLOWDALE LAKE COUNTRY CLUB (Address: 610 Willowdale Lake Drive, NW Population served: 50, Primary Water Source Type: Groundwater)
MANCHESTER PLAZA (Population served: 30, Primary Water Source Type: Groundwater)
Average household size: This city:
2.1 peopleOhio:
2.4 people
Percentage of family households: This city:
58.6%Whole state:
65.0%
Percentage of households with unmarried partners: This city:
5.0%Whole state:
6.8%
Likely homosexual households (counted as self-reported same-sex unmarried-partner households)
Lesbian couples: 0.3% of all households Gay men: 0.3% of all households
People in group quarters in North Canton in 2010:
902 people in college/university student housing
306 people in nursing facilities/skilled-nursing facilities
7 people in other noninstitutional facilities
People in group quarters in North Canton in 2000:
435 people in college dormitories (includes college quarters off campus)
384 people in nursing homes
22 people in other group homes
Banks with most branches in North Canton (2011 data):
RBS Citizens, National Association: North Canton, North Canton / Acme Branch, Easton / Middlebranch. Info updated 2007/09/19: Bank assets: $106,940.6 mil, Deposits: $75,690.2 mil, headquarters in Providence, RI, positive income , 1135 total offices , Holding Company: Uk Financial Investments Limited
Firstmerit Bank, National Association: Oakwood Square Branch, North Canton Branch, North Canton Acme Branch. Info updated 2010/05/17: Bank assets: $14,420.6 mil, Deposits: $11,497.6 mil, headquarters in Akron, OH, positive income , Commercial Lending Specialization, 213 total offices , Holding Company: Firstmerit Corporation
The Huntington National Bank: North Canton Branch at 1340 North Main Street, branch established on 1891/01/01; Portage And Frank Branch at 4879 Portage Street Nw, branch established on 1997/05/12. Info updated 2012/04/02: Bank assets: $54,183.4 mil, Deposits: $44,300.3 mil, headquarters in Columbus, OH, positive income , Commercial Lending Specialization, 878 total offices , Holding Company: Huntington Bancshares Incorporated
PNC Bank, National Association: North Canton Branch at 1690 North Main Street, branch established on 1989/06/19; Portage - Whipple Branch at 4140 Portage Street, N.W., branch established on 1980/02/11. Info updated 2012/03/20: Bank assets: $263,309.6 mil, Deposits: $197,343.0 mil, headquarters in Wilmington, DE, positive income , Commercial Lending Specialization, 3085 total offices , Holding Company: Pnc Financial Services Group, Inc., The
Premier Bank & Trust, National Association: Canton Branch at 6141 Whipple Avenue, N.W., branch established on 2000/12/19; at 600 N Main Street, branch established on 2000/10/03. Info updated 2010/09/23: Bank assets: $146.7 mil, Deposits: $104.2 mil, local headquarters , positive income , Commercial Lending Specialization, 5 total offices , Holding Company: Excel Bancorp, Llc
Fifth Third Bank: North Canton Branch at 1637 North Main Street, branch established on 2005/05/31; Jackson Township Banking Center Bran at 5067 Portage Street Nw, branch established on 2004/06/28. Info updated 2009/10/05: Bank assets: $114,540.4 mil, Deposits: $89,689.1 mil, headquarters in Cincinnati, OH, positive income , Commercial Lending Specialization, 1378 total offices , Holding Company: Fifth Third Bancorp
JPMorgan Chase Bank, National Association: North Canton Branch at 219 North Main Street, branch established on 1960/12/01. Info updated 2011/11/10: Bank assets: $1,811,678.0 mil, Deposits: $1,190,738.0 mil, headquarters in Columbus, OH, positive income , International Specialization, 5577 total offices , Holding Company: Jpmorgan Chase & Co.
The Commercial and Savings Bank of Millersburg, Ohio: North Canton Branch at 1210 North Main Street, branch established on 2005/10/03. Info updated 2008/12/03: Bank assets: $551.0 mil, Deposits: $444.1 mil, headquarters in Millersburg, OH, positive income , Commercial Lending Specialization, 14 total offices , Holding Company: Csb Bancorp, Inc.
Wayne Savings Community Bank: Village Savings Bank, F.S.b. Branch at 1265 South Main Street, branch established on 1998/07/08. Info updated 2011/07/21: Bank assets: $410.1 mil, Deposits: $335.6 mil, headquarters in Wooster, OH, positive income , Mortgage Lending Specialization, 11 total offices
For population 15 years and over in North Canton:
Never married: 30.9%Now married: 46.7%Separated: 1.2%Widowed: 10.0%Divorced: 11.2% For population 25 years and over in North Canton:
High school or higher: 97.4%Bachelor's degree or higher: 38.8%Graduate or professional degree: 14.2%Unemployed: 3.1%Mean travel time to work (commute): 16.0 minutes
Education Gini index (Inequality in education) Here:
9.6Ohio average:
11.0
Religion statistics for North Canton, OH (based on Stark County data)
Religion Adherents Congregations Evangelical Protestant 60,957 224 Catholic 55,831 28 Mainline Protestant 45,340 127 Black Protestant 5,327 25 Orthodox 5,014 8 Other 3,929 24 None 199,188 -
Source: Clifford Grammich, Kirk Hadaway, Richard Houseal, Dale E.Jones, Alexei Krindatch, Richie Stanley and Richard H.Taylor. 2012. 2010 U.S.Religion Census: Religious Congregations & Membership Study. Association of Statisticians of American Religious Bodies. Jones, Dale E., et al. 2002. Congregations and Membership in the United States 2000. Nashville, TN: Glenmary Research Center. Graphs represent county-level data
Food Environment Statistics: Number of grocery stores : 71Here :
1.87 / 10,000 pop.Ohio :
1.89 / 10,000 pop.
Number of supercenters and club stores : 5Stark County :
0.13 / 10,000 pop.Ohio :
0.13 / 10,000 pop.
Number of convenience stores (no gas) : 34This county :
0.90 / 10,000 pop.State :
1.25 / 10,000 pop.
Number of convenience stores (with gas) : 102Stark County :
2.69 / 10,000 pop.Ohio :
2.93 / 10,000 pop.
Number of full-service restaurants : 253Stark County :
6.67 / 10,000 pop.Ohio :
6.25 / 10,000 pop.
Adult diabetes rate : Stark County :
10.9%State :
10.3%
Low-income preschool obesity rate : This county :
12.5%State :
11.9%
Health and Nutrition: Healthy diet rate : North Canton:
52.0%Ohio:
50.4%
Average overall health of teeth and gums : Average BMI : North Canton:
28.9Ohio:
28.7
People feeling badly about themselves : North Canton:
20.2%Ohio:
20.6%
People not drinking alcohol at all : This city:
11.5%State:
10.4%
Average hours sleeping at night : Overweight people : This city:
36.0%Ohio:
34.3%
General health condition : North Canton:
57.4%State:
57.0%
Average condition of hearing : More about Health and Nutrition of North Canton, OH Residents
Local government employment and payroll (March 2022)
Function
Full-time employees
Monthly full-time payroll
Average yearly full-time wage
Part-time employees
Monthly part-time payroll
Police Protection - Officers
26 $161,145 $74,375 2 $7,225 Water Supply
18 $87,044 $58,029 0 $0 Firefighters
14 $109,140 $93,549 17 $14,017 Streets and Highways
10 $59,241 $71,089 0 $0 Police - Other
9 $49,009 $65,345 9 $9,253 Other Government Administration
6 $32,723 $65,446 8 $6,386 Sewerage
5 $21,900 $52,560 0 $0 Financial Administration
4 $25,711 $77,133 0 $0 Parks and Recreation
4 $22,884 $68,652 0 $0 Fire - Other
2 $15,639 $93,834 0 $0
Totals for Government
98 $584,435 $71,563 36 $36,881
North Canton government finances - Expenditure in 2018 (per resident):
Construction - Regular Highways: $76,000 ($4.30)
Current Operations - Water Utilities: $3,242,000 ($183.30)
Police Protection: $3,186,000 ($180.13)Sewerage: $2,807,000 ($158.70)Local Fire Protection: $2,186,000 ($123.59)Regular Highways: $1,923,000 ($108.72)Central Staff Services: $1,240,000 ($70.11)Solid Waste Management: $1,128,000 ($63.78)Parks and Recreation: $794,000 ($44.89)Financial Administration: $571,000 ($32.28)General - Other: $292,000 ($16.51)Health - Other: $126,000 ($7.12)General Public Buildings: $120,000 ($6.78)Public Welfare - Other: $120,000 ($6.78)Judicial and Legal Services: $113,000 ($6.39)General - Interest on Debt: $58,000 ($3.28)
Other Capital Outlay - Local Fire Protection: $242,000 ($13.68)
Parks and Recreation: $226,000 ($12.78)Police Protection: $143,000 ($8.09)Regular Highways: $81,000 ($4.58)Water Utilities: $30,000 ($1.70)Sewerage: $21,000 ($1.19)Judicial and Legal Services: $6,000 ($0.34)Financial Administration: $4,000 ($0.23)Central Staff Services: $1,000 ($0.06)Total Salaries and Wages: $6,320,000 ($357.32)
Water Utilities - Interest on Debt: $486,000 ($27.48)
North Canton government finances - Revenue in 2018 (per resident):
Charges - Sewerage: $2,842,000 ($160.68)
Solid Waste Management: $918,000 ($51.90)Parks and Recreation: $299,000 ($16.91)Miscellaneous Commercial Activities: $25,000 ($1.41)Miscellaneous - General Revenue - Other: $1,861,000 ($105.22)
Interest Earnings: $509,000 ($28.78)Donations From Private Sources: $257,000 ($14.53)Rents: $209,000 ($11.82)Fines and Forfeits: $21,000 ($1.19)Revenue - Water Utilities: $6,197,000 ($350.37)
State Intergovernmental - Highways: $550,000 ($31.10)
Housing and Community Development: $344,000 ($19.45)Other: $33,000 ($1.87)General Local Government Support: $18,000 ($1.02)Education: $2,000 ($0.11)Tax - Individual Income: $7,585,000 ($428.85)
Property: $3,322,000 ($187.82)Corporation Net Income: $893,000 ($50.49)Death and Gift: $624,000 ($35.28)Public Utility License: $372,000 ($21.03)Motor Vehicle License: $192,000 ($10.86)Alcoholic Beverage License: $13,000 ($0.74)
North Canton government finances - Debt in 2018 (per resident):
Long Term Debt - Outstanding Unspecified Public Purpose: $18,396,000 ($1040.09)
Beginning Outstanding - Unspecified Public Purpose: $18,396,000 ($1040.09)Beginning Outstanding - Public Debt for Private Purpose: $5,960,000 ($336.97)Outstanding Nonguaranteed - Industrial Revenue: $5,066,000 ($286.43)Retired Nonguaranteed - Public Debt for Private Purpose: $894,000 ($50.55)
North Canton government finances - Cash and Securities in 2018 (per resident):
Other Funds - Cash and Securities: $23,927,000 ($1352.80)
Sinking Funds - Cash and Securities: $9,898,000 ($559.62)
Businesses in North Canton, OH
Name Count Name Count
AT&T 1 Men's Wearhouse 2 Arby's 2 Microtel 1 AutoZone 1 Motel 6 1 Avenue 1 OfficeMax 1 BMW 1 Old Navy 1 Bed Bath & Beyond 1 Panera Bread 1 Best Western 1 Papa John's Pizza 1 Budget Car Rental 1 Penske 1 Burger King 2 PetSmart 1 Chick-Fil-A 1 Pizza Hut 2 Chipotle 1 RadioShack 1 Cracker Barrel 1 Red Roof Inn 1 Dairy Queen 1 Rite Aid 2 Decora Cabinetry 2 Ruby Tuesday 1 Dennys 1 Sam's Club 1 Dunkin Donuts 1 Sears 1 FedEx 9 Sprint Nextel 1 Ford 1 Starbucks 2 GNC 2 Subway 5 GameStop 2 T-Mobile 3 Goodwill 1 Taco Bell 3 Holiday Inn 1 Target 1 IHOP 1 Toyota 1 KFC 1 Toys"R"Us 1 Kmart 1 True Value 1 Kohl's 1 U-Haul 2 Long John Silver's 1 UPS 16 Lowe's 1 Waffle House 1 Marshalls 1 Walgreens 3 MasterBrand Cabinets 2 Walmart 1 McDonald's 4 YMCA 1
Strongest AM radio stations in North Canton:
WHBC (1480 AM; 15 kW; CANTON, OH; Owner: NM LICENSING, LLC)
WRCW (1060 AM; daytime; 5 kW; CANTON, OH)
WINW (1520 AM; daytime; 1 kW; CANTON, OH)
WTAM (1100 AM; 50 kW; CLEVELAND, OH; Owner: JACOR BROADCASTING CORPORATION)
WKNR (850 AM; 50 kW; CLEVELAND, OH; Owner: CARON BROADCASTING, INC.)
WHK (1220 AM; 50 kW; CLEVELAND, OH; Owner: CARON BROADCASTING, INC.)
WCER (900 AM; 0 kW; CANTON, OH; Owner: MELODYNAMIC BROACASTING CORPORATION)
WAKR (1590 AM; 5 kW; AKRON, OH; Owner: RUBBER CITY RADIO GROUP, INC.)
WHLO (640 AM; 5 kW; AKRON, OH; Owner: CLEAR CHANNEL BROADCASTING LICENSES, INC.)
WWVA (1170 AM; 53 kW; WHEELING, WV; Owner: CAPSTAR TX LIMITED PARTNERSHIP)
WTOU (1350 AM; 5 kW; AKRON, OH)
WWMK (1260 AM; 10 kW; CLEVELAND, OH; Owner: ABC, INC.)
WCUE (1150 AM; 5 kW; CUYAHOGA FALLS, OH; Owner: FAMILY STATIONS, INC.)
Strongest FM radio stations in North Canton:
WHBC-FM (94.1 FM; CANTON, OH; Owner: NM LICENSING, LLC)
WKDD (98.1 FM; CANTON, OH; Owner: CITICASTERS LICENSES, L.P.)
WRQK-FM (106.9 FM; CANTON, OH; Owner: CUMULUS LICENSING CORP.)
WONE-FM (97.5 FM; AKRON, OH; Owner: RUBBER CITY RADIO GROUP, INC.)
WKSU-FM (89.7 FM; KENT, OH; Owner: KENT STATE UNIVERSITY)
WQMX (94.9 FM; MEDINA, OH; Owner: RUBBER CITY RADIO GROUP, INC)
WZIP (88.1 FM; AKRON, OH; Owner: THE UNIVERSITY OF AKRON)
WZKL (92.5 FM; ALLIANCE, OH; Owner: D. A. PETERSON, INC.)
WAPS (91.3 FM; AKRON, OH; Owner: BOARD OF EDUCATION, AKRON CITY SCHOOL DISTRICT)
WMXY (98.9 FM; YOUNGSTOWN, OH; Owner: CITICASTERS LICENSES, L.P.)
WNIR (100.1 FM; KENT, OH; Owner: MEDIA-COM, INC.)
WQXK (105.1 FM; SALEM, OH; Owner: CUMULUS LICENSING CORP.)
WAKS (96.5 FM; AKRON, OH; Owner: CAPSTAR TX LIMITED PARTNERSHIP)
WMJI (105.7 FM; CLEVELAND, OH; Owner: CITICASTERS LICENSES, L.P.)
WQAL (104.1 FM; CLEVELAND, OH; Owner: INFINITY RADIO OPERATIONS INC.)
WMVX (106.5 FM; CLEVELAND, OH; Owner: JACOR BROADCASTING CORPORATION)
WNCX (98.5 FM; CLEVELAND, OH; Owner: INFINITY RADIO OF CLEVELAND INC.)
WDOK (102.1 FM; CLEVELAND, OH; Owner: INFINITY RADIO OPERATIONS INC.)
WNPQ (95.9 FM; NEW PHILADELPHIA, OH; Owner: TUSCARAWAS BROADCASTING COMPANY)
WZAK (93.1 FM; CLEVELAND, OH; Owner: RADIO ONE LICENSES, LLC)
TV broadcast stations around North Canton:
WDLI (Channel 17; CANTON, OH; Owner: TRINITY BROADCASTING NETWORK, INC.)
WIVM-LP (Channel 52; CANTON, OH; Owner: LUCINDA DeVAUL-TONGES)
WVPX (Channel 23; AKRON, OH; Owner: PAXSON AKRON LICENSE, INC.)
WEAO (Channel 49; AKRON, OH; Owner: NORTHEASTERN EDUCATIONAL TELEVISION OF OHIO, INC.)
WAKN-LP (Channel 11; AKRON, OH; Owner: AKRON TELEVISION, INC.)
WOAC (Channel 67; CANTON, OH; Owner: WRAY, INC.)
WAOH-LP (Channel 29; AKRON, OH; Owner: MEDIA-COM TELEVISION, INC.)
WKBN-TV (Channel 27; YOUNGSTOWN, OH; Owner: PIEDMONT TELEVISION OF YOUNGSTOWN LICENSE LLC)
WNEO (Channel 45; ALLIANCE, OH; Owner: NORTHEASTERN EDUCATIONAL TELEVISION OF OHIO, INC.)
WKYC-TV (Channel 3; CLEVELAND, OH; Owner: WKYC-TV, INC.)
WOIO (Channel 19; SHAKER HEIGHTS, OH; Owner: RAYCOM NATIONAL, INC.)
WBNX-TV (Channel 55; AKRON, OH; Owner: WINSTON BROADCASTING NETWORK, INC.)
WEWS-TV (Channel 5; CLEVELAND, OH; Owner: SCRIPPS HOWARD BROADCASTING COMPANY)
WQHS-TV (Channel 61; CLEVELAND, OH; Owner: UNIVISION CLEVELAND LLC)
W35AX (Channel 35; CLEVELAND, OH; Owner: MEDIA-COM TELEVISION, INC.)
WUAB (Channel 43; LORAIN, OH; Owner: RAYCOM NATIONAL, INC.)
WFMJ-TV (Channel 21; YOUNGSTOWN, OH; Owner: WFMJ TELEVISION, INC.)
WVIZ (Channel 25; CLEVELAND, OH; Owner: IDEASTREAM)
WJW (Channel 8; CLEVELAND, OH; Owner: WJW LICENSE, INC.)
National Bridge Inventory (NBI) Statistics 8 Number of bridges36ft / 11.2m Total length99,341 Total average daily traffic7,286 Total average daily truck traffic137,885 Total future (year 2033) average daily traffic
Home Mortgage Disclosure Act Aggregated Statistics For Year 2009(Based on 5 partial tracts) A) FHA, FSA/RHS & VA B) Conventional C) Refinancings D) Home Improvement Loans E) Loans on Dwellings For 5+ Families F) Non-occupant Loans on G) Loans On Manufactured Number Average Value Number Average Value Number Average Value Number Average Value Number Average Value Number Average Value Number Average Value
LOANS ORIGINATED 72 $120,008 53 $125,947 220 $135,116 6 $32,832 1 $15,120 10 $76,933 0 $0 APPLICATIONS APPROVED, NOT ACCEPTED 1 $95,040 1 $81,130 19 $125,480 2 $5,720 0 $0 2 $56,740 0 $0 APPLICATIONS DENIED 6 $113,940 7 $135,160 69 $142,715 10 $23,866 0 $0 3 $90,217 1 $1,800 APPLICATIONS WITHDRAWN 4 $102,925 3 $173,467 38 $130,275 2 $29,855 0 $0 1 $74,240 0 $0 FILES CLOSED FOR INCOMPLETENESS 1 $67,520 0 $0 12 $153,467 0 $0 0 $0 0 $0 0 $0
Aggregated Statistics For Year 2008(Based on 5 partial tracts) A) FHA, FSA/RHS & VA B) Conventional C) Refinancings D) Home Improvement Loans E) Loans on Dwellings For 5+ Families F) Non-occupant Loans on G) Loans On Manufactured Number Average Value Number Average Value Number Average Value Number Average Value Number Average Value Number Average Value Number Average Value
LOANS ORIGINATED 54 $125,073 92 $121,307 101 $122,162 16 $11,692 1 $178,380 17 $76,862 2 $22,165 APPLICATIONS APPROVED, NOT ACCEPTED 2 $86,800 5 $109,700 15 $137,279 3 $20,550 0 $0 2 $68,970 0 $0 APPLICATIONS DENIED 4 $146,060 10 $107,410 73 $134,571 17 $44,235 0 $0 6 $79,562 0 $0 APPLICATIONS WITHDRAWN 3 $114,717 6 $142,960 26 $133,383 1 $122,500 1 $181,500 1 $114,960 0 $0 FILES CLOSED FOR INCOMPLETENESS 0 $0 2 $154,180 8 $107,576 0 $0 0 $0 1 $67,990 0 $0
Aggregated Statistics For Year 2007(Based on 5 partial tracts) A) FHA, FSA/RHS & VA B) Conventional C) Refinancings D) Home Improvement Loans E) Loans on Dwellings For 5+ Families F) Non-occupant Loans on G) Loans On Manufactured Number Average Value Number Average Value Number Average Value Number Average Value Number Average Value Number Average Value Number Average Value
LOANS ORIGINATED 18 $131,469 154 $117,489 120 $111,468 22 $39,365 1 $502,850 19 $84,028 1 $5,990 APPLICATIONS APPROVED, NOT ACCEPTED 1 $83,140 10 $116,230 31 $114,246 6 $51,178 0 $0 4 $83,835 0 $0 APPLICATIONS DENIED 4 $129,405 19 $130,029 101 $124,303 24 $37,002 0 $0 9 $92,993 1 $61,660 APPLICATIONS WITHDRAWN 1 $168,910 10 $132,416 38 $130,735 4 $97,495 0 $0 3 $95,987 0 $0 FILES CLOSED FOR INCOMPLETENESS 0 $0 5 $106,516 15 $149,497 1 $185,380 0 $0 3 $112,077 1 $5,990
Aggregated Statistics For Year 2006(Based on 5 partial tracts) A) FHA, FSA/RHS & VA B) Conventional C) Refinancings D) Home Improvement Loans E) Loans on Dwellings For 5+ Families F) Non-occupant Loans on G) Loans On Manufactured Number Average Value Number Average Value Number Average Value Number Average Value Number Average Value Number Average Value Number Average Value
LOANS ORIGINATED 18 $131,361 212 $113,000 208 $102,089 32 $42,573 1 $245,070 21 $86,921 0 $0 APPLICATIONS APPROVED, NOT ACCEPTED 1 $82,060 20 $121,860 42 $96,831 5 $47,708 0 $0 2 $79,545 0 $0 APPLICATIONS DENIED 3 $142,300 23 $127,030 137 $110,026 21 $46,229 0 $0 6 $121,270 1 $58,520 APPLICATIONS WITHDRAWN 1 $180,880 23 $88,857 72 $120,297 7 $67,276 1 $103,300 6 $147,517 0 $0 FILES CLOSED FOR INCOMPLETENESS 0 $0 7 $108,820 21 $133,055 1 $25,550 0 $0 1 $128,890 0 $0
Aggregated Statistics For Year 2005(Based on 5 partial tracts) A) FHA, FSA/RHS & VA B) Conventional C) Refinancings D) Home Improvement Loans E) Loans on Dwellings For 5+ Families F) Non-occupant Loans on G) Loans On Manufactured Number Average Value Number Average Value Number Average Value Number Average Value Number Average Value Number Average Value Number Average Value
LOANS ORIGINATED 21 $124,621 216 $114,408 194 $110,466 22 $45,631 1 $410,320 29 $95,270 0 $0 APPLICATIONS APPROVED, NOT ACCEPTED 0 $0 20 $108,729 37 $118,021 2 $21,675 0 $0 3 $113,367 1 $7,790 APPLICATIONS DENIED 2 $124,150 26 $102,640 149 $126,095 22 $48,860 1 $191,480 5 $73,700 2 $49,865 APPLICATIONS WITHDRAWN 1 $138,930 21 $148,877 98 $141,053 14 $123,909 0 $0 7 $110,696 0 $0 FILES CLOSED FOR INCOMPLETENESS 0 $0 5 $100,166 16 $140,805 1 $176,370 0 $0 1 $49,890 0 $0
Aggregated Statistics For Year 2004(Based on 5 partial tracts) A) FHA, FSA/RHS & VA B) Conventional C) Refinancings D) Home Improvement Loans E) Loans on Dwellings For 5+ Families F) Non-occupant Loans on G) Loans On Manufactured Number Average Value Number Average Value Number Average Value Number Average Value Number Average Value Number Average Value Number Average Value
LOANS ORIGINATED 17 $132,497 209 $118,437 262 $113,538 21 $63,858 2 $578,820 32 $94,766 1 $7,880 APPLICATIONS APPROVED, NOT ACCEPTED 1 $170,000 8 $112,585 48 $108,418 7 $43,104 1 $863,560 2 $83,120 1 $13,180 APPLICATIONS DENIED 1 $111,080 29 $109,328 129 $120,296 23 $48,120 0 $0 6 $94,558 1 $23,780 APPLICATIONS WITHDRAWN 3 $134,447 17 $119,437 92 $127,337 4 $87,180 0 $0 4 $86,122 0 $0 FILES CLOSED FOR INCOMPLETENESS 1 $61,540 6 $96,685 17 $132,180 1 $25,200 0 $0 1 $98,650 0 $0
Aggregated Statistics For Year 2003(Based on 5 partial tracts) A) FHA, FSA/RHS & VA B) Conventional C) Refinancings D) Home Improvement Loans E) Loans on Dwellings For 5+ Families F) Non-occupant Loans on Number Average Value Number Average Value Number Average Value Number Average Value Number Average Value Number Average Value
LOANS ORIGINATED 22 $125,830 209 $118,708 656 $110,415 20 $13,362 1 $225,240 41 $89,786 APPLICATIONS APPROVED, NOT ACCEPTED 1 $76,590 11 $134,701 86 $106,959 7 $23,824 0 $0 4 $97,595 APPLICATIONS DENIED 3 $101,803 17 $107,425 122 $117,137 11 $16,331 0 $0 5 $101,358 APPLICATIONS WITHDRAWN 2 $118,910 15 $139,649 106 $115,976 2 $46,250 0 $0 4 $89,338 FILES CLOSED FOR INCOMPLETENESS 0 $0 7 $113,363 31 $115,064 1 $52,340 0 $0 0 $0
Aggregated Statistics For Year 2002(Based on 5 partial tracts) A) FHA, FSA/RHS & VA B) Conventional C) Refinancings D) Home Improvement Loans E) Loans on Dwellings For 5+ Families F) Non-occupant Loans on Number Average Value Number Average Value Number Average Value Number Average Value Number Average Value Number Average Value
LOANS ORIGINATED 21 $113,006 222 $112,625 487 $106,917 18 $26,089 2 $736,130 36 $95,239 APPLICATIONS APPROVED, NOT ACCEPTED 1 $86,850 14 $126,465 66 $105,915 7 $24,663 0 $0 2 $61,010 APPLICATIONS DENIED 1 $100,030 10 $107,353 117 $107,399 12 $12,743 1 $188,960 5 $53,342 APPLICATIONS WITHDRAWN 1 $141,960 10 $112,352 71 $117,657 3 $21,930 1 $311,040 2 $127,670 FILES CLOSED FOR INCOMPLETENESS 0 $0 5 $94,858 22 $122,764 1 $32,800 0 $0 1 $70,090
Aggregated Statistics For Year 2001(Based on 5 partial tracts) A) FHA, FSA/RHS & VA B) Conventional C) Refinancings D) Home Improvement Loans E) Loans on Dwellings For 5+ Families F) Non-occupant Loans on Number Average Value Number Average Value Number Average Value Number Average Value Number Average Value Number Average Value
LOANS ORIGINATED 32 $107,994 174 $114,451 387 $101,826 28 $21,506 0 $0 36 $88,611 APPLICATIONS APPROVED, NOT ACCEPTED 1 $74,240 12 $105,547 51 $99,945 9 $15,262 1 $191,480 1 $47,100 APPLICATIONS DENIED 1 $99,870 17 $88,519 104 $108,087 16 $17,529 0 $0 1 $97,390 APPLICATIONS WITHDRAWN 1 $122,800 13 $116,014 70 $110,320 6 $28,868 0 $0 1 $255,850 FILES CLOSED FOR INCOMPLETENESS 0 $0 0 $0 18 $121,147 0 $0 0 $0 0 $0
Aggregated Statistics For Year 2000(Based on 5 partial tracts) A) FHA, FSA/RHS & VA B) Conventional C) Refinancings D) Home Improvement Loans E) Loans on Dwellings For 5+ Families F) Non-occupant Loans on Number Average Value Number Average Value Number Average Value Number Average Value Number Average Value Number Average Value
LOANS ORIGINATED 19 $103,275 164 $113,019 103 $88,222 24 $17,240 1 $284,520 19 $93,287 APPLICATIONS APPROVED, NOT ACCEPTED 2 $69,785 19 $105,889 24 $80,498 15 $13,687 0 $0 2 $73,500 APPLICATIONS DENIED 0 $0 20 $96,248 56 $89,200 21 $22,039 0 $0 1 $58,370 APPLICATIONS WITHDRAWN 0 $0 11 $104,168 30 $87,900 1 $139,840 0 $0 1 $142,620 FILES CLOSED FOR INCOMPLETENESS 0 $0 2 $97,195 9 $92,784 0 $0 0 $0 0 $0
Aggregated Statistics For Year 1999(Based on 5 partial tracts) A) FHA, FSA/RHS & VA B) Conventional C) Refinancings D) Home Improvement Loans E) Loans on Dwellings For 5+ Families F) Non-occupant Loans on Number Average Value Number Average Value Number Average Value Number Average Value Number Average Value Number Average Value
LOANS ORIGINATED 21 $95,839 157 $108,514 225 $89,365 31 $9,657 3 $954,763 17 $69,776 APPLICATIONS APPROVED, NOT ACCEPTED 3 $106,377 11 $105,212 39 $78,702 11 $24,144 0 $0 4 $68,308 APPLICATIONS DENIED 2 $102,435 11 $83,576 71 $90,352 21 $10,738 0 $0 4 $110,025 APPLICATIONS WITHDRAWN 2 $95,370 8 $85,072 38 $89,397 5 $67,022 0 $0 1 $48,600 FILES CLOSED FOR INCOMPLETENESS 0 $0 2 $130,735 15 $105,354 1 $30,880 0 $0 0 $0
Detailed HMDA statistics for the following Tracts:
7118.00
, 7119.00 , 7120.00 , 7121.01 , 7122.01
Private Mortgage Insurance Companies Aggregated Statistics For Year 2009(Based on 5 partial tracts) A) Conventional B) Refinancings C) Non-occupant Loans on Number Average Value Number Average Value Number Average Value
LOANS ORIGINATED 8 $133,702 9 $142,937 0 $0 APPLICATIONS APPROVED, NOT ACCEPTED 1 $223,150 3 $171,903 1 $34,740 APPLICATIONS DENIED 1 $30,230 1 $146,330 0 $0 APPLICATIONS WITHDRAWN 0 $0 1 $144,440 0 $0 FILES CLOSED FOR INCOMPLETENESS 0 $0 0 $0 0 $0
Aggregated Statistics For Year 2008(Based on 5 partial tracts) A) Conventional B) Refinancings C) Non-occupant Loans on Number Average Value Number Average Value Number Average Value
LOANS ORIGINATED 37 $137,188 8 $143,512 4 $64,970 APPLICATIONS APPROVED, NOT ACCEPTED 11 $175,585 2 $206,000 0 $0 APPLICATIONS DENIED 3 $118,673 0 $0 2 $72,990 APPLICATIONS WITHDRAWN 1 $96,240 0 $0 0 $0 FILES CLOSED FOR INCOMPLETENESS 1 $77,370 0 $0 0 $0
Aggregated Statistics For Year 2007(Based on 5 partial tracts) A) Conventional B) Refinancings C) Non-occupant Loans on Number Average Value Number Average Value Number Average Value
LOANS ORIGINATED 53 $134,351 11 $157,568 2 $105,530 APPLICATIONS APPROVED, NOT ACCEPTED 4 $151,560 2 $167,160 0 $0 APPLICATIONS DENIED 0 $0 1 $136,470 0 $0 APPLICATIONS WITHDRAWN 0 $0 2 $130,210 0 $0 FILES CLOSED FOR INCOMPLETENESS 0 $0 0 $0 0 $0
Aggregated Statistics For Year 2006(Based on 5 partial tracts) A) Conventional B) Refinancings C) Non-occupant Loans on Number Average Value Number Average Value Number Average Value
LOANS ORIGINATED 45 $128,539 13 $152,075 1 $101,350 APPLICATIONS APPROVED, NOT ACCEPTED 5 $150,910 4 $154,078 0 $0 APPLICATIONS DENIED 1 $76,070 0 $0 0 $0 APPLICATIONS WITHDRAWN 1 $125,140 1 $161,560 0 $0 FILES CLOSED FOR INCOMPLETENESS 1 $73,680 1 $68,030 0 $0
Aggregated Statistics For Year 2005(Based on 5 partial tracts) A) Conventional B) Refinancings C) Non-occupant Loans on Number Average Value Number Average Value Number Average Value
LOANS ORIGINATED 36 $131,978 10 $151,818 6 $107,850 APPLICATIONS APPROVED, NOT ACCEPTED 5 $172,856 3 $120,390 1 $53,920 APPLICATIONS DENIED 0 $0 0 $0 0 $0 APPLICATIONS WITHDRAWN 1 $92,420 2 $160,555 0 $0 FILES CLOSED FOR INCOMPLETENESS 0 $0 0 $0 0 $0
Aggregated Statistics For Year 2004(Based on 5 partial tracts) A) Conventional B) Refinancings C) Non-occupant Loans on Number Average Value Number Average Value Number Average Value
LOANS ORIGINATED 35 $139,262 18 $140,319 5 $94,840 APPLICATIONS APPROVED, NOT ACCEPTED 8 $126,489 7 $129,924 1 $113,850 APPLICATIONS DENIED 1 $275,970 0 $0 0 $0 APPLICATIONS WITHDRAWN 2 $91,110 2 $162,520 1 $67,020 FILES CLOSED FOR INCOMPLETENESS 0 $0 0 $0 0 $0
Aggregated Statistics For Year 2003(Based on 5 partial tracts) A) Conventional B) Refinancings C) Non-occupant Loans on Number Average Value Number Average Value Number Average Value
LOANS ORIGINATED 53 $137,062 52 $133,353 3 $109,930 APPLICATIONS APPROVED, NOT ACCEPTED 8 $162,965 17 $127,112 0 $0 APPLICATIONS DENIED 1 $96,120 0 $0 0 $0 APPLICATIONS WITHDRAWN 2 $113,160 5 $136,388 1 $67,020 FILES CLOSED FOR INCOMPLETENESS 0 $0 2 $97,820 0 $0
Aggregated Statistics For Year 2002(Based on 5 partial tracts) A) Conventional B) Refinancings C) Non-occupant Loans on Number Average Value Number Average Value Number Average Value
LOANS ORIGINATED 41 $124,062 42 $128,396 2 $96,250 APPLICATIONS APPROVED, NOT ACCEPTED 7 $117,490 8 $131,344 0 $0 APPLICATIONS DENIED 0 $0 0 $0 0 $0 APPLICATIONS WITHDRAWN 2 $132,970 5 $127,512 1 $87,530 FILES CLOSED FOR INCOMPLETENESS 1 $87,170 1 $52,910 0 $0
Aggregated Statistics For Year 2001(Based on 5 partial tracts) A) Conventional B) Refinancings C) Non-occupant Loans on Number Average Value Number Average Value Number Average Value
LOANS ORIGINATED 45 $120,459 34 $116,746 2 $95,270 APPLICATIONS APPROVED, NOT ACCEPTED 8 $107,395 11 $118,172 2 $89,195 APPLICATIONS DENIED 1 $89,090 1 $197,750 0 $0 APPLICATIONS WITHDRAWN 0 $0 1 $174,720 0 $0 FILES CLOSED FOR INCOMPLETENESS 0 $0 0 $0 0 $0
Aggregated Statistics For Year 2000(Based on 5 partial tracts) A) Conventional B) Refinancings C) Non-occupant Loans on Number Average Value Number Average Value Number Average Value
LOANS ORIGINATED 55 $108,737 6 $148,492 6 $82,293 APPLICATIONS APPROVED, NOT ACCEPTED 6 $138,040 2 $125,720 0 $0 APPLICATIONS DENIED 1 $71,550 1 $133,140 0 $0 APPLICATIONS WITHDRAWN 0 $0 0 $0 0 $0 FILES CLOSED FOR INCOMPLETENESS 0 $0 0 $0 0 $0
Aggregated Statistics For Year 1999(Based on 5 partial tracts) A) Conventional B) Refinancings C) Non-occupant Loans on Number Average Value Number Average Value Number Average Value
LOANS ORIGINATED 56 $108,721 18 $110,487 2 $78,775 APPLICATIONS APPROVED, NOT ACCEPTED 6 $134,663 2 $90,620 0 $0 APPLICATIONS DENIED 1 $167,340 1 $62,650 0 $0 APPLICATIONS WITHDRAWN 1 $96,810 0 $0 0 $0 FILES CLOSED FOR INCOMPLETENESS 0 $0 0 $0 0 $0
Detailed PMIC statistics for the following Tracts:
7118.00
, 7119.00 , 7120.00 , 7121.01 , 7122.01 Fire-safe hotels and motels in North Canton, Ohio:
Rarleigh Inn, 500 N Main St, North Canton, Ohio 44720 Phone: (330) 499-9900
Four Points By Sheraton, 4375 Metro Cir, North Canton, Ohio 44720 Phone: (877) 867-7666, Fax: (330) 494-7129
Hilton Garden Inn Akron Canton Airport, 5251 Landmark Blvd, North Canton, Ohio 44720 Phone: (330) 966-4907, Fax: (330) 966-5265
Courtyard By Marriott, 4375 Metro Circle NW, North Canton, Ohio 44720 Phone: (330) 494-6494, Fax: (330) 494-7129
Best Western Plus North Canton Inn & Suites, 6889 Sunset Strip Ave NW, North Canton, Ohio 44720 Phone: (330) 497-8799, Fax: (330) 497-8707
Springhill Suites Canton, 5770 Dressler Rd NW, NORTH CANTON, Ohio 44720 Phone: (330) 433-0101, Fax: (330) 495-8509
Hyatt Place Canton, 5421 Whipple Ave NW, North canton, Ohio 44720 Phone: (330) 244-1700, Fax: (330) 244-1800
Embassy Suites by Hilton Akron Canton Airport, 7883 Freedom Ave NW, North canton, Ohio 44720 Phone: (330) 305-0500, Fax: (330) 305-0700
2 other hotels and motels
All 10 fire-safe hotels and motels in North Canton, Ohio North Canton compared to Ohio state average:
Unemployed percentage significantly below state average. Black race population percentage significantly below state average. Hispanic race population percentage below state average. Foreign-born population percentage significantly below state average. Length of stay since moving in above state average. Percentage of population with a bachelor's degree or higher above state average. North Canton on our top lists :
#25 on the list of "Top 101 cities with largest percentage of males in industries: broadcasting, internet publishing, and telecommunications services (population 5,000+)"
#25 on the list of "Top 101 cities with largest percentage of females in industries: broadcasting, internet publishing, and telecommunications services (population 5,000+)"
#25 on the list of "Top 101 cities with largest percentage of males in industries: wholesale electronic markets and agents and brokers (population 5,000+)"
#25 on the list of "Top 101 cities with largest percentage of females in industries: wholesale electronic markets and agents and brokers (population 5,000+)"
#2 on the list of "Top 101 counties with the largest increase in the number of infant deaths per 1000 residents 2000-2006 to 2007-2013 (pop. 50,000+)"
#23 on the list of "Top 101 counties with the lowest percentage of residents relocating from other counties between 2010 and 2011 (pop. 50,000+)"
#25 on the list of "Top 101 counties with the lowest percentage of residents relocating to other counties in 2011 (pop. 50,000+)"
#27 on the list of "Top 101 counties with the lowest percentage of residents relocating to foreign countries in 2011"
#27 on the list of "Top 101 counties with the highest number of infant deaths per 1000 residents 2007-2013 (pop. 50,000+)"
Top Patent Applicants
Mark D. Smith (69)
Michael A. Meffie (18)
Mark A. Douglass (17)
Aaron R. Reynolds (17)
Mark J. Williams (16)
James Meek (14)
Trevor Price (13)
Warren James Busch (13)
Sean Haney (13)
Samuel Patrick Landers (12)
Total of 679 patent applications in 2008-2024.
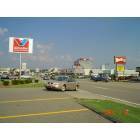
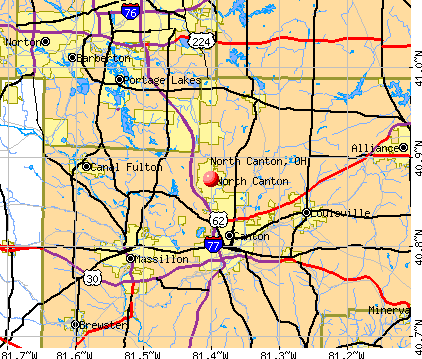


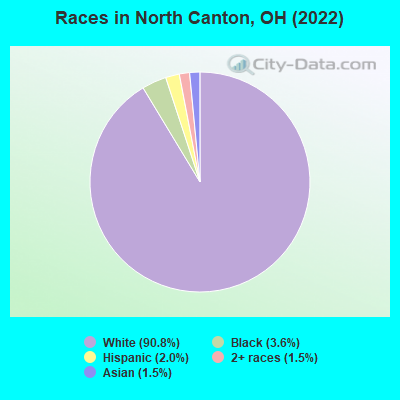
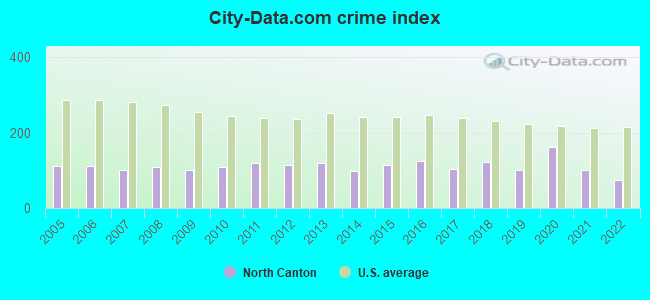
 Recent articles from our blog. Our writers, many of them Ph.D. graduates or candidates, create easy-to-read articles on a wide variety of topics.

 (5.0 miles
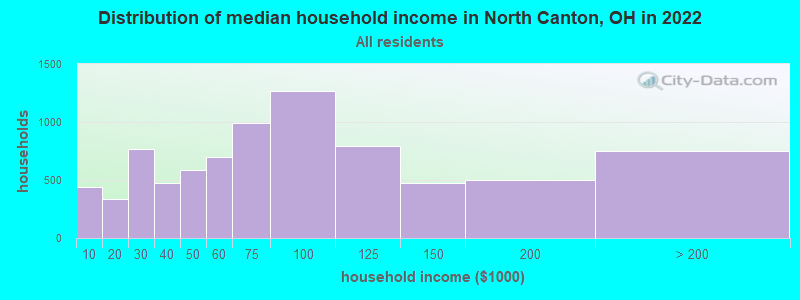
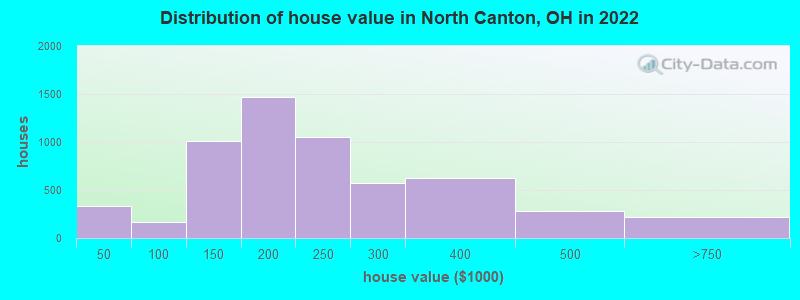

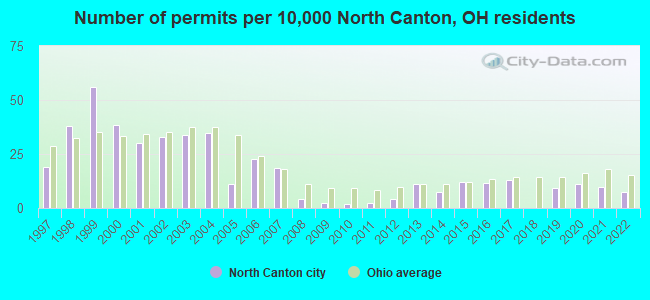
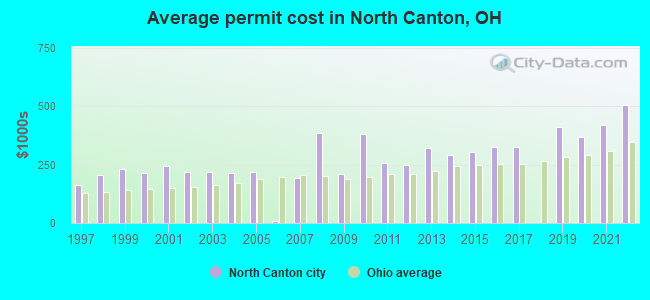
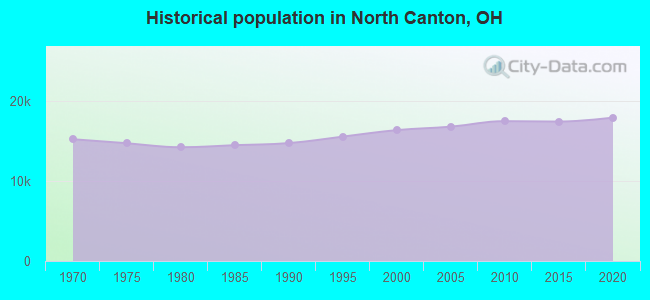
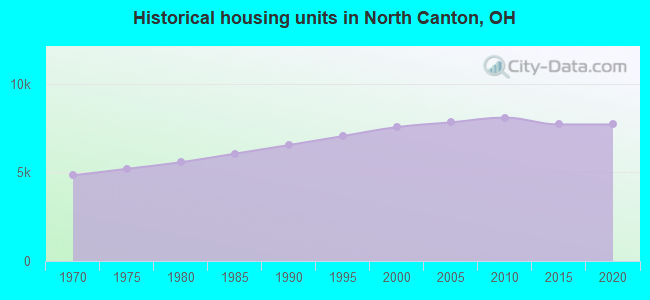
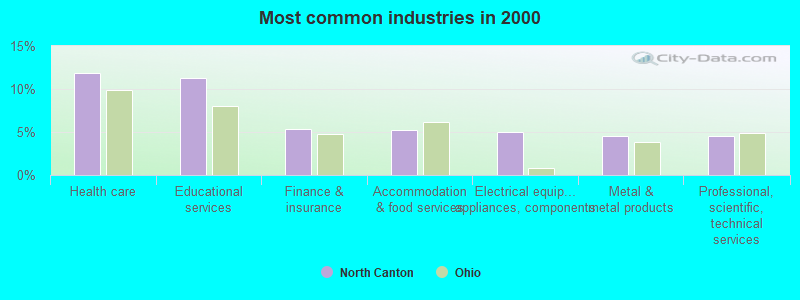
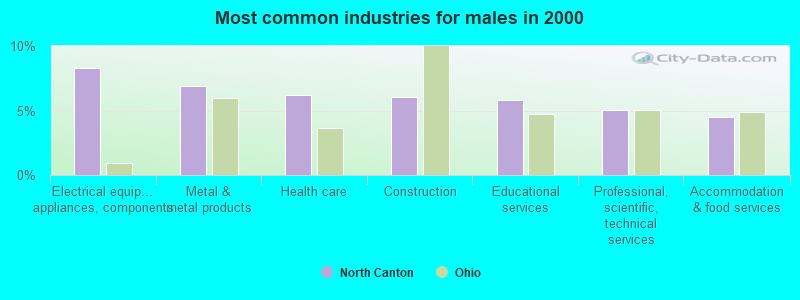
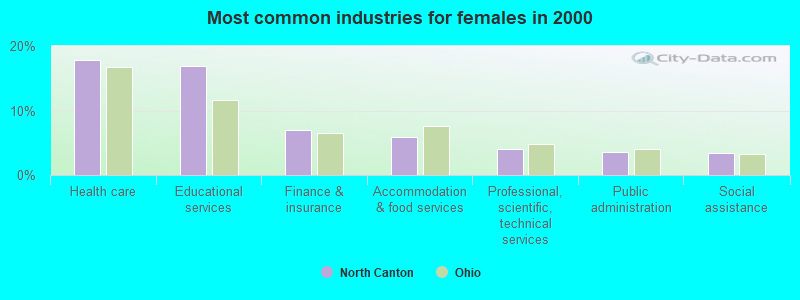
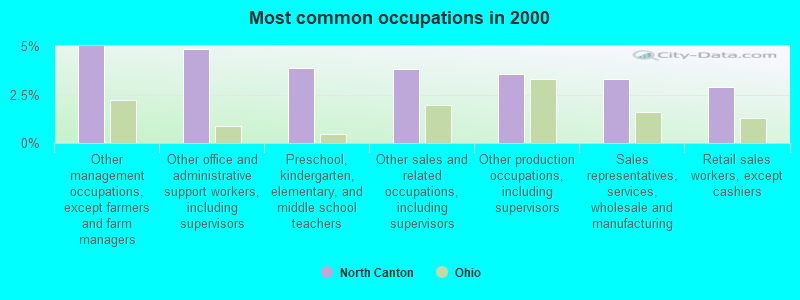
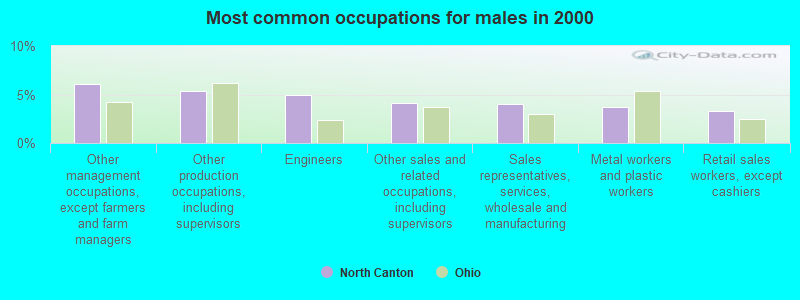
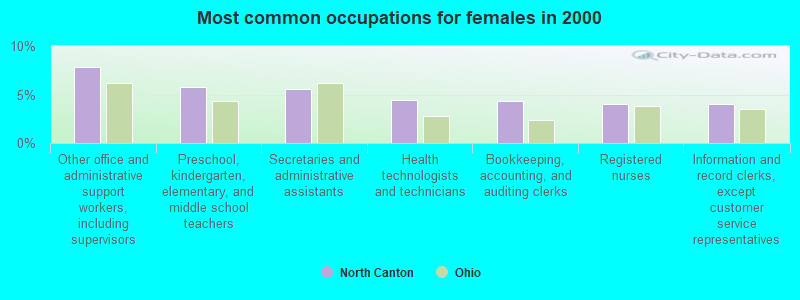


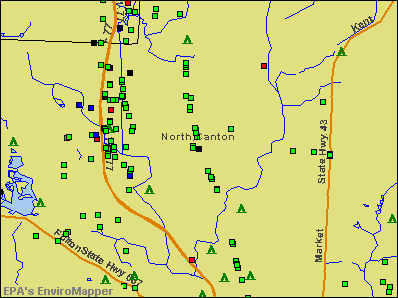

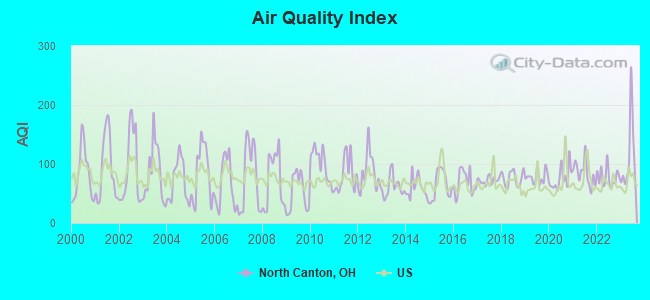
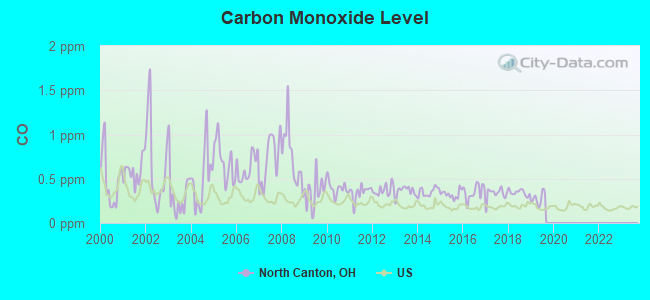
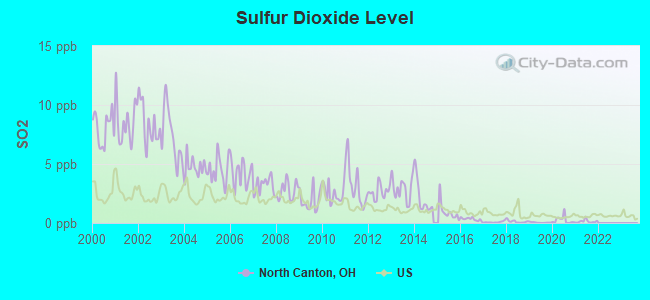
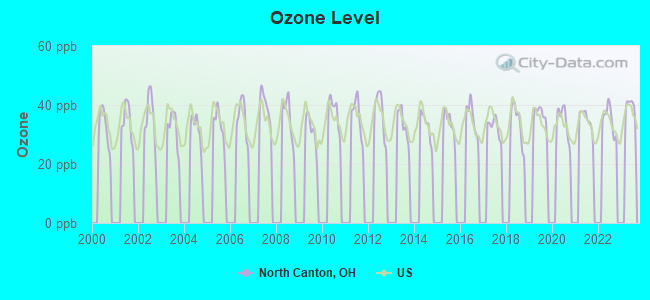
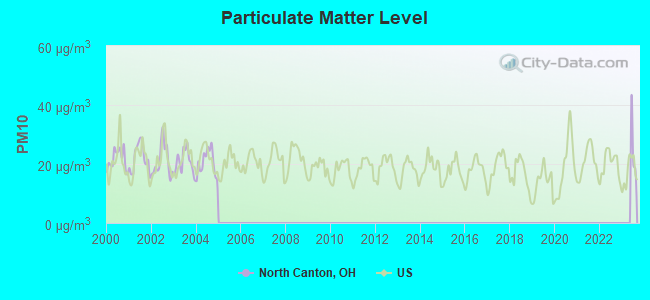
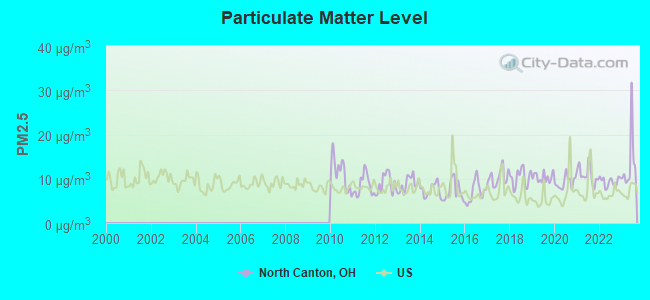

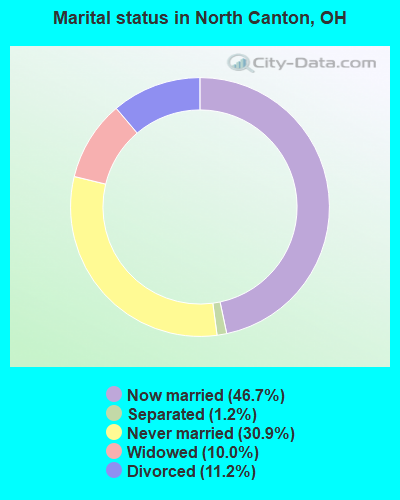
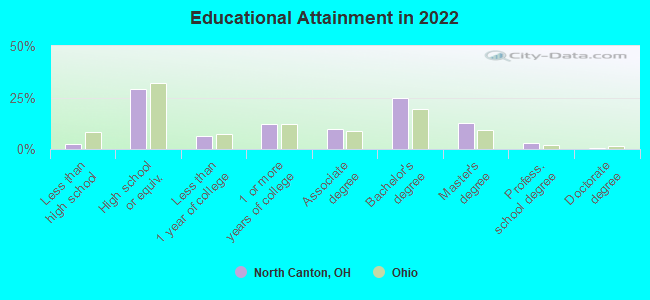
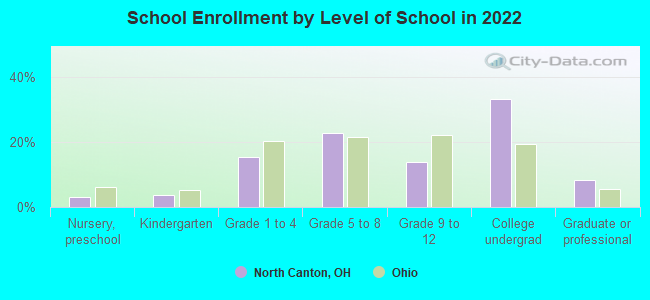
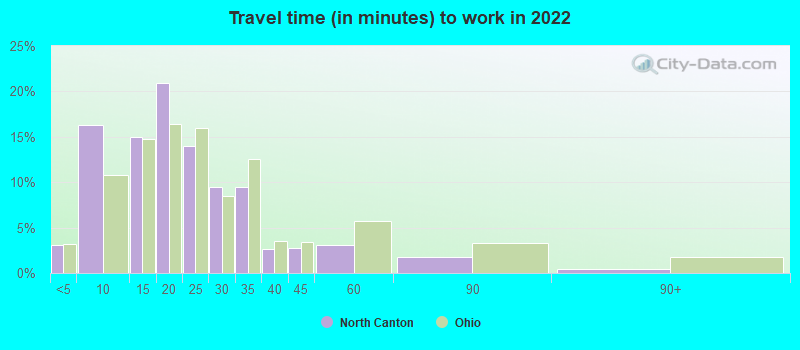
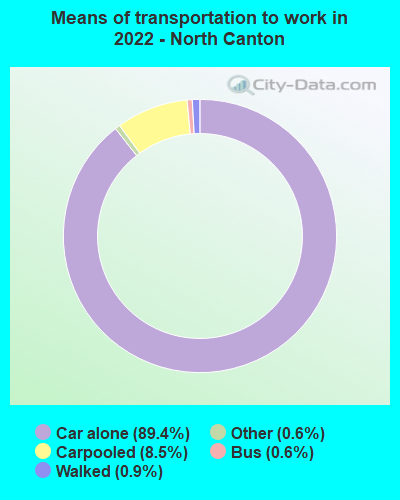
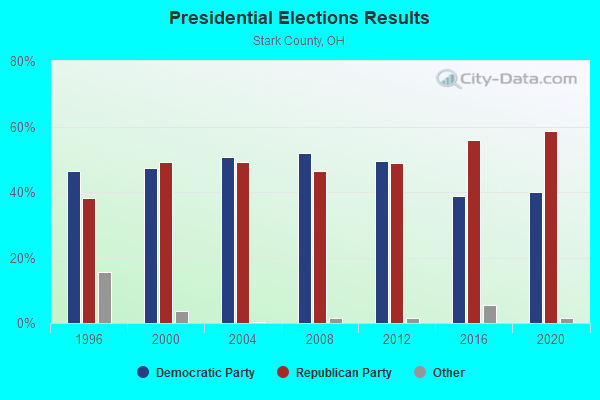
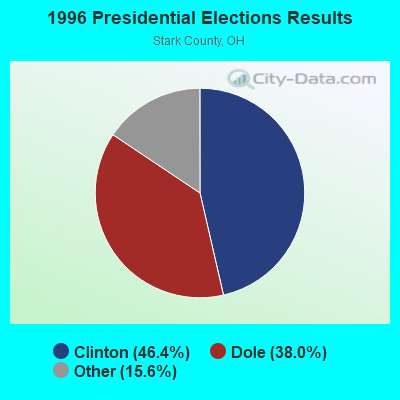
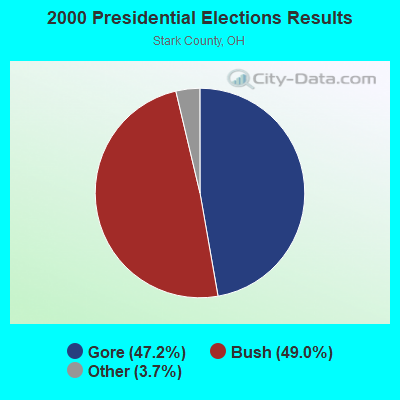
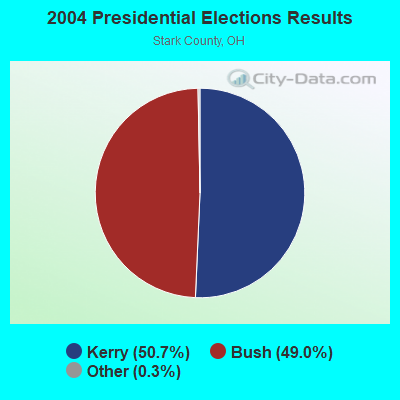
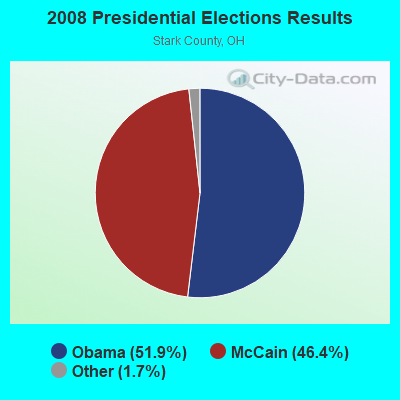
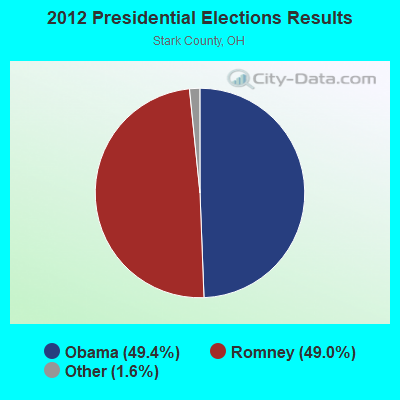
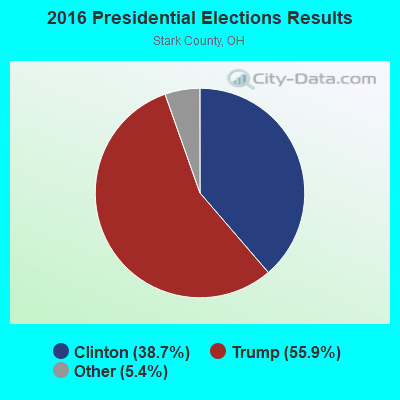
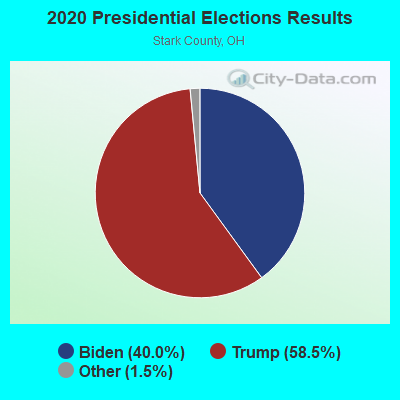
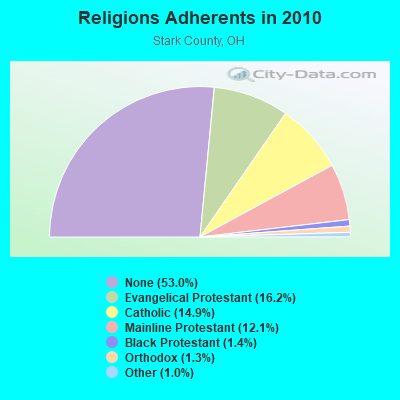
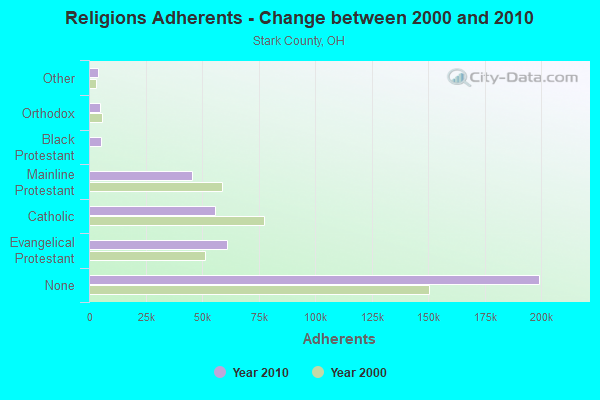
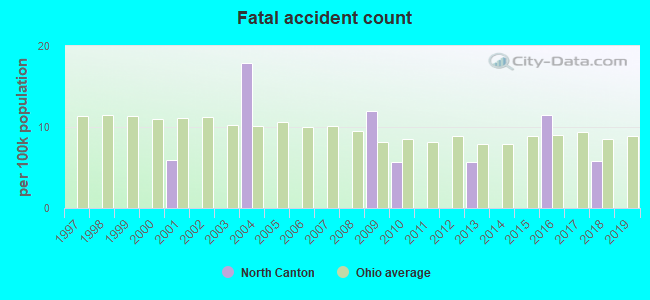
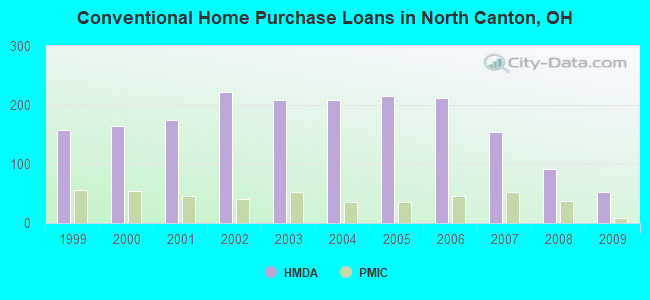
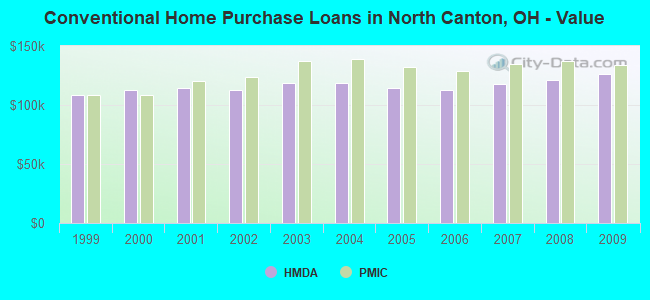
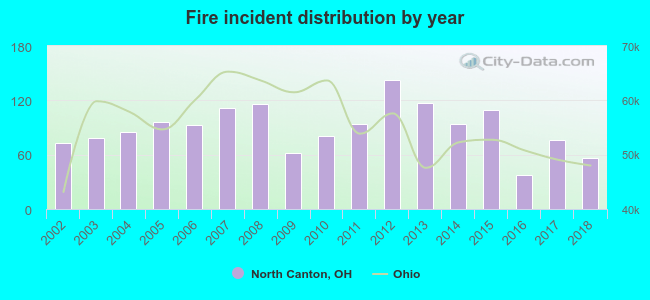 Based on the data from the years 2002 - 2018 the average number of fires per year is 90. The highest number of fires - 143 took place in 2012, and the least - 37 in 2016. The data has a decreasing trend.
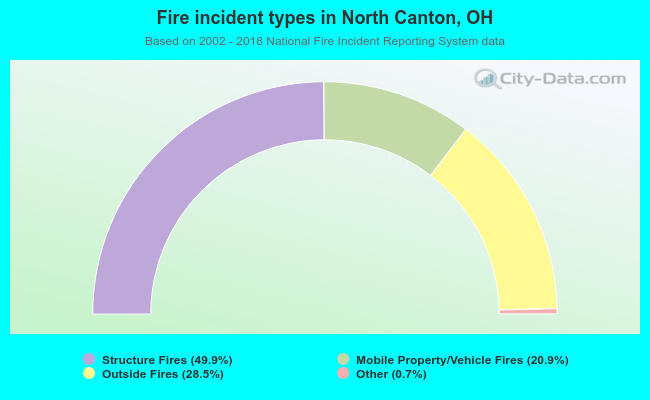 When looking into fire subcategories, the most incidents belonged to: Structure Fires (49.9%), and Outside Fires (28.5%).