Franklin, Wisconsin Submit your own pictures of this city and show them to the world
OSM Map
General Map
Google Map
MSN Map
OSM Map
General Map
Google Map
MSN Map
OSM Map
General Map
Google Map
MSN Map
OSM Map
General Map
Google Map
MSN Map
Please wait while loading the map...
Population in 2022: 36,066 (95% urban, 5% rural). Population change since 2000: +22.3%Males: 17,692 Females: 18,374
March 2022 cost of living index in Franklin: 98.4 (near average, U.S. average is 100) Percentage of residents living in poverty in 2022: 5.6%for White Non-Hispanic residents , 9.5% for Black residents , 7.4% for Hispanic or Latino residents , 0.6% for other race residents , 13.5% for two or more races residents )
Profiles of local businesses
Business Search - 14 Million verified businesses
Data:
Median household income ($)
Median household income (% change since 2000)
Household income diversity
Ratio of average income to average house value (%)
Ratio of average income to average rent
Median household income ($) - White
Median household income ($) - Black or African American
Median household income ($) - Asian
Median household income ($) - Hispanic or Latino
Median household income ($) - American Indian and Alaska Native
Median household income ($) - Multirace
Median household income ($) - Other Race
Median household income for houses/condos with a mortgage ($)
Median household income for apartments without a mortgage ($)
Races - White alone (%)
Races - White alone (% change since 2000)
Races - Black alone (%)
Races - Black alone (% change since 2000)
Races - American Indian alone (%)
Races - American Indian alone (% change since 2000)
Races - Asian alone (%)
Races - Asian alone (% change since 2000)
Races - Hispanic (%)
Races - Hispanic (% change since 2000)
Races - Native Hawaiian and Other Pacific Islander alone (%)
Races - Native Hawaiian and Other Pacific Islander alone (% change since 2000)
Races - Two or more races (%)
Races - Two or more races (% change since 2000)
Races - Other race alone (%)
Races - Other race alone (% change since 2000)
Racial diversity
Unemployment (%)
Unemployment (% change since 2000)
Unemployment (%) - White
Unemployment (%) - Black or African American
Unemployment (%) - Asian
Unemployment (%) - Hispanic or Latino
Unemployment (%) - American Indian and Alaska Native
Unemployment (%) - Multirace
Unemployment (%) - Other Race
Population density (people per square mile)
Population - Males (%)
Population - Females (%)
Population - Males (%) - White
Population - Males (%) - Black or African American
Population - Males (%) - Asian
Population - Males (%) - Hispanic or Latino
Population - Males (%) - American Indian and Alaska Native
Population - Males (%) - Multirace
Population - Males (%) - Other Race
Population - Females (%) - White
Population - Females (%) - Black or African American
Population - Females (%) - Asian
Population - Females (%) - Hispanic or Latino
Population - Females (%) - American Indian and Alaska Native
Population - Females (%) - Multirace
Population - Females (%) - Other Race
Coronavirus confirmed cases (Jun 08, 2024)
Deaths caused by coronavirus (Jun 08, 2024)
Coronavirus confirmed cases (per 100k population) (Jun 08, 2024)
Deaths caused by coronavirus (per 100k population) (Jun 08, 2024)
Daily increase in number of cases (Jun 08, 2024)
Weekly increase in number of cases (Jun 08, 2024)
Cases doubled (in days) (Jun 08, 2024)
Hospitalized patients (Apr 18, 2022)
Negative test results (Apr 18, 2022)
Total test results (Apr 18, 2022)
COVID Vaccine doses distributed (per 100k population) (Sep 19, 2023)
COVID Vaccine doses administered (per 100k population) (Sep 19, 2023)
COVID Vaccine doses distributed (Sep 19, 2023)
COVID Vaccine doses administered (Sep 19, 2023)
Likely homosexual households (%)
Likely homosexual households (% change since 2000)
Likely homosexual households - Lesbian couples (%)
Likely homosexual households - Lesbian couples (% change since 2000)
Likely homosexual households - Gay men (%)
Likely homosexual households - Gay men (% change since 2000)
Cost of living index
Median gross rent ($)
Median contract rent ($)
Median monthly housing costs ($)
Median house or condo value ($)
Median house or condo value ($ change since 2000)
Mean house or condo value by units in structure - 1, detached ($)
Mean house or condo value by units in structure - 1, attached ($)
Mean house or condo value by units in structure - 2 ($)
Mean house or condo value by units in structure by units in structure - 3 or 4 ($)
Mean house or condo value by units in structure - 5 or more ($)
Mean house or condo value by units in structure - Boat, RV, van, etc. ($)
Mean house or condo value by units in structure - Mobile home ($)
Median house or condo value ($) - White
Median house or condo value ($) - Black or African American
Median house or condo value ($) - Asian
Median house or condo value ($) - Hispanic or Latino
Median house or condo value ($) - American Indian and Alaska Native
Median house or condo value ($) - Multirace
Median house or condo value ($) - Other Race
Median resident age
Resident age diversity
Median resident age - Males
Median resident age - Females
Median resident age - White
Median resident age - Black or African American
Median resident age - Asian
Median resident age - Hispanic or Latino
Median resident age - American Indian and Alaska Native
Median resident age - Multirace
Median resident age - Other Race
Median resident age - Males - White
Median resident age - Males - Black or African American
Median resident age - Males - Asian
Median resident age - Males - Hispanic or Latino
Median resident age - Males - American Indian and Alaska Native
Median resident age - Males - Multirace
Median resident age - Males - Other Race
Median resident age - Females - White
Median resident age - Females - Black or African American
Median resident age - Females - Asian
Median resident age - Females - Hispanic or Latino
Median resident age - Females - American Indian and Alaska Native
Median resident age - Females - Multirace
Median resident age - Females - Other Race
Commute - mean travel time to work (minutes)
Travel time to work - Less than 5 minutes (%)
Travel time to work - Less than 5 minutes (% change since 2000)
Travel time to work - 5 to 9 minutes (%)
Travel time to work - 5 to 9 minutes (% change since 2000)
Travel time to work - 10 to 19 minutes (%)
Travel time to work - 10 to 19 minutes (% change since 2000)
Travel time to work - 20 to 29 minutes (%)
Travel time to work - 20 to 29 minutes (% change since 2000)
Travel time to work - 30 to 39 minutes (%)
Travel time to work - 30 to 39 minutes (% change since 2000)
Travel time to work - 40 to 59 minutes (%)
Travel time to work - 40 to 59 minutes (% change since 2000)
Travel time to work - 60 to 89 minutes (%)
Travel time to work - 60 to 89 minutes (% change since 2000)
Travel time to work - 90 or more minutes (%)
Travel time to work - 90 or more minutes (% change since 2000)
Marital status - Never married (%)
Marital status - Now married (%)
Marital status - Separated (%)
Marital status - Widowed (%)
Marital status - Divorced (%)
Median family income ($)
Median family income (% change since 2000)
Median non-family income ($)
Median non-family income (% change since 2000)
Median per capita income ($)
Median per capita income (% change since 2000)
Median family income ($) - White
Median family income ($) - Black or African American
Median family income ($) - Asian
Median family income ($) - Hispanic or Latino
Median family income ($) - American Indian and Alaska Native
Median family income ($) - Multirace
Median family income ($) - Other Race
Median year house/condo built
Median year apartment built
Year house built - Built 2005 or later (%)
Year house built - Built 2000 to 2004 (%)
Year house built - Built 1990 to 1999 (%)
Year house built - Built 1980 to 1989 (%)
Year house built - Built 1970 to 1979 (%)
Year house built - Built 1960 to 1969 (%)
Year house built - Built 1950 to 1959 (%)
Year house built - Built 1940 to 1949 (%)
Year house built - Built 1939 or earlier (%)
Average household size
Household density (households per square mile)
Average household size - White
Average household size - Black or African American
Average household size - Asian
Average household size - Hispanic or Latino
Average household size - American Indian and Alaska Native
Average household size - Multirace
Average household size - Other Race
Occupied housing units (%)
Vacant housing units (%)
Owner occupied housing units (%)
Renter occupied housing units (%)
Vacancy status - For rent (%)
Vacancy status - For sale only (%)
Vacancy status - Rented or sold, not occupied (%)
Vacancy status - For seasonal, recreational, or occasional use (%)
Vacancy status - For migrant workers (%)
Vacancy status - Other vacant (%)
Residents with income below the poverty level (%)
Residents with income below 50% of the poverty level (%)
Children below poverty level (%)
Poor families by family type - Married-couple family (%)
Poor families by family type - Male, no wife present (%)
Poor families by family type - Female, no husband present (%)
Poverty status for native-born residents (%)
Poverty status for foreign-born residents (%)
Poverty among high school graduates not in families (%)
Poverty among people who did not graduate high school not in families (%)
Residents with income below the poverty level (%) - White
Residents with income below the poverty level (%) - Black or African American
Residents with income below the poverty level (%) - Asian
Residents with income below the poverty level (%) - Hispanic or Latino
Residents with income below the poverty level (%) - American Indian and Alaska Native
Residents with income below the poverty level (%) - Multirace
Residents with income below the poverty level (%) - Other Race
Air pollution - Air Quality Index (AQI)
Air pollution - CO
Air pollution - NO2
Air pollution - SO2
Air pollution - Ozone
Air pollution - PM10
Air pollution - PM25
Air pollution - Pb
Crime - Murders per 100,000 population
Crime - Rapes per 100,000 population
Crime - Robberies per 100,000 population
Crime - Assaults per 100,000 population
Crime - Burglaries per 100,000 population
Crime - Thefts per 100,000 population
Crime - Auto thefts per 100,000 population
Crime - Arson per 100,000 population
Crime - City-data.com crime index
Crime - Violent crime index
Crime - Property crime index
Crime - Murders per 100,000 population (5 year average)
Crime - Rapes per 100,000 population (5 year average)
Crime - Robberies per 100,000 population (5 year average)
Crime - Assaults per 100,000 population (5 year average)
Crime - Burglaries per 100,000 population (5 year average)
Crime - Thefts per 100,000 population (5 year average)
Crime - Auto thefts per 100,000 population (5 year average)
Crime - Arson per 100,000 population (5 year average)
Crime - City-data.com crime index (5 year average)
Crime - Violent crime index (5 year average)
Crime - Property crime index (5 year average)
1996 Presidential Elections Results (%) - Democratic Party (Clinton)
1996 Presidential Elections Results (%) - Republican Party (Dole)
1996 Presidential Elections Results (%) - Other
2000 Presidential Elections Results (%) - Democratic Party (Gore)
2000 Presidential Elections Results (%) - Republican Party (Bush)
2000 Presidential Elections Results (%) - Other
2004 Presidential Elections Results (%) - Democratic Party (Kerry)
2004 Presidential Elections Results (%) - Republican Party (Bush)
2004 Presidential Elections Results (%) - Other
2008 Presidential Elections Results (%) - Democratic Party (Obama)
2008 Presidential Elections Results (%) - Republican Party (McCain)
2008 Presidential Elections Results (%) - Other
2012 Presidential Elections Results (%) - Democratic Party (Obama)
2012 Presidential Elections Results (%) - Republican Party (Romney)
2012 Presidential Elections Results (%) - Other
2016 Presidential Elections Results (%) - Democratic Party (Clinton)
2016 Presidential Elections Results (%) - Republican Party (Trump)
2016 Presidential Elections Results (%) - Other
2020 Presidential Elections Results (%) - Democratic Party (Biden)
2020 Presidential Elections Results (%) - Republican Party (Trump)
2020 Presidential Elections Results (%) - Other
Ancestries Reported - Arab (%)
Ancestries Reported - Czech (%)
Ancestries Reported - Danish (%)
Ancestries Reported - Dutch (%)
Ancestries Reported - English (%)
Ancestries Reported - French (%)
Ancestries Reported - French Canadian (%)
Ancestries Reported - German (%)
Ancestries Reported - Greek (%)
Ancestries Reported - Hungarian (%)
Ancestries Reported - Irish (%)
Ancestries Reported - Italian (%)
Ancestries Reported - Lithuanian (%)
Ancestries Reported - Norwegian (%)
Ancestries Reported - Polish (%)
Ancestries Reported - Portuguese (%)
Ancestries Reported - Russian (%)
Ancestries Reported - Scotch-Irish (%)
Ancestries Reported - Scottish (%)
Ancestries Reported - Slovak (%)
Ancestries Reported - Subsaharan African (%)
Ancestries Reported - Swedish (%)
Ancestries Reported - Swiss (%)
Ancestries Reported - Ukrainian (%)
Ancestries Reported - United States (%)
Ancestries Reported - Welsh (%)
Ancestries Reported - West Indian (%)
Ancestries Reported - Other (%)
Educational Attainment - No schooling completed (%)
Educational Attainment - Less than high school (%)
Educational Attainment - High school or equivalent (%)
Educational Attainment - Less than 1 year of college (%)
Educational Attainment - 1 or more years of college (%)
Educational Attainment - Associate degree (%)
Educational Attainment - Bachelor's degree (%)
Educational Attainment - Master's degree (%)
Educational Attainment - Professional school degree (%)
Educational Attainment - Doctorate degree (%)
School Enrollment - Nursery, preschool (%)
School Enrollment - Kindergarten (%)
School Enrollment - Grade 1 to 4 (%)
School Enrollment - Grade 5 to 8 (%)
School Enrollment - Grade 9 to 12 (%)
School Enrollment - College undergrad (%)
School Enrollment - Graduate or professional (%)
School Enrollment - Not enrolled in school (%)
School enrollment - Public schools (%)
School enrollment - Private schools (%)
School enrollment - Not enrolled (%)
Median number of rooms in houses and condos
Median number of rooms in apartments
Housing units lacking complete plumbing facilities (%)
Housing units lacking complete kitchen facilities (%)
Density of houses
Urban houses (%)
Rural houses (%)
Households with people 60 years and over (%)
Households with people 65 years and over (%)
Households with people 75 years and over (%)
Households with one or more nonrelatives (%)
Households with no nonrelatives (%)
Population in households (%)
Family households (%)
Nonfamily households (%)
Population in families (%)
Family households with own children (%)
Median number of bedrooms in owner occupied houses
Mean number of bedrooms in owner occupied houses
Median number of bedrooms in renter occupied houses
Mean number of bedrooms in renter occupied houses
Median number of vehichles in owner occupied houses
Mean number of vehichles in owner occupied houses
Median number of vehichles in renter occupied houses
Mean number of vehichles in renter occupied houses
Mortgage status - with mortgage (%)
Mortgage status - with second mortgage (%)
Mortgage status - with home equity loan (%)
Mortgage status - with both second mortgage and home equity loan (%)
Mortgage status - without a mortgage (%)
Average family size
Average family size - White
Average family size - Black or African American
Average family size - Asian
Average family size - Hispanic or Latino
Average family size - American Indian and Alaska Native
Average family size - Multirace
Average family size - Other Race
Geographical mobility - Same house 1 year ago (%)
Geographical mobility - Moved within same county (%)
Geographical mobility - Moved from different county within same state (%)
Geographical mobility - Moved from different state (%)
Geographical mobility - Moved from abroad (%)
Place of birth - Born in state of residence (%)
Place of birth - Born in other state (%)
Place of birth - Native, outside of US (%)
Place of birth - Foreign born (%)
Housing units in structures - 1, detached (%)
Housing units in structures - 1, attached (%)
Housing units in structures - 2 (%)
Housing units in structures - 3 or 4 (%)
Housing units in structures - 5 to 9 (%)
Housing units in structures - 10 to 19 (%)
Housing units in structures - 20 to 49 (%)
Housing units in structures - 50 or more (%)
Housing units in structures - Mobile home (%)
Housing units in structures - Boat, RV, van, etc. (%)
House/condo owner moved in on average (years ago)
Renter moved in on average (years ago)
Year householder moved into unit - Moved in 1999 to March 2000 (%)
Year householder moved into unit - Moved in 1995 to 1998 (%)
Year householder moved into unit - Moved in 1990 to 1994 (%)
Year householder moved into unit - Moved in 1980 to 1989 (%)
Year householder moved into unit - Moved in 1970 to 1979 (%)
Year householder moved into unit - Moved in 1969 or earlier (%)
Means of transportation to work - Drove car alone (%)
Means of transportation to work - Carpooled (%)
Means of transportation to work - Public transportation (%)
Means of transportation to work - Bus or trolley bus (%)
Means of transportation to work - Streetcar or trolley car (%)
Means of transportation to work - Subway or elevated (%)
Means of transportation to work - Railroad (%)
Means of transportation to work - Ferryboat (%)
Means of transportation to work - Taxicab (%)
Means of transportation to work - Motorcycle (%)
Means of transportation to work - Bicycle (%)
Means of transportation to work - Walked (%)
Means of transportation to work - Other means (%)
Working at home (%)
Industry diversity
Most Common Industries - Agriculture, forestry, fishing and hunting, and mining (%)
Most Common Industries - Agriculture, forestry, fishing and hunting (%)
Most Common Industries - Mining, quarrying, and oil and gas extraction (%)
Most Common Industries - Construction (%)
Most Common Industries - Manufacturing (%)
Most Common Industries - Wholesale trade (%)
Most Common Industries - Retail trade (%)
Most Common Industries - Transportation and warehousing, and utilities (%)
Most Common Industries - Transportation and warehousing (%)
Most Common Industries - Utilities (%)
Most Common Industries - Information (%)
Most Common Industries - Finance and insurance, and real estate and rental and leasing (%)
Most Common Industries - Finance and insurance (%)
Most Common Industries - Real estate and rental and leasing (%)
Most Common Industries - Professional, scientific, and management, and administrative and waste management services (%)
Most Common Industries - Professional, scientific, and technical services (%)
Most Common Industries - Management of companies and enterprises (%)
Most Common Industries - Administrative and support and waste management services (%)
Most Common Industries - Educational services, and health care and social assistance (%)
Most Common Industries - Educational services (%)
Most Common Industries - Health care and social assistance (%)
Most Common Industries - Arts, entertainment, and recreation, and accommodation and food services (%)
Most Common Industries - Arts, entertainment, and recreation (%)
Most Common Industries - Accommodation and food services (%)
Most Common Industries - Other services, except public administration (%)
Most Common Industries - Public administration (%)
Occupation diversity
Most Common Occupations - Management, business, science, and arts occupations (%)
Most Common Occupations - Management, business, and financial occupations (%)
Most Common Occupations - Management occupations (%)
Most Common Occupations - Business and financial operations occupations (%)
Most Common Occupations - Computer, engineering, and science occupations (%)
Most Common Occupations - Computer and mathematical occupations (%)
Most Common Occupations - Architecture and engineering occupations (%)
Most Common Occupations - Life, physical, and social science occupations (%)
Most Common Occupations - Education, legal, community service, arts, and media occupations (%)
Most Common Occupations - Community and social service occupations (%)
Most Common Occupations - Legal occupations (%)
Most Common Occupations - Education, training, and library occupations (%)
Most Common Occupations - Arts, design, entertainment, sports, and media occupations (%)
Most Common Occupations - Healthcare practitioners and technical occupations (%)
Most Common Occupations - Health diagnosing and treating practitioners and other technical occupations (%)
Most Common Occupations - Health technologists and technicians (%)
Most Common Occupations - Service occupations (%)
Most Common Occupations - Healthcare support occupations (%)
Most Common Occupations - Protective service occupations (%)
Most Common Occupations - Fire fighting and prevention, and other protective service workers including supervisors (%)
Most Common Occupations - Law enforcement workers including supervisors (%)
Most Common Occupations - Food preparation and serving related occupations (%)
Most Common Occupations - Building and grounds cleaning and maintenance occupations (%)
Most Common Occupations - Personal care and service occupations (%)
Most Common Occupations - Sales and office occupations (%)
Most Common Occupations - Sales and related occupations (%)
Most Common Occupations - Office and administrative support occupations (%)
Most Common Occupations - Natural resources, construction, and maintenance occupations (%)
Most Common Occupations - Farming, fishing, and forestry occupations (%)
Most Common Occupations - Construction and extraction occupations (%)
Most Common Occupations - Installation, maintenance, and repair occupations (%)
Most Common Occupations - Production, transportation, and material moving occupations (%)
Most Common Occupations - Production occupations (%)
Most Common Occupations - Transportation occupations (%)
Most Common Occupations - Material moving occupations (%)
People in Group quarters - Institutionalized population (%)
People in Group quarters - Correctional institutions (%)
People in Group quarters - Federal prisons and detention centers (%)
People in Group quarters - Halfway houses (%)
People in Group quarters - Local jails and other confinement facilities (including police lockups) (%)
People in Group quarters - Military disciplinary barracks (%)
People in Group quarters - State prisons (%)
People in Group quarters - Other types of correctional institutions (%)
People in Group quarters - Nursing homes (%)
People in Group quarters - Hospitals/wards, hospices, and schools for the handicapped (%)
People in Group quarters - Hospitals/wards and hospices for chronically ill (%)
People in Group quarters - Hospices or homes for chronically ill (%)
People in Group quarters - Military hospitals or wards for chronically ill (%)
People in Group quarters - Other hospitals or wards for chronically ill (%)
People in Group quarters - Hospitals or wards for drug/alcohol abuse (%)
People in Group quarters - Mental (Psychiatric) hospitals or wards (%)
People in Group quarters - Schools, hospitals, or wards for the mentally retarded (%)
People in Group quarters - Schools, hospitals, or wards for the physically handicapped (%)
People in Group quarters - Institutions for the deaf (%)
People in Group quarters - Institutions for the blind (%)
People in Group quarters - Orthopedic wards and institutions for the physically handicapped (%)
People in Group quarters - Wards in general hospitals for patients who have no usual home elsewhere (%)
People in Group quarters - Wards in military hospitals for patients who have no usual home elsewhere (%)
People in Group quarters - Juvenile institutions (%)
People in Group quarters - Long-term care (%)
People in Group quarters - Homes for abused, dependent, and neglected children (%)
People in Group quarters - Residential treatment centers for emotionally disturbed children (%)
People in Group quarters - Training schools for juvenile delinquents (%)
People in Group quarters - Short-term care, detention or diagnostic centers for delinquent children (%)
People in Group quarters - Type of juvenile institution unknown (%)
People in Group quarters - Noninstitutionalized population (%)
People in Group quarters - College dormitories (includes college quarters off campus) (%)
People in Group quarters - Military quarters (%)
People in Group quarters - On base (%)
People in Group quarters - Barracks, unaccompanied personnel housing (UPH), (Enlisted/Officer), ;and similar group living quarters for military personnel (%)
People in Group quarters - Transient quarters for temporary residents (%)
People in Group quarters - Military ships (%)
People in Group quarters - Group homes (%)
People in Group quarters - Homes or halfway houses for drug/alcohol abuse (%)
People in Group quarters - Homes for the mentally ill (%)
People in Group quarters - Homes for the mentally retarded (%)
People in Group quarters - Homes for the physically handicapped (%)
People in Group quarters - Other group homes (%)
People in Group quarters - Religious group quarters (%)
People in Group quarters - Dormitories (%)
People in Group quarters - Agriculture workers' dormitories on farms (%)
People in Group quarters - Job Corps and vocational training facilities (%)
People in Group quarters - Other workers' dormitories (%)
People in Group quarters - Crews of maritime vessels (%)
People in Group quarters - Other nonhousehold living situations (%)
People in Group quarters - Other noninstitutional group quarters (%)
Residents speaking English at home (%)
Residents speaking English at home - Born in the United States (%)
Residents speaking English at home - Native, born elsewhere (%)
Residents speaking English at home - Foreign born (%)
Residents speaking Spanish at home (%)
Residents speaking Spanish at home - Born in the United States (%)
Residents speaking Spanish at home - Native, born elsewhere (%)
Residents speaking Spanish at home - Foreign born (%)
Residents speaking other language at home (%)
Residents speaking other language at home - Born in the United States (%)
Residents speaking other language at home - Native, born elsewhere (%)
Residents speaking other language at home - Foreign born (%)
Class of Workers - Employee of private company (%)
Class of Workers - Self-employed in own incorporated business (%)
Class of Workers - Private not-for-profit wage and salary workers (%)
Class of Workers - Local government workers (%)
Class of Workers - State government workers (%)
Class of Workers - Federal government workers (%)
Class of Workers - Self-employed workers in own not incorporated business and Unpaid family workers (%)
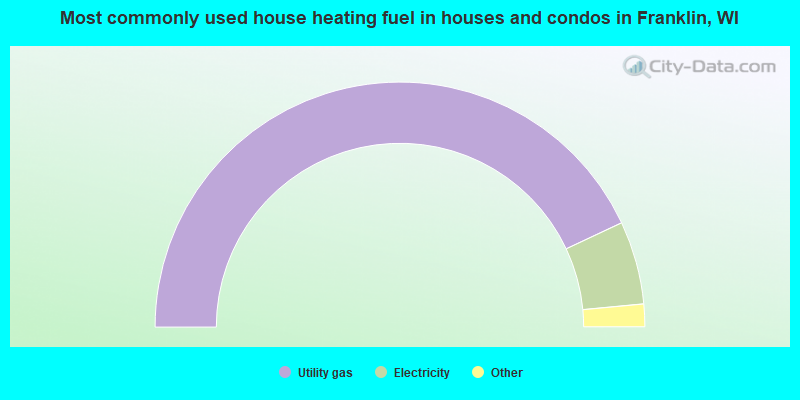
House heating fuel used in houses and condos - Utility gas (%)
House heating fuel used in houses and condos - Bottled, tank, or LP gas (%)
House heating fuel used in houses and condos - Electricity (%)
House heating fuel used in houses and condos - Fuel oil, kerosene, etc. (%)
House heating fuel used in houses and condos - Coal or coke (%)
House heating fuel used in houses and condos - Wood (%)
House heating fuel used in houses and condos - Solar energy (%)
House heating fuel used in houses and condos - Other fuel (%)
House heating fuel used in houses and condos - No fuel used (%)
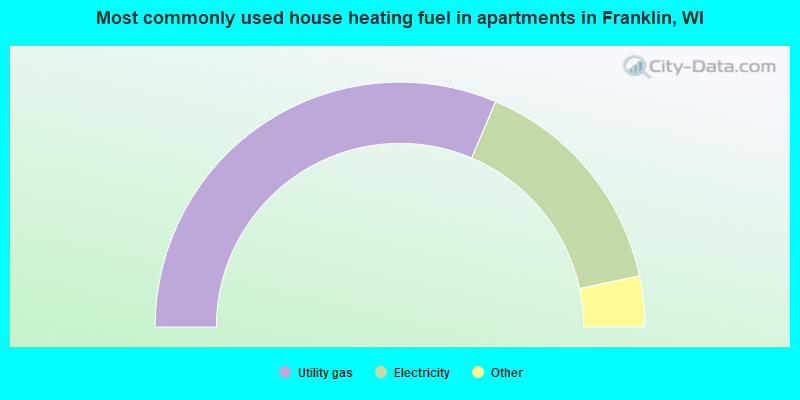
House heating fuel used in apartments - Utility gas (%)
House heating fuel used in apartments - Bottled, tank, or LP gas (%)
House heating fuel used in apartments - Electricity (%)
House heating fuel used in apartments - Fuel oil, kerosene, etc. (%)
House heating fuel used in apartments - Coal or coke (%)
House heating fuel used in apartments - Wood (%)
House heating fuel used in apartments - Solar energy (%)
House heating fuel used in apartments - Other fuel (%)
House heating fuel used in apartments - No fuel used (%)
Armed forces status - In Armed Forces (%)
Armed forces status - Civilian (%)
Armed forces status - Civilian - Veteran (%)
Armed forces status - Civilian - Nonveteran (%)
Fatal accidents locations in years 2005-2021
Fatal accidents locations in 2005
Fatal accidents locations in 2006
Fatal accidents locations in 2007
Fatal accidents locations in 2008
Fatal accidents locations in 2009
Fatal accidents locations in 2010
Fatal accidents locations in 2011
Fatal accidents locations in 2012
Fatal accidents locations in 2013
Fatal accidents locations in 2014
Fatal accidents locations in 2015
Fatal accidents locations in 2016
Fatal accidents locations in 2017
Fatal accidents locations in 2018
Fatal accidents locations in 2019
Fatal accidents locations in 2020
Fatal accidents locations in 2021
Alcohol use - People drinking some alcohol every month (%)
Alcohol use - People not drinking at all (%)
Alcohol use - Average days/month drinking alcohol
Alcohol use - Average drinks/week
Alcohol use - Average days/year people drink much
Audiometry - Average condition of hearing (%)
Audiometry - People that can hear a whisper from across a quiet room (%)
Audiometry - People that can hear normal voice from across a quiet room (%)
Audiometry - Ears ringing, roaring, buzzing (%)
Audiometry - Had a job exposure to loud noise (%)
Audiometry - Had off-work exposure to loud noise (%)
Blood Pressure & Cholesterol - Has high blood pressure (%)
Blood Pressure & Cholesterol - Checking blood pressure at home (%)
Blood Pressure & Cholesterol - Frequently checking blood cholesterol (%)
Blood Pressure & Cholesterol - Has high cholesterol level (%)
Consumer Behavior - Money monthly spent on food at supermarket/grocery store
Consumer Behavior - Money monthly spent on food at other stores
Consumer Behavior - Money monthly spent on eating out
Consumer Behavior - Money monthly spent on carryout/delivered foods
Consumer Behavior - Income spent on food at supermarket/grocery store (%)
Consumer Behavior - Income spent on food at other stores (%)
Consumer Behavior - Income spent on eating out (%)
Consumer Behavior - Income spent on carryout/delivered foods (%)
Current Health Status - General health condition (%)
Current Health Status - Blood donors (%)
Current Health Status - Has blood ever tested for HIV virus (%)
Current Health Status - Left-handed people (%)
Dermatology - People using sunscreen (%)
Diabetes - Diabetics (%)
Diabetes - Had a blood test for high blood sugar (%)
Diabetes - People taking insulin (%)
Diet Behavior & Nutrition - Diet health (%)
Diet Behavior & Nutrition - Milk product consumption (# of products/month)
Diet Behavior & Nutrition - Meals not home prepared (#/week)
Diet Behavior & Nutrition - Meals from fast food or pizza place (#/week)
Diet Behavior & Nutrition - Ready-to-eat foods (#/month)
Diet Behavior & Nutrition - Frozen meals/pizza (#/month)
Drug Use - People that ever used marijuana or hashish (%)
Drug Use - Ever used hard drugs (%)
Drug Use - Ever used any form of cocaine (%)
Drug Use - Ever used heroin (%)
Drug Use - Ever used methamphetamine (%)
Health Insurance - People covered by health insurance (%)
Kidney Conditions-Urology - Avg. # of times urinating at night
Medical Conditions - People with asthma (%)
Medical Conditions - People with anemia (%)
Medical Conditions - People with psoriasis (%)
Medical Conditions - People with overweight (%)
Medical Conditions - Elderly people having difficulties in thinking or remembering (%)
Medical Conditions - People who ever received blood transfusion (%)
Medical Conditions - People having trouble seeing even with glass/contacts (%)
Medical Conditions - People with arthritis (%)
Medical Conditions - People with gout (%)
Medical Conditions - People with congestive heart failure (%)
Medical Conditions - People with coronary heart disease (%)
Medical Conditions - People with angina pectoris (%)
Medical Conditions - People who ever had heart attack (%)
Medical Conditions - People who ever had stroke (%)
Medical Conditions - People with emphysema (%)
Medical Conditions - People with thyroid problem (%)
Medical Conditions - People with chronic bronchitis (%)
Medical Conditions - People with any liver condition (%)
Medical Conditions - People who ever had cancer or malignancy (%)
Mental Health - People who have little interest in doing things (%)
Mental Health - People feeling down, depressed, or hopeless (%)
Mental Health - People who have trouble sleeping or sleeping too much (%)
Mental Health - People feeling tired or having little energy (%)
Mental Health - People with poor appetite or overeating (%)
Mental Health - People feeling bad about themself (%)
Mental Health - People who have trouble concentrating on things (%)
Mental Health - People moving or speaking slowly or too fast (%)
Mental Health - People having thoughts they would be better off dead (%)
Oral Health - Average years since last visit a dentist
Oral Health - People embarrassed because of mouth (%)
Oral Health - People with gum disease (%)
Oral Health - General health of teeth and gums (%)
Oral Health - Average days a week using dental floss/device
Oral Health - Average days a week using mouthwash for dental problem
Oral Health - Average number of teeth
Pesticide Use - Households using pesticides to control insects (%)
Pesticide Use - Households using pesticides to kill weeds (%)
Physical Activity - People doing vigorous-intensity work activities (%)
Physical Activity - People doing moderate-intensity work activities (%)
Physical Activity - People walking or bicycling (%)
Physical Activity - People doing vigorous-intensity recreational activities (%)
Physical Activity - People doing moderate-intensity recreational activities (%)
Physical Activity - Average hours a day doing sedentary activities
Physical Activity - Average hours a day watching TV or videos
Physical Activity - Average hours a day using computer
Physical Functioning - People having limitations keeping them from working (%)
Physical Functioning - People limited in amount of work they can do (%)
Physical Functioning - People that need special equipment to walk (%)
Physical Functioning - People experiencing confusion/memory problems (%)
Physical Functioning - People requiring special healthcare equipment (%)
Prescription Medications - Average number of prescription medicines taking
Preventive Aspirin Use - Adults 40+ taking low-dose aspirin (%)
Reproductive Health - Vaginal deliveries (%)
Reproductive Health - Cesarean deliveries (%)
Reproductive Health - Deliveries resulted in a live birth (%)
Reproductive Health - Pregnancies resulted in a delivery (%)
Reproductive Health - Women breastfeeding newborns (%)
Reproductive Health - Women that had a hysterectomy (%)
Reproductive Health - Women that had both ovaries removed (%)
Reproductive Health - Women that have ever taken birth control pills (%)
Reproductive Health - Women taking birth control pills (%)
Reproductive Health - Women that have ever used Depo-Provera or injectables (%)
Reproductive Health - Women that have ever used female hormones (%)
Sexual Behavior - People 18+ that ever had sex (vaginal, anal, or oral) (%)
Sexual Behavior - Males 18+ that ever had vaginal sex with a woman (%)
Sexual Behavior - Males 18+ that ever performed oral sex on a woman (%)
Sexual Behavior - Males 18+ that ever had anal sex with a woman (%)
Sexual Behavior - Males 18+ that ever had any sex with a man (%)
Sexual Behavior - Females 18+ that ever had vaginal sex with a man (%)
Sexual Behavior - Females 18+ that ever performed oral sex on a man (%)
Sexual Behavior - Females 18+ that ever had anal sex with a man (%)
Sexual Behavior - Females 18+ that ever had any kind of sex with a woman (%)
Sexual Behavior - Average age people first had sex
Sexual Behavior - Average number of female sex partners in lifetime (males 18+)
Sexual Behavior - Average number of female vaginal sex partners in lifetime (males 18+)
Sexual Behavior - Average age people first performed oral sex on a woman (18+)
Sexual Behavior - Average number of woman performed oral sex on in lifetime (18+)
Sexual Behavior - Average number of male sex partners in lifetime (males 18+)
Sexual Behavior - Average number of male anal sex partners in lifetime (males 18+)
Sexual Behavior - Average age people first performed oral sex on a man (18+)
Sexual Behavior - Average number of male oral sex partners in lifetime (18+)
Sexual Behavior - People using protection when performing oral sex (%)
Sexual Behavior - Average number of times people have vaginal or anal sex a year
Sexual Behavior - People having sex without condom (%)
Sexual Behavior - Average number of male sex partners in lifetime (females 18+)
Sexual Behavior - Average number of male vaginal sex partners in lifetime (females 18+)
Sexual Behavior - Average number of female sex partners in lifetime (females 18+)
Sexual Behavior - Circumcised males 18+ (%)
Sleep Disorders - Average hours sleeping at night
Sleep Disorders - People that has trouble sleeping (%)
Smoking-Cigarette Use - People smoking cigarettes (%)
Taste & Smell - People 40+ having problems with smell (%)
Taste & Smell - People 40+ having problems with taste (%)
Taste & Smell - People 40+ that ever had wisdom teeth removed (%)
Taste & Smell - People 40+ that ever had tonsils teeth removed (%)
Taste & Smell - People 40+ that ever had a loss of consciousness because of a head injury (%)
Taste & Smell - People 40+ that ever had a broken nose or other serious injury to face or skull (%)
Taste & Smell - People 40+ that ever had two or more sinus infections (%)
Weight - Average height (inches)
Weight - Average weight (pounds)
Weight - Average BMI
Weight - People that are obese (%)
Weight - People that ever were obese (%)
Weight - People trying to lose weight (%)
According to our research of Wisconsin and other state lists, there were 30 registered sex offenders living in Franklin, Wisconsin as of June 08, 2024 . The ratio of all residents to sex offenders in Franklin is 1,200 to 1.The ratio of registered sex offenders to all residents in this city is much lower than the state average.
Officers per 1,000 residents here:
1.65Wisconsin average:
2.07
Latest news from Franklin, WI collected exclusively by city-data.com from local newspapers, TV, and radio stations
Ancestries: German (25.2%), Polish (13.0%), Italian (3.9%), American (3.3%), Palestinian (2.9%), European (2.8%).
Current Local Time:
Land area: 34.6 square miles.
Population density: 1,042 people per square mile (low).
2,874 residents are foreign born (4.8% Asia , 1.4% Latin America , 1.2% Europe ).
This city:
8.0%Wisconsin:
5.0%
Median real estate property taxes paid for housing units with mortgages in 2022: $6,137 (1.7%)Median real estate property taxes paid for housing units with no mortgage in 2022: $5,836 (1.8%)
Nearest city with pop. 50,000+: West Allis, WI
Nearest city with pop. 200,000+: Milwaukee, WI
Nearest city with pop. 1,000,000+: Chicago, IL
Nearest cities:
Latitude: 42.90 N, Longitude: 88.00 W
Daytime population change due to commuting: -762 (-2.1%)Workers who live and work in this city: 4,503 (25.8%)
Area code commonly used in this area: 262
Franklin tourist attractions:
Single-family new house construction building permits:
2022: 64 buildings , average cost: $452,5002021: 66 buildings , average cost: $457,1002020: 77 buildings , average cost: $415,7002019: 68 buildings , average cost: $408,2002018: 42 buildings , average cost: $318,0002017: 23 buildings , average cost: $388,1002016: 38 buildings , average cost: $350,0002015: 33 buildings , average cost: $375,7002014: 49 buildings , average cost: $295,7002013: 59 buildings , average cost: $295,2002012: 58 buildings , average cost: $246,3002011: 30 buildings , average cost: $256,5002010: 24 buildings , average cost: $228,2002009: 25 buildings , average cost: $242,2002008: 44 buildings , average cost: $242,3002007: 82 buildings , average cost: $237,8002006: 216 buildings , average cost: $225,5002005: 295 buildings , average cost: $247,2002004: 255 buildings , average cost: $217,9002003: 171 buildings , average cost: $203,5002002: 151 buildings , average cost: $181,1002001: 204 buildings , average cost: $183,4002000: 193 buildings , average cost: $167,4001999: 306 buildings , average cost: $145,5001998: 253 buildings , average cost: $145,8001997: 192 buildings , average cost: $140,300Unemployment in December 2023:
Population change in the 1990s: +7,645 (+35.0%).
Most common occupations in Franklin, WI (%)
Both Males Females
Other management occupations, except farmers and farm managers (4.8%)
Other sales and related occupations, including supervisors (4.4%)
Other office and administrative support workers, including supervisors (3.9%)
Secretaries and administrative assistants (3.8%)
Other production occupations, including supervisors (3.5%)
Sales representatives, services, wholesale and manufacturing (3.3%)
Computer specialists (3.3%)
Metal workers and plastic workers (5.2%)
Engineers (5.1%)
Other management occupations, except farmers and farm managers (4.9%)
Other sales and related occupations, including supervisors (4.9%)
Other production occupations, including supervisors (4.8%)
Sales representatives, services, wholesale and manufacturing (4.2%)
Computer specialists (4.1%)
Secretaries and administrative assistants (7.8%)
Other office and administrative support workers, including supervisors (6.6%)
Registered nurses (5.9%)
Other management occupations, except farmers and farm managers (4.7%)
Preschool, kindergarten, elementary, and middle school teachers (4.5%)
Health technologists and technicians (3.9%)
Other sales and related occupations, including supervisors (3.9%)
Tornado activity:
Franklin-area historical tornado activity is near Wisconsin state average. It is 21% greater than the overall U.S. average.
On 4/27/1984, a category F4 (max. wind speeds 207-260 mph) tornado 16.0 miles away from the Franklin city center killed one person and injured 14 people and caused between $500,000 and $5,000,000 in damages.
On 6/5/1977, a category F3 (max. wind speeds 158-206 mph) tornado 5.2 miles away from the city center injured 8 people and caused between $500,000 and $5,000,000 in damages.
Earthquake activity:
Franklin-area historical earthquake activity is significantly above Wisconsin state average. It is 14% greater than the overall U.S. average. On 4/18/2008 at 09:36:59, a magnitude 5.4 (5.1 MB, 4.8 MS, 5.4 MW, 5.2 MW, Class: Moderate, Intensity: VI - VII) earthquake occurred 307.7 miles away from Franklin center On 6/10/1987 at 23:48:54, a magnitude 5.1 (4.9 MB, 4.4 MS, 4.6 MS, 5.1 LG) earthquake occurred 282.1 miles away from Franklin center On 6/28/2004 at 06:10:52, a magnitude 4.2 (4.2 MW, Depth: 6.2 mi, Class: Light, Intensity: IV - V) earthquake occurred 109.7 miles away from the city center On 4/18/2008 at 09:36:59, a magnitude 5.2 (5.2 MW, Depth: 8.9 mi) earthquake occurred 307.7 miles away from Franklin center On 5/2/2015 at 16:23:07, a magnitude 4.2 (4.2 MW, Depth: 2.8 mi) earthquake occurred 138.9 miles away from Franklin center On 2/10/2010 at 09:59:35, a magnitude 3.8 (3.8 MW, Depth: 6.2 mi, Class: Light, Intensity: II - III) earthquake occurred 69.1 miles away from the city center Magnitude types: regional Lg-wave magnitude (LG), body-wave magnitude (MB), surface-wave magnitude (MS), moment magnitude (MW) Natural disasters: The number of natural disasters in Milwaukee County (19) is greater than the US average (15).Major Disasters (Presidential) Declared: 15Emergencies Declared: 4Floods: 12, Storms: 12, Tornadoes: 4, Winter Storms: 3, Snowstorms: 2, Blizzard: 1, Hurricane: 1, Snow: 1, Wind: 1, Other: 1 (Note: some incidents may be assigned to more than one category). Hospitals and medical centers in Franklin: MIDWEST ORTHOPEDIC SPECIALTY HOSPITAL, LLC (Voluntary non-profit - Private, 10101 SOUTH 27TH STREET, 2ND FLOOR) WHEATON FRANCISCAN HEALTHCARE- FRANKLIN, INC (Voluntary non-profit - Private, 10101 SOUTH 27TH STREET) Other hospitals and medical centers near Franklin: MIDWEST DIALYSIS - RYAN RD (Dialysis Facility, about 4 miles away; OAK CREEK, WI)
HALES CORNERS CARE CTR (Nursing Home, about 4 miles away; HALES CORNERS, WI)
GOLDEN LIVINGCENTER-HERITAGE SQUARE (Nursing Home, about 4 miles away; GREENDALE, WI)
VENCOR HOME SERVICES INC (Home Health Center, about 4 miles away; HALES CORNERS, WI)
ATLAS HEALTHCARE INC (Home Health Center, about 4 miles away; HALES CORNERS, WI)
MAPLE RIDGE HEALTH AND REHABILITATION CENTER (Nursing Home, about 4 miles away; MILWAUKEE, WI)
CAMEO CARE CTR (Nursing Home, about 4 miles away; MILWAUKEE, WI)
Amtrak stations near Franklin: 11 miles: MILWAUKEE (433 W. ST. PAUL AVE.) Services: ticket office, fully wheelchair accessible, enclosed waiting area, public restrooms, public payphones, full-service food facilities, paid short-term parking, paid long-term parking, call for car rental service, taxi stand, public transit connection.
15 miles: STURTEVANT (2904 WISCONSIN ST.) Services: enclosed waiting area, public restrooms, public payphones, free short-term parking, free long-term parking, call for taxi service, public transit connection.
College/University in Franklin: Sacred Heart School of Theology Full-time enrollment: 93; Location: 7335 S Hwy 100; Private, not-for-profit; Website: www.shst.edu; Offers Master's degree )
Colleges/universities with over 2000 students nearest to Franklin:
Marquette University (about 11 miles; Milwaukee, WI ; Full-time enrollment: 9,844)
Milwaukee Area Technical College (about 11 miles; Milwaukee, WI ; FT enrollment: 13,156)
Milwaukee School of Engineering (about 12 miles; Milwaukee, WI ; FT enrollment: 2,386)
Carroll University (about 14 miles; Waukesha, WI ; FT enrollment: 3,313)
University of Wisconsin-Milwaukee (about 14 miles; Milwaukee, WI ; FT enrollment: 24,196)
Cardinal Stritch University (about 18 miles; Milwaukee, WI ; FT enrollment: 3,595)
Waukesha County Technical College (about 18 miles; Pewaukee, WI ; FT enrollment: 4,415)
Public high schools in Franklin: FRANKLIN HIGH Students: 1,433, Location: 8222 S 51ST ST, Grades: 9-12)MILWAUKEE COUNTY CORRECTIONAL FACILITY SOUTH Location: 8885 S 68TH ST, Grades: 10-12)
Public elementary/middle schools in Franklin: FOREST PARK MIDDLE Students: 675, Location: 8225 W FOREST HILL AVE, Grades: 7-8)ROBINWOOD ELEMENTARY Students: 527, Location: 10705 W ROBINWOOD LN, Grades: PK-6)PLEASANT VIEW ELEMENTARY Students: 509, Location: 4601 W MARQUETTE AVE, Grades: PK-6)COUNTRY DALE ELEMENTARY Students: 392, Location: 7380 S NORTH CAPE RD, Grades: PK-6)SOUTHWOOD GLEN ELEMENTARY Students: 375, Location: 9090 S 35TH ST, Grades: PK-6)BEN FRANKLIN ELEMENTARY Students: 374, Location: 7620 S 83RD ST, Grades: PK-6)Private elementary/middle schools in Franklin: INDIAN COMMUNITY SCHOOL Students: 288, Location: 10405 W SAINT MARTINS RD, Grades: PK-8)
ST PAUL LUTHERAN SCHOOL Students: 167, Location: 6881 S 51ST ST, Grades: PK-8)
See full list of schools located in Franklin Library in Franklin: FRANKLIN PUBLIC LIBRARY Operating income: $1,319,939; Location: 9151 W. LOOMIS RD.; 99,948 books ; 11,942 e-books ; 12,425 audio materials ; 11,952 video materials ; 16 local licensed databases ; 28 state licensed databases ; 200 print serial subscriptions )
Notable locations in Franklin: (A) , Franklin Industrial Park (B) , Whitnall Park Golf Course (C) , Milwaukee County House of Correction (D) , Oakwood Golf Course (E) , Hales Corners Speedway (F) , Wendt Greenhouse (G) , Franklin Fire Department Station 3 (H) , Franklin Fire Department Station 2 (I) , Franklin Fire Department Station 1 (J) , Wehr Nature Center (K) , Franklin City Hall (L) . Display/hide their locations on the map
Shopping Center: (1) . Display/hide its location on the map
Churches in Franklin include: (A) , Saint Martin of Tours Church (B) , Sacred Heart Monastery (C) . Display/hide their locations on the map
Cemetery: (1) . Display/hide its location on the map
Lakes: (A) , Koepmier Lake (B) . Display/hide their locations on the map
Creek: (A) . Display/hide its location on the map
Parks in Franklin include: (1) , Croatian Park (2) , Legends Park (3) , Saint Martin's Park (4) . Display/hide their locations on the map
Tourist attraction: (1) . Display/hide its approximate location on the map
Hotels: (1) , American Motel (9335 South 27th Street) (2) , Lakic Jovan (9347 South 27th Street) (3) , Embassy Motel (8253 South 27th Street) (4) , Knotty Pine Motel (9063 South 27th Street) (5) , Lakic Mirko OFC (7273 South 27th Street) (6) , Modern 41 Motel (9375 South 27th Street) (7) . Display/hide their approximate locations on the map
Birthplace of: Brian Epps - College basketball player (SMU Mustangs), Scott Mayer (racing driver) - Racing driver, Ted Musgrave - Craftsman Truck series NASCAR driver (born : Dec 18, 1955).
Milwaukee County has a predicted average indoor radon screening level between 2 and 4 pCi/L (pico curies per liter) - Moderate Potential Drinking water stations with addresses in Franklin and their reported violations in the past:
FRANKLIN WATER UTILITY (Population served: 22,500, Purch surface water):
Past monitoring violations:
20 regular monitoring violations
Population served: 100, Groundwater):
Past health violations:
MCL, Monthly (TCR) - In APR-2014, Contaminant: Coliform. Follow-up actions: St Boil Water Order (APR-24-2014), St Violation/Reminder Notice (APR-24-2014), St Public Notif requested (APR-24-2014), St Public Notif received (APR-24-2014), St Public Notif issued (APR-25-2014), St Compliance achieved (MAY-02-2014)
Population served: 65, Groundwater):
Past health violations:
MCL, Monthly (TCR) - In MAR-2014, Contaminant: Coliform. Follow-up actions: St Boil Water Order (MAR-25-2014), St Violation/Reminder Notice (MAR-25-2014), St Public Notif issued (MAR-25-2014), St Public Notif received (MAR-25-2014), St Public Notif requested (MAR-25-2014), St Compliance achieved (APR-03-2014)
MCL, Monthly (TCR) - In JUN-2013, Contaminant: Coliform. Follow-up actions: St Boil Water Order (JUN-15-2013), St Public Notif issued (JUN-17-2013), St Public Notif received (JUN-17-2013), St Public Notif requested (JUN-17-2013), St Violation/Reminder Notice (JUN-17-2013), St Compliance achieved (JUN-24-2013)
MCL, Monthly (TCR) - In APR-2013, Contaminant: Coliform. Follow-up actions: St Public Notif requested (APR-22-2013), St Boil Water Order (APR-22-2013), St Violation/Reminder Notice (APR-22-2013), St Public Notif issued (APR-23-2013), St Public Notif received (APR-24-2013), St Compliance achieved (MAY-10-2013)
Population served: 34, Groundwater):
Past health violations:
MCL, Monthly (TCR) - In MAY-2010, Contaminant: Coliform. Follow-up actions: St Public Notif requested (MAY-27-2010), St Boil Water Order (MAY-27-2010), St Violation/Reminder Notice (MAY-27-2010), St Public Notif issued (MAY-29-2010), St Public Notif received (JUN-03-2010), St Compliance achieved (JUL-01-2010)
Past monitoring violations:
2 regular monitoring violations
Population served: 27, Groundwater):
Past health violations:
MCL, Monthly (TCR) - In JUN-2007, Contaminant: Coliform. Follow-up actions: St Public Notif requested (JUN-07-2007), St Violation/Reminder Notice (JUN-07-2007), St Boil Water Order (JUN-07-2007), St Public Notif issued (JUN-08-2007), St Compliance achieved (JUN-15-2007), St Public Notif received (AUG-01-2007)
Population served: 25, Groundwater):
Past monitoring violations:
Monitoring, Source Water (GWR) - In JUN-2010, Contaminant: E. COLI. Follow-up actions: St Compliance achieved (JUL-21-2010), St Violation/Reminder Notice (JUL-21-2010), St Public Notif requested (JUL-21-2010), St Public Notif received (JUL-23-2010), St Public Notif issued (JUL-23-2010)
Population served: 25, Groundwater):
Past health violations:
MCL, Monthly (TCR) - In SEP-2006, Contaminant: Coliform. Follow-up actions: St Public Notif requested (SEP-27-2006), St Violation/Reminder Notice (SEP-27-2006), St Boil Water Order (SEP-27-2006), St Public Notif received (SEP-28-2006), St Public Notif issued (SEP-28-2006), St Compliance achieved (OCT-16-2006)
Drinking water stations with addresses in Franklin that have no violations reported:
MULLIGANS IRISH PUB & GRILL (Population served: 312, Primary Water Source Type: Groundwater)
ON THE BORDER (Population served: 303, Primary Water Source Type: Groundwater)
WHITNALL PARK OFFICE BUILDING LLC (Population served: 108, Primary Water Source Type: Groundwater)
WASTE MANAGEMENT SOUTHEAST WISCONSIN (Population served: 99, Primary Water Source Type: Groundwater)
PARK MOTEL (Population served: 52, Primary Water Source Type: Groundwater)
ROMEYS PLACE (Population served: 51, Primary Water Source Type: Groundwater)
THE LANDMARK FRANKLIN (Population served: 50, Primary Water Source Type: Groundwater)
SKYWAY MOTEL (Population served: 50, Primary Water Source Type: Groundwater)
MODERN 41 MOTEL (Population served: 32, Primary Water Source Type: Groundwater)
MICHAELANGELOS (Population served: 27, Primary Water Source Type: Groundwater)
Average household size: This city:
2.5 peopleWisconsin:
2.4 people
Percentage of family households: This city:
68.5%Whole state:
64.4%
Percentage of households with unmarried partners: This city:
5.3%Whole state:
7.3%
Likely homosexual households (counted as self-reported same-sex unmarried-partner households)
Lesbian couples: 0.2% of all households Gay men: 0.2% of all households
People in group quarters in Franklin in 2010:
1,800 people in local jails and other municipal confinement facilities
66 people in state prisons
61 people in group homes intended for adults
42 people in nursing facilities/skilled-nursing facilities
9 people in other noninstitutional facilities
4 people in residential treatment centers for adults
People in group quarters in Franklin in 2000:
1,879 people in local jails and other confinement facilities (including police lockups)
87 people in other nonhousehold living situations
34 people in other group homes
34 people in religious group quarters
29 people in other noninstitutional group quarters
28 people in homes for the mentally retarded
8 people in homes for the physically handicapped
4 people in homes or halfway houses for drug/alcohol abuse
Banks with most branches in Franklin (2011 data):
BMO Harris Bank National Association: Brenwood Park Senior Apartments Bran, Franklin Drive Branch, Franklin State Bank - Branch. Info updated 2011/07/14: Bank assets: $97,264.0 mil, Deposits: $75,624.6 mil, headquarters in Chicago, IL, positive income , 717 total offices , Holding Company: Bank Of Montreal
PyraMax Bank, FSB: Frankilin Office at 9000 W Drexel Ave, branch established on 1919/01/01. Info updated 2011/07/21: Bank assets: $456.1 mil, Deposits: $366.9 mil, headquarters in Greenfield, WI, negative income in the last year , Commercial Lending Specialization, 9 total offices
AnchorBank, fsb: Franklin Branch at 7745 West Rawson Avenue, branch established on 2003/12/15. Info updated 2011/07/21: Bank assets: $3,067.4 mil, Deposits: $2,481.9 mil, headquarters in Madison, WI, negative income in the last year , Commercial Lending Specialization, 56 total offices
Bank Mutual: Rawson Ave Branch at 5170 W Rawson Ave, branch established on 2008/08/06. Info updated 2011/07/21: Bank assets: $2,497.0 mil, Deposits: $2,046.0 mil, headquarters in Brown Deer, WI, negative income in the last year , Mortgage Lending Specialization, 79 total offices
JPMorgan Chase Bank, National Association: Franklin Branch at 7100 South 76th Street, branch established on 1990/02/14. Info updated 2011/11/10: Bank assets: $1,811,678.0 mil, Deposits: $1,190,738.0 mil, headquarters in Columbus, OH, positive income , International Specialization, 5577 total offices , Holding Company: Jpmorgan Chase & Co.
Johnson Bank: Franklin Office 81000 Branch at 3001 W. Rawson Avenue, branch established on 2005/08/24. Info updated 2006/07/05: Bank assets: $4,144.5 mil, Deposits: $3,567.4 mil, headquarters in Racine, WI, negative income in the last year , Commercial Lending Specialization, 55 total offices , Holding Company: Johnson Financial Group, Inc.
Guaranty Bank: Franklin Pick 'n Save Branch at 7201 South 76th Street, branch established on 1996/02/07. Info updated 2011/07/21: Bank assets: $1,179.1 mil, Deposits: $1,102.7 mil, headquarters in Milwaukee, WI, negative income in the last year , Mortgage Lending Specialization, 166 total offices
Layton State Bank: Clare Meadows Branch at 7700 S 51st Street, branch established on 1998/02/11. Info updated 2006/11/03: Bank assets: $135.9 mil, Deposits: $119.2 mil, headquarters in Milwaukee, WI, positive income , Commercial Lending Specialization, 7 total offices , Holding Company: Layton Park Financial Group, Inc.
U.S. Bank National Association: Franklin Branch at 9109 West Drexel Avenue, branch established on 1968/03/29. Info updated 2012/01/30: Bank assets: $330,470.8 mil, Deposits: $236,091.5 mil, headquarters in Cincinnati, OH, positive income , 3121 total offices , Holding Company: U.S. Bancorp
4 other banks with 4 local branches
For population 15 years and over in Franklin:
Never married: 25.4%Now married: 59.7%Separated: 0.8%Widowed: 5.8%Divorced: 8.2% For population 25 years and over in Franklin:
High school or higher: 94.2%Bachelor's degree or higher: 43.3%Graduate or professional degree: 14.3%Unemployed: 2.7%Mean travel time to work (commute): 20.7 minutes
Education Gini index (Inequality in education) Here:
9.7Wisconsin average:
10.4
Religion statistics for Franklin, WI (based on Milwaukee County data)
Religion Adherents Congregations Catholic 199,153 83 Evangelical Protestant 116,298 346 Mainline Protestant 51,652 148 Black Protestant 38,583 96 Other 24,760 62 Orthodox 9,080 9 None 508,209 -
Source: Clifford Grammich, Kirk Hadaway, Richard Houseal, Dale E.Jones, Alexei Krindatch, Richie Stanley and Richard H.Taylor. 2012. 2010 U.S.Religion Census: Religious Congregations & Membership Study. Association of Statisticians of American Religious Bodies. Jones, Dale E., et al. 2002. Congregations and Membership in the United States 2000. Nashville, TN: Glenmary Research Center. Graphs represent county-level data
Food Environment Statistics: Number of grocery stores : 203This county :
2.13 / 10,000 pop.Wisconsin :
1.86 / 10,000 pop.
Number of supercenters and club stores : 3Milwaukee County :
0.03 / 10,000 pop.Wisconsin :
0.11 / 10,000 pop.
Number of convenience stores (no gas) : 67Here :
0.70 / 10,000 pop.State :
0.38 / 10,000 pop.
Number of convenience stores (with gas) : 262Here :
2.75 / 10,000 pop.Wisconsin :
4.12 / 10,000 pop.
Number of full-service restaurants : 605Here :
6.36 / 10,000 pop.Wisconsin :
8.64 / 10,000 pop.
Adult diabetes rate : This county :
8.7%Wisconsin :
7.6%
Adult obesity rate : Milwaukee County :
29.6%Wisconsin :
27.5%
Low-income preschool obesity rate : Milwaukee County :
13.7%Wisconsin :
13.0%
Health and Nutrition: Healthy diet rate : This city:
53.1%State:
49.5%
Average overall health of teeth and gums : Franklin:
52.3%Wisconsin:
46.6%
Average BMI : Franklin:
28.4Wisconsin:
28.7
People feeling badly about themselves : Franklin:
20.5%State:
21.4%
People not drinking alcohol at all : Average hours sleeping at night : Franklin:
6.9Wisconsin:
6.8
Overweight people : This city:
34.0%Wisconsin:
34.0%
General health condition : Franklin:
60.5%Wisconsin:
56.3%
Average condition of hearing : Franklin:
80.8%Wisconsin:
78.5%
More about Health and Nutrition of Franklin, WI Residents
Local government employment and payroll (March 2022)
Function
Full-time employees
Monthly full-time payroll
Average yearly full-time wage
Part-time employees
Monthly part-time payroll
Police Protection - Officers
63 $471,946 $89,894 0 $0 Firefighters
46 $374,409 $97,672 0 $0 Streets and Highways
29 $181,551 $75,125 1 $64 Other and Unallocable
23 $122,334 $63,826 4 $7,795 Other Government Administration
10 $66,125 $79,350 9 $11,882 Local Libraries
8 $47,579 $71,369 20 $23,679 Sewerage
6 $16,498 $32,996 0 $0 Water Supply
6 $16,497 $32,994 0 $0 Health
6 $33,507 $67,014 4 $9,736 Financial Administration
4 $25,615 $76,845 6 $10,514 Fire - Other
2 $10,299 $61,794 0 $0 Judicial and Legal
2 $10,390 $62,340 2 $3,837 Police - Other
1 $5,195 $62,340 1 $2,801
Totals for Government
206 $1,381,944 $80,502 47 $70,309
Franklin government finances - Expenditure in 2021 (per resident):
Construction - Sewerage: $7,452,000 ($206.62)
Regular Highways: $6,483,000 ($179.75)Police Protection: $1,334,000 ($36.99)General - Other: $417,000 ($11.56)Local Fire Protection: $288,000 ($7.99)Parks and Recreation: $262,000 ($7.26)Health - Other: $231,000 ($6.40)General Public Buildings: $137,000 ($3.80)Libraries: $134,000 ($3.72)Parking Facilities: $27,000 ($0.75)Current Operations - Police Protection: $8,827,000 ($244.75)
General - Other: $6,684,000 ($185.33)Water Utilities: $6,642,000 ($184.16)Sewerage: $6,264,000 ($173.68)Local Fire Protection: $5,434,000 ($150.67)Regular Highways: $4,484,000 ($124.33)Health - Other: $2,791,000 ($77.39)Solid Waste Management: $2,013,000 ($55.81)Central Staff Services: $1,406,000 ($38.98)Libraries: $1,359,000 ($37.68)Protective Inspection and Regulation - Other: $871,000 ($24.15)Financial Administration: $826,000 ($22.90)Judicial and Legal Services: $538,000 ($14.92)Natural Resources - Other: $459,000 ($12.73)Parks and Recreation: $350,000 ($9.70)General Public Buildings: $164,000 ($4.55)General - Interest on Debt: $1,925,000 ($53.37)
Other Capital Outlay - Solid Waste Management: $2,747,000 ($76.17)
Regular Highways: $656,000 ($18.19)Health - Other: $6,000 ($0.17)Housing and Community Development: $1,000 ($0.03)
Franklin government finances - Revenue in 2021 (per resident):
Charges - Solid Waste Management: $4,274,000 ($118.50)
Sewerage: $3,972,000 ($110.13)Other: $1,298,000 ($35.99)Housing and Community Development: $479,000 ($13.28)Regular Highways: $79,000 ($2.19)Parks and Recreation: $11,000 ($0.30)Natural Resources - Other: $4,000 ($0.11)Federal Intergovernmental - Other: $1,138,000 ($31.55)
Local Intergovernmental - Other: $658,000 ($18.24)
Health and Hospitals: $120,000 ($3.33)Miscellaneous - General Revenue - Other: $1,584,000 ($43.92)
Interest Earnings: $764,000 ($21.18)Fines and Forfeits: $390,000 ($10.81)Special Assessments: $200,000 ($5.55)Donations From Private Sources: $115,000 ($3.19)Sale of Property: $92,000 ($2.55)Rents: $85,000 ($2.36)Revenue - Water Utilities: $5,666,000 ($157.10)
State Intergovernmental - General Local Government Support: $2,333,000 ($64.69)
Highways: $1,413,000 ($39.18)Education: $631,000 ($17.50)Other: $254,000 ($7.04)Health and Hospitals: $157,000 ($4.35)Tax - Property: $24,372,000 ($675.76)
Other License: $2,200,000 ($61.00)Occupation and Business License - Other: $610,000 ($16.91)Other Selective Sales: $207,000 ($5.74)
Franklin government finances - Debt in 2021 (per resident):
Long Term Debt - Outstanding Unspecified Public Purpose: $84,800,000 ($2351.24)
Beginning Outstanding - Unspecified Public Purpose: $78,610,000 ($2179.62)Issue, Unspecified Public Purpose: $25,180,000 ($698.16)Retired Unspecified Public Purpose: $18,990,000 ($526.53)
4.52% of this county's 2021 resident taxpayers lived in other counties in 2020 ($59,601 average adjusted gross income )
Here:
4.52%Wisconsin average:
6.07%
0.01% of residents moved from foreign countries ($97 average AGI )Milwaukee County:
0.01%Wisconsin average:
0.00%
Top counties from which taxpayers relocated into this county between 2020 and 2021:
6.14% of this county's 2020 resident taxpayers moved to other counties in 2021 ($69,652 average adjusted gross income )
Here:
6.14%Wisconsin average:
6.10%
0.01% of residents moved to foreign countries ($47 average AGI )Milwaukee County:
0.01%Wisconsin average:
0.00%
Top counties to which taxpayers relocated from this county between 2020 and 2021:
Businesses in Franklin, WI
Name Count Name Count
Ashley Furniture 1 OfficeMax 1 CVS 1 Penske 1 Curves 1 Pizza Hut 1 Domino's Pizza 1 RadioShack 1 FedEx 4 Sam's Club 1 Ford 1 Starbucks 2 GNC 2 T-Mobile 3 Goodwill 1 Taco Bell 1 Holiday Inn 1 Target 1 Home Depot 1 True Value 1 Jimmy John's 1 U.S. Cellular 1 KFC 1 UPS 4 Lowe's 1 Verizon Wireless 1 MasterBrand Cabinets 1 Volkswagen 1 McDonald's 1 Walmart 1 Menards 1 Wendy's 1 New Balance 1
Strongest AM radio stations in Franklin:
WMCS (1290 AM; 5 kW; GREENFIELD, WI; Owner: MILWAUKEE RADIO ALLIANCE, LLC)
WTMJ (620 AM; 50 kW; MILWAUKEE, WI; Owner: JOURNAL BROADCAST CORPORATION)
WISN (1130 AM; 50 kW; MILWAUKEE, WI; Owner: CAPSTAR TX LIMITED PARTNERSHIP)
WEMP (1250 AM; 5 kW; MILWAUKEE, WI; Owner: ENTERCOM MILWAUKEE LICENSE, LLC)
WOKY (920 AM; 5 kW; MILWAUKEE, WI; Owner: CLEAR CHANNEL BROADCASTING LICENSES, INC.)
WAUK (1510 AM; daytime; 10 kW; WAUKESHA, WI; Owner: WALT-WEST WISCONSIN, INC.)
WKSH (1640 AM; 10 kW; SUSSEX, WI; Owner: ABC, INC.)
WGN (720 AM; 50 kW; CHICAGO, IL; Owner: WGN CONTINENTAL BROADCASTING CO.)
WSCR (670 AM; 50 kW; CHICAGO, IL; Owner: INFINITY BROADCASTING OPERATIONS, INC.)
WBBM (780 AM; 50 kW; CHICAGO, IL; Owner: INFINITY BROADCASTING OPERATIONS, INC.)
WMVP (1000 AM; 50 kW; CHICAGO, IL; Owner: ABC, INC.)
WJYI (1340 AM; 1 kW; MILWAUKEE, WI; Owner: LAKEFRONT COMMUNICATIONS, LLC)
WLS (890 AM; 50 kW; CHICAGO, IL; Owner: WLS, INC.)
Strongest FM radio stations in Franklin:
WMYX-FM (99.1 FM; MILWAUKEE, WI; Owner: ENTERCOM MILWAUKEE LICENSE, LLC)
WVCY-FM (107.7 FM; MILWAUKEE, WI; Owner: VCY AMERICA, INC.)
WKKV-FM (100.7 FM; RACINE, WI; Owner: CLEAR CHANNEL BROADCASTING LICENSES, INC.)
WJZI (93.3 FM; MILWAUKEE, WI; Owner: MILWAUKEE RADIO ALLIANCE, LLC)
WKTI-FM (94.5 FM; MILWAUKEE, WI; Owner: JOURNAL BROADCAST CORPORATION)
WMIL-FM (106.1 FM; WAUKESHA, WI; Owner: CLEAR CHANNEL BROADCASTING LICENSES, INC.)
WFZH (105.3 FM; MUKWONAGO, WI; Owner: CARON BROADCASTING, INC.)
WUWM (89.7 FM; MILWAUKEE, WI; Owner: BOARD OF REGENTS, UNIVERSITY OF WISCONSIN SYSTEM)
WLTQ (97.3 FM; MILWAUKEE, WI; Owner: CAPSTAR TX LIMITED PARTNERSHIP)
WXSS (103.7 FM; WAUWATOSA, WI; Owner: ENTERCOM MILWAUKEE LICENSE, LLC)
WKLH (96.5 FM; MILWAUKEE, WI; Owner: LAKEFRONT COMMUNICATIONS, LLC)
WMWK (88.1 FM; MILWAUKEE, WI; Owner: FAMILY STATIONS, INC.)
WLUM-FM (102.1 FM; MILWAUKEE, WI; Owner: MILWAUKEE RADIO ALLIANCE, LLC)
WLZR (102.9 FM; MILWAUKEE, WI; Owner: LAKEFRONT COMMUNICATIONS, LLC)
WJMR-FM (98.3 FM; MENOMONEE FALLS, WI; Owner: LAKEFRONT COMMUNICATIONS, LLC)
WRIT-FM (95.7 FM; MILWAUKEE, WI; Owner: CLEAR CHANNEL BROADCASTING LICENSES, INC.)
WEXT (104.7 FM; STURTEVANT, WI; Owner: NM LICENSING, LLC)
WHAD (90.7 FM; DELAFIELD, WI; Owner: STATE OF WISCONSIN - EDUCATIONAL COMMUNICATIONS BOARD)
WEZY (92.1 FM; RACINE, WI; Owner: RACINE BROADCASTING, L.L.C.)
WYMS (88.9 FM; MILWAUKEE, WI; Owner: MILWAUKEE BOARD OF SCHOOL DIRECTORS)
TV broadcast stations around Franklin:
WJJA (Channel 49; RACINE, WI; Owner: TV-49, INC.)
WPXE (Channel 55; KENOSHA, WI; Owner: PAXSON MILWAUKEE LICENSE, INC.)
WMKE-CA (Channel 7; MILWAUKEE, WI; Owner: KM LPTV OF MILWAUKEE, L.L.C.)
WMVS (Channel 10; MILWAUKEE, WI; Owner: MILWAUKEE AREA TECHNICAL COLLEGE DISTRICT BOARD)
WCGV-TV (Channel 24; MILWAUKEE, WI; Owner: WCGV LICENSEE, LLC)
WMVT (Channel 36; MILWAUKEE, WI; Owner: MILWAUKEE AREA TECHNICAL COLLEGE DISTRICT BOARD)
WDJT-TV (Channel 58; MILWAUKEE, WI; Owner: WDJT-TV LIMITED PARTNERSHIP)
WISN-TV (Channel 12; MILWAUKEE, WI; Owner: WISN HEARST-ARGYLE TV, INC. (CA CORP.))
WTMJ-TV (Channel 4; MILWAUKEE, WI; Owner: JOURNAL BROADCAST CORPORATION)
WVTV (Channel 18; MILWAUKEE, WI; Owner: WVTV LICENSEE, INC.)
WMLW-CA (Channel 46; MILWAUKEE, WI; Owner: CHANNEL 41 AND 63 LIMITED PARTNERSHIP)
W63CU (Channel 63; MILWAUKEE, WI; Owner: CHANNEL 41 AND 63 LIMITED PARTNERSHIP)
WVCY-TV (Channel 30; MILWAUKEE, WI; Owner: VCY AMERICA, INC.)
WITI (Channel 6; MILWAUKEE, WI; Owner: WITI LICENSE,INC.)
WTAS-LP (Channel 43; WAUKESHA, WI; Owner: WAUKESHA TOWER ASSOCIATES)
W64CQ (Channel 64; ARLINGTON HEIGHTS, IL; Owner: TRINITY BROADCASTING NETWORK)
W34CK (Channel 34; ARLINGTON HEIGHTS, IL; Owner: FIRST UNITED, INC.)
WWRS-TV (Channel 52; MAYVILLE, WI; Owner: NATIONAL MINORITY T.V., INC.)
National Bridge Inventory (NBI) Statistics 33 Number of bridges322ft / 98.2m Total length $4,232,000 Total costs250,949 Total average daily traffic5,025 Total average daily truck traffic
New bridges - historical statistics
3 1930-1939 1 1940-1949 2 1950-1959 2 1960-1969 2 1980-1989 11 1990-1999 5 2000-2009 7 2010-2019
See full National Bridge Inventory statistics for Franklin, WI
Home Mortgage Disclosure Act Aggregated Statistics For Year 2009(Based on 5 full tracts) A) FHA, FSA/RHS & VA B) Conventional C) Refinancings D) Home Improvement Loans E) Loans on Dwellings For 5+ Families F) Non-occupant Loans on G) Loans On Manufactured Number Average Value Number Average Value Number Average Value Number Average Value Number Average Value Number Average Value Number Average Value
LOANS ORIGINATED 67 $187,065 232 $186,196 1,607 $185,449 54 $77,098 3 $3,702,333 33 $202,656 1 $171,830 APPLICATIONS APPROVED, NOT ACCEPTED 4 $209,000 10 $132,176 105 $221,600 15 $48,458 0 $0 1 $210,000 0 $0 APPLICATIONS DENIED 11 $189,873 22 $165,950 282 $212,519 28 $80,769 0 $0 9 $191,481 2 $3,500 APPLICATIONS WITHDRAWN 8 $219,296 23 $214,273 241 $208,753 10 $62,285 0 $0 1 $242,000 0 $0 FILES CLOSED FOR INCOMPLETENESS 0 $0 5 $180,600 52 $205,270 0 $0 0 $0 0 $0 0 $0
Aggregated Statistics For Year 2008(Based on 5 full tracts) A) FHA, FSA/RHS & VA B) Conventional C) Refinancings D) Home Improvement Loans E) Loans on Dwellings For 5+ Families F) Non-occupant Loans on G) Loans On Manufactured Number Average Value Number Average Value Number Average Value Number Average Value Number Average Value Number Average Value Number Average Value
LOANS ORIGINATED 33 $199,232 284 $211,875 701 $189,920 76 $50,495 3 $182,667 23 $144,073 3 $36,323 APPLICATIONS APPROVED, NOT ACCEPTED 2 $243,500 23 $226,908 92 $203,490 12 $44,498 0 $0 2 $263,735 0 $0 APPLICATIONS DENIED 9 $186,556 34 $181,226 212 $216,960 25 $50,510 0 $0 6 $172,667 0 $0 APPLICATIONS WITHDRAWN 7 $201,977 25 $238,270 139 $217,033 8 $131,494 0 $0 5 $194,800 0 $0 FILES CLOSED FOR INCOMPLETENESS 0 $0 8 $170,856 30 $209,794 4 $79,498 0 $0 1 $135,000 0 $0
Aggregated Statistics For Year 2007(Based on 5 full tracts) A) FHA, FSA/RHS & VA B) Conventional C) Refinancings D) Home Improvement Loans E) Loans on Dwellings For 5+ Families F) Non-occupant Loans on G) Loans On Manufactured Number Average Value Number Average Value Number Average Value Number Average Value Number Average Value Number Average Value Number Average Value
LOANS ORIGINATED 14 $194,913 580 $179,969 709 $172,555 142 $47,547 5 $4,994,000 41 $202,192 0 $0 APPLICATIONS APPROVED, NOT ACCEPTED 1 $121,000 49 $159,992 120 $180,713 18 $53,985 0 $0 2 $290,500 1 $70,000 APPLICATIONS DENIED 1 $159,000 58 $207,960 264 $207,976 34 $65,837 0 $0 17 $297,971 1 $10,000 APPLICATIONS WITHDRAWN 1 $153,000 31 $208,235 128 $202,426 10 $107,564 0 $0 6 $159,973 0 $0 FILES CLOSED FOR INCOMPLETENESS 1 $123,000 13 $204,135 43 $213,034 6 $58,323 0 $0 0 $0 0 $0
Aggregated Statistics For Year 2006(Based on 5 full tracts) A) FHA, FSA/RHS & VA B) Conventional C) Refinancings D) Home Improvement Loans E) Loans on Dwellings For 5+ Families F) Non-occupant Loans on G) Loans On Manufactured Number Average Value Number Average Value Number Average Value Number Average Value Number Average Value Number Average Value Number Average Value
LOANS ORIGINATED 3 $154,557 773 $184,852 729 $159,930 103 $40,623 6 $566,667 50 $215,294 5 $15,600 APPLICATIONS APPROVED, NOT ACCEPTED 0 $0 54 $183,494 93 $154,286 14 $58,495 0 $0 2 $89,980 0 $0 APPLICATIONS DENIED 1 $260,000 76 $171,806 249 $189,010 34 $55,999 0 $0 9 $124,527 3 $36,000 APPLICATIONS WITHDRAWN 1 $259,000 49 $216,824 173 $176,852 14 $110,983 0 $0 3 $372,333 2 $198,500 FILES CLOSED FOR INCOMPLETENESS 1 $154,000 10 $146,600 87 $200,759 0 $0 0 $0 0 $0 0 $0
Aggregated Statistics For Year 2005(Based on 5 full tracts) A) FHA, FSA/RHS & VA B) Conventional C) Refinancings D) Home Improvement Loans E) Loans on Dwellings For 5+ Families F) Non-occupant Loans on G) Loans On Manufactured Number Average Value Number Average Value Number Average Value Number Average Value Number Average Value Number Average Value Number Average Value
LOANS ORIGINATED 8 $187,970 796 $188,267 784 $160,470 111 $59,348 3 $2,933,333 54 $209,688 4 $17,500 APPLICATIONS APPROVED, NOT ACCEPTED 0 $0 60 $168,104 76 $144,275 20 $43,274 0 $0 5 $197,760 1 $6,000 APPLICATIONS DENIED 2 $149,500 65 $166,126 252 $165,329 42 $47,808 0 $0 7 $151,656 4 $46,000 APPLICATIONS WITHDRAWN 2 $151,500 39 $197,956 176 $176,934 13 $137,069 0 $0 4 $182,750 0 $0 FILES CLOSED FOR INCOMPLETENESS 0 $0 12 $189,472 132 $202,445 1 $75,000 0 $0 1 $173,830 0 $0
Aggregated Statistics For Year 2004(Based on 5 full tracts) A) FHA, FSA/RHS & VA B) Conventional C) Refinancings D) Home Improvement Loans E) Loans on Dwellings For 5+ Families F) Non-occupant Loans on G) Loans On Manufactured Number Average Value Number Average Value Number Average Value Number Average Value Number Average Value Number Average Value Number Average Value
LOANS ORIGINATED 9 $166,424 719 $175,023 1,027 $152,303 95 $50,411 2 $1,400,000 42 $145,477 4 $47,000 APPLICATIONS APPROVED, NOT ACCEPTED 0 $0 40 $173,915 95 $149,545 17 $55,576 0 $0 2 $104,000 0 $0 APPLICATIONS DENIED 1 $146,000 39 $160,223 206 $141,732 32 $66,860 0 $0 1 $138,000 3 $24,000 APPLICATIONS WITHDRAWN 0 $0 35 $160,931 148 $180,037 4 $74,250 1 $176,000 8 $165,440 0 $0 FILES CLOSED FOR INCOMPLETENESS 0 $0 7 $157,286 85 $165,728 4 $88,988 0 $0 1 $196,000 0 $0
Aggregated Statistics For Year 2003(Based on 5 full tracts) A) FHA, FSA/RHS & VA B) Conventional C) Refinancings D) Home Improvement Loans E) Loans on Dwellings For 5+ Families F) Non-occupant Loans on Number Average Value Number Average Value Number Average Value Number Average Value Number Average Value Number Average Value
LOANS ORIGINATED 14 $153,676 649 $163,948 2,755 $135,694 135 $36,674 8 $1,932,111 54 $286,683 APPLICATIONS APPROVED, NOT ACCEPTED 0 $0 34 $138,686 149 $132,900 16 $23,622 0 $0 6 $141,623 APPLICATIONS DENIED 1 $169,000 40 $145,605 324 $140,256 28 $26,532 0 $0 6 $165,278 APPLICATIONS WITHDRAWN 2 $160,500 61 $153,633 174 $146,082 7 $22,426 0 $0 3 $123,287 FILES CLOSED FOR INCOMPLETENESS 0 $0 11 $108,794 28 $137,133 5 $30,990 0 $0 0 $0
Aggregated Statistics For Year 2002(Based on 3 full tracts) A) FHA, FSA/RHS & VA B) Conventional C) Refinancings D) Home Improvement Loans E) Loans on Dwellings For 5+ Families F) Non-occupant Loans on Number Average Value Number Average Value Number Average Value Number Average Value Number Average Value Number Average Value
LOANS ORIGINATED 8 $184,500 384 $159,268 1,152 $135,487 71 $24,366 3 $4,082,667 26 $133,423 APPLICATIONS APPROVED, NOT ACCEPTED 0 $0 17 $143,235 91 $134,978 6 $21,500 0 $0 0 $0 APPLICATIONS DENIED 1 $186,000 18 $126,611 84 $115,286 12 $20,167 0 $0 3 $78,333 APPLICATIONS WITHDRAWN 0 $0 29 $182,793 77 $145,273 3 $27,667 0 $0 5 $177,000 FILES CLOSED FOR INCOMPLETENESS 1 $123,000 5 $145,000 20 $159,250 0 $0 0 $0 0 $0
Aggregated Statistics For Year 2001(Based on 3 full tracts) A) FHA, FSA/RHS & VA B) Conventional C) Refinancings D) Home Improvement Loans F) Non-occupant Loans on Number Average Value Number Average Value Number Average Value Number Average Value Number Average Value
LOANS ORIGINATED 10 $151,000 353 $151,388 874 $128,711 58 $21,810 10 $106,400 APPLICATIONS APPROVED, NOT ACCEPTED 0 $0 11 $101,909 69 $100,420 3 $19,000 0 $0 APPLICATIONS DENIED 1 $133,000 16 $123,625 84 $130,119 14 $23,643 6 $64,167 APPLICATIONS WITHDRAWN 1 $120,000 14 $141,000 82 $130,610 15 $28,867 1 $130,000 FILES CLOSED FOR INCOMPLETENESS 0 $0 3 $75,333 26 $148,192 0 $0 1 $50,000
Aggregated Statistics For Year 2000(Based on 3 full tracts) A) FHA, FSA/RHS & VA B) Conventional C) Refinancings D) Home Improvement Loans E) Loans on Dwellings For 5+ Families F) Non-occupant Loans on Number Average Value Number Average Value Number Average Value Number Average Value Number Average Value Number Average Value
LOANS ORIGINATED 11 $152,909 339 $143,369 179 $96,117 63 $17,444 2 $1,941,000 10 $118,200 APPLICATIONS APPROVED, NOT ACCEPTED 1 $203,000 15 $114,667 28 $86,643 10 $18,400 0 $0 1 $236,000 APPLICATIONS DENIED 3 $144,667 28 $90,179 40 $73,300 14 $14,714 0 $0 2 $48,500 APPLICATIONS WITHDRAWN 0 $0 14 $124,286 27 $93,889 5 $53,000 0 $0 3 $88,667 FILES CLOSED FOR INCOMPLETENESS 0 $0 3 $142,000 4 $109,750 0 $0 0 $0 0 $0
Aggregated Statistics For Year 1999(Based on 4 full tracts) A) FHA, FSA/RHS & VA B) Conventional C) Refinancings D) Home Improvement Loans E) Loans on Dwellings For 5+ Families F) Non-occupant Loans on Number Average Value Number Average Value Number Average Value Number Average Value Number Average Value Number Average Value
LOANS ORIGINATED 23 $129,556 599 $135,406 555 $98,954 118 $18,275 5 $3,096,216 29 $95,584 APPLICATIONS APPROVED, NOT ACCEPTED 2 $131,200 32 $127,482 82 $83,484 5 $18,740 0 $0 3 $193,940 APPLICATIONS DENIED 0 $0 39 $118,017 111 $93,585 18 $22,642 0 $0 3 $96,357 APPLICATIONS WITHDRAWN 1 $194,900 34 $103,119 71 $97,331 18 $59,578 0 $0 1 $111,620 FILES CLOSED FOR INCOMPLETENESS 0 $0 13 $117,061 25 $130,679 0 $0 0 $0 2 $93,110
Detailed HMDA statistics for the following Tracts:
1501.00
, 1502.00 , 1503.01 , 1503.02 , 1504.00
Private Mortgage Insurance Companies Aggregated Statistics For Year 2009(Based on 5 full tracts) A) Conventional B) Refinancings Number Average Value Number Average Value
LOANS ORIGINATED 71 $210,190 57 $245,639 APPLICATIONS APPROVED, NOT ACCEPTED 14 $240,633 11 $225,168 APPLICATIONS DENIED 6 $226,107 14 $245,347 APPLICATIONS WITHDRAWN 1 $286,000 6 $323,667 FILES CLOSED FOR INCOMPLETENESS 1 $147,000 1 $183,000
Aggregated Statistics For Year 2008(Based on 5 full tracts) A) Conventional B) Refinancings C) Non-occupant Loans on Number Average Value Number Average Value Number Average Value
LOANS ORIGINATED 121 $225,136 79 $235,709 1 $298,000 APPLICATIONS APPROVED, NOT ACCEPTED 11 $244,890 21 $238,225 1 $263,740 APPLICATIONS DENIED 5 $250,000 3 $203,667 0 $0 APPLICATIONS WITHDRAWN 3 $318,000 8 $199,572 0 $0 FILES CLOSED FOR INCOMPLETENESS 0 $0 1 $315,000 0 $0
Aggregated Statistics For Year 2007(Based on 5 full tracts) A) Conventional B) Refinancings C) Non-occupant Loans on Number Average Value Number Average Value Number Average Value
LOANS ORIGINATED 138 $206,936 55 $247,361 4 $162,250 APPLICATIONS APPROVED, NOT ACCEPTED 22 $300,022 10 $219,200 0 $0 APPLICATIONS DENIED 1 $205,000 1 $191,000 0 $0 APPLICATIONS WITHDRAWN 4 $173,750 1 $296,000 0 $0 FILES CLOSED FOR INCOMPLETENESS 0 $0 0 $0 0 $0
Aggregated Statistics For Year 2006(Based on 5 full tracts) A) Conventional B) Refinancings C) Non-occupant Loans on Number Average Value Number Average Value Number Average Value
LOANS ORIGINATED 108 $189,066 25 $232,368 3 $173,613 APPLICATIONS APPROVED, NOT ACCEPTED 16 $256,303 7 $141,827 0 $0 APPLICATIONS DENIED 2 $222,500 1 $293,000 0 $0 APPLICATIONS WITHDRAWN 2 $246,890 1 $140,000 0 $0 FILES CLOSED FOR INCOMPLETENESS 0 $0 0 $0 0 $0
Aggregated Statistics For Year 2005(Based on 5 full tracts) A) Conventional B) Refinancings C) Non-occupant Loans on Number Average Value Number Average Value Number Average Value
LOANS ORIGINATED 149 $197,998 41 $205,266 2 $148,420 APPLICATIONS APPROVED, NOT ACCEPTED 27 $242,919 8 $189,849 0 $0 APPLICATIONS DENIED 1 $374,000 0 $0 0 $0 APPLICATIONS WITHDRAWN 8 $184,206 2 $185,500 0 $0 FILES CLOSED FOR INCOMPLETENESS 0 $0 0 $0 0 $0
Aggregated Statistics For Year 2004(Based on 5 full tracts) A) Conventional B) Refinancings C) Non-occupant Loans on D) Loans On Manufactured Number Average Value Number Average Value Number Average Value Number Average Value
LOANS ORIGINATED 137 $187,490 44 $187,687 0 $0 0 $0 APPLICATIONS APPROVED, NOT ACCEPTED 21 $206,009 17 $199,795 2 $140,500 0 $0 APPLICATIONS DENIED 2 $149,500 0 $0 1 $81,000 0 $0 APPLICATIONS WITHDRAWN 4 $214,705 1 $205,000 0 $0 1 $262,000 FILES CLOSED FOR INCOMPLETENESS 1 $225,000 1 $230,000 0 $0 0 $0
Aggregated Statistics For Year 2003(Based on 5 full tracts) A) Conventional B) Refinancings C) Non-occupant Loans on Number Average Value Number Average Value Number Average Value
LOANS ORIGINATED 187 $182,616 141 $168,300 0 $0 APPLICATIONS APPROVED, NOT ACCEPTED 23 $168,683 17 $164,039 2 $145,000 APPLICATIONS DENIED 2 $232,000 1 $119,000 0 $0 APPLICATIONS WITHDRAWN 11 $160,364 2 $165,000 1 $143,000 FILES CLOSED FOR INCOMPLETENESS 0 $0 0 $0 0 $0
Aggregated Statistics For Year 2002(Based on 3 full tracts) A) Conventional B) Refinancings C) Non-occupant Loans on Number Average Value Number Average Value Number Average Value
LOANS ORIGINATED 89 $181,258 75 $163,547 2 $191,500 APPLICATIONS APPROVED, NOT ACCEPTED 16 $177,562 11 $166,909 2 $161,000 APPLICATIONS DENIED 1 $138,000 0 $0 0 $0 APPLICATIONS WITHDRAWN 1 $361,000 2 $156,000 0 $0 FILES CLOSED FOR INCOMPLETENESS 0 $0 0 $0 0 $0
Aggregated Statistics For Year 2001(Based on 3 full tracts) A) Conventional B) Refinancings C) Non-occupant Loans on Number Average Value Number Average Value Number Average Value
LOANS ORIGINATED 103 $164,816 86 $153,337 0 $0 APPLICATIONS APPROVED, NOT ACCEPTED 14 $177,714 24 $155,958 2 $142,000 APPLICATIONS DENIED 1 $160,000 2 $152,500 0 $0 APPLICATIONS WITHDRAWN 3 $150,667 7 $189,857 0 $0 FILES CLOSED FOR INCOMPLETENESS 1 $160,000 3 $194,000 0 $0
Aggregated Statistics For Year 2000(Based on 3 full tracts) A) Conventional B) Refinancings C) Non-occupant Loans on Number Average Value Number Average Value Number Average Value
LOANS ORIGINATED 86 $161,477 14 $162,500 1 $86,000 APPLICATIONS APPROVED, NOT ACCEPTED 9 $171,222 2 $132,500 0 $0 APPLICATIONS DENIED 1 $139,000 1 $159,000 0 $0 APPLICATIONS WITHDRAWN 3 $108,667 0 $0 1 $86,000 FILES CLOSED FOR INCOMPLETENESS 0 $0 0 $0 0 $0
Aggregated Statistics For Year 1999(Based on 4 full tracts) A) Conventional B) Refinancings C) Non-occupant Loans on Number Average Value Number Average Value Number Average Value
LOANS ORIGINATED 183 $142,806 41 $141,495 3 $121,787 APPLICATIONS APPROVED, NOT ACCEPTED 10 $153,989 9 $119,244 0 $0 APPLICATIONS DENIED 1 $104,640 2 $167,285 0 $0 APPLICATIONS WITHDRAWN 1 $194,550 2 $218,815 0 $0 FILES CLOSED FOR INCOMPLETENESS 0 $0 0 $0 0 $0
Detailed PMIC statistics for the following Tracts:
1501.00
, 1502.00 , 1503.01 , 1503.02 , 1504.00 Fire-safe hotels and motels in Franklin, Wisconsin:
Staybridge Suites, 9575 S 27th St, Franklin, Wisconsin 53132 Phone: (414) 761-3800, Fax: (414) 761-3810
Hampton Inn & Suites Milwaukee/Franklin, 6901 S 76th St, Franklin, Wisconsin 53132 Phone: (414) 427-4800, Fax: (414) 427-4883
All 2 fire-safe hotels and motels in Franklin, Wisconsin Franklin compared to Wisconsin state average:
Unemployed percentage significantly below state average. Foreign-born population percentage above state average. Length of stay since moving in significantly above state average. House age below state average. Institutionalized population percentage significantly above state average. Percentage of population with a bachelor's degree or higher above state average.
#14 on the list of "Top 101 cities with the lowest cost per building permit(population 5,000+)"
#80 on the list of "Top 101 cities with the largest percentage of people in local jails and other confinement facilities (including police lockups) (population 1,000+)"
#79 (53221) on the list of "Top 101 zip codes with the largest percentage of Polish first ancestries (pop 5,000+)"
#6 on the list of "Top 101 counties with the highest average weight of females"
#17 on the list of "Top 101 counties with the most Black Protestant congregations"
#20 on the list of "Top 101 counties with the most Black Protestant adherents"
#22 on the list of "Top 101 counties with the highest number of infant deaths per 1000 residents 2007-2013 (pop. 50,000+)"
#23 on the list of "Top 101 counties with the most Catholic congregations (pop. 50,000+)"
Top Patent Applicants
Robert A. Mantei (25)
Norbert Hahn (15)
Yaoyu Li (10)
Don Miletich (10)
Peter B. Schmidt (9)
Steven Christopher Schmalz (8)
Daniel H. Schneider (8)
Julie L. Bates (6)
Jeffrey D. Mcguire (6)
Michael J. Reinke (6)
Total of 472 patent applications in 2008-2024.
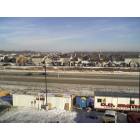
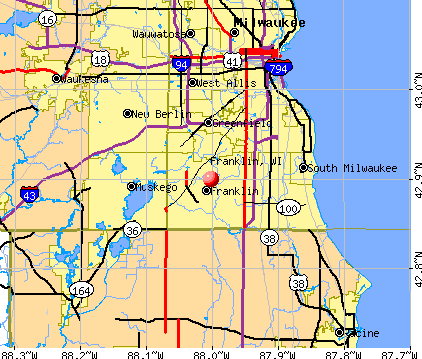


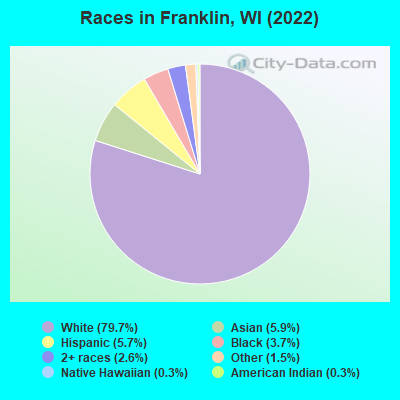
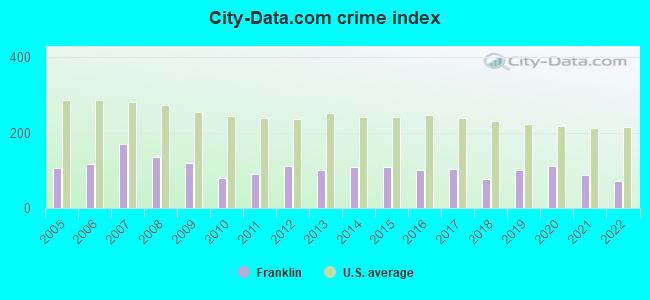
 Recent articles from our blog. Our writers, many of them Ph.D. graduates or candidates, create easy-to-read articles on a wide variety of topics.

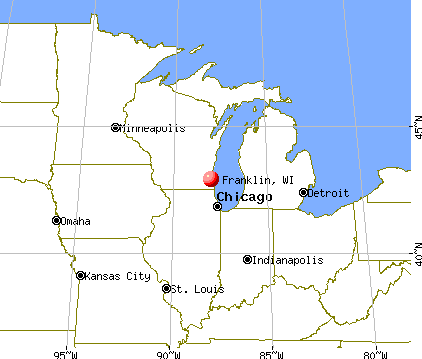
 (7.6 miles
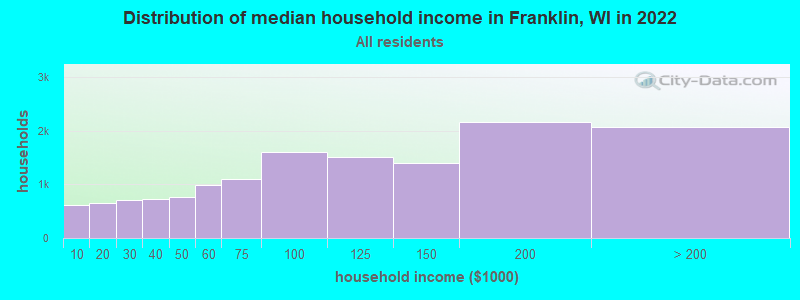
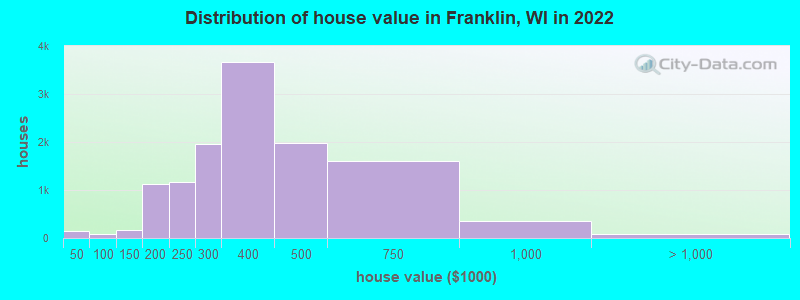

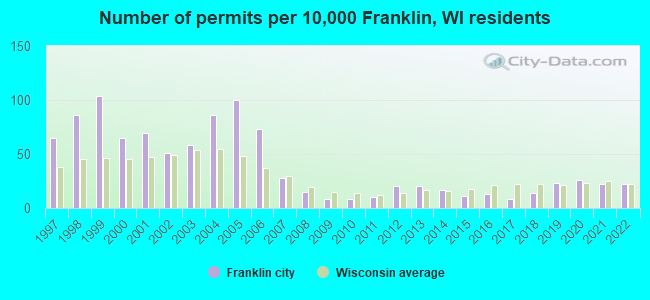
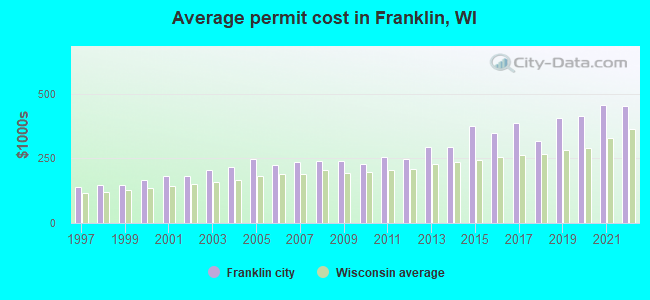
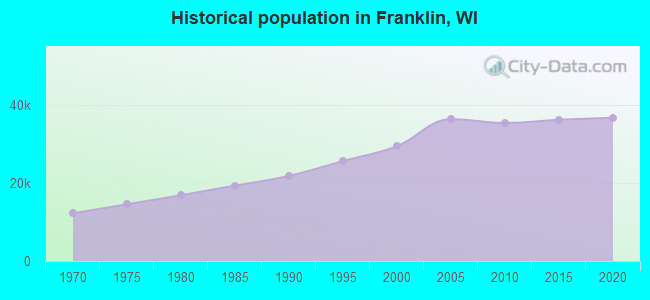
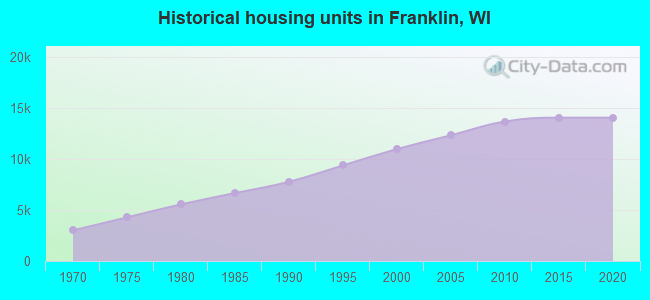
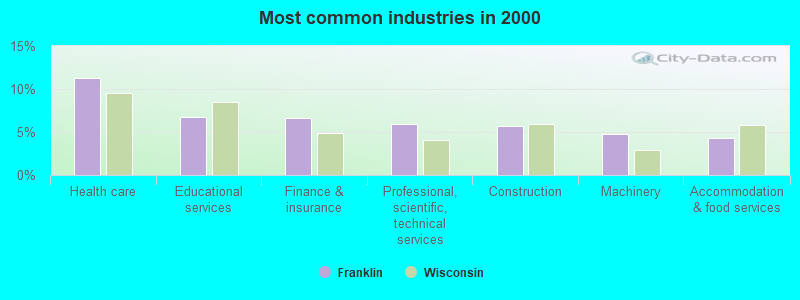
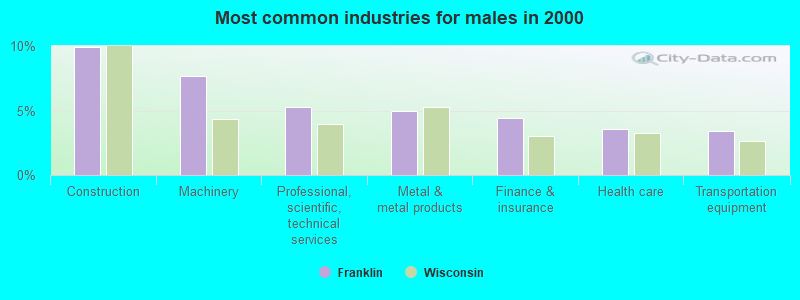
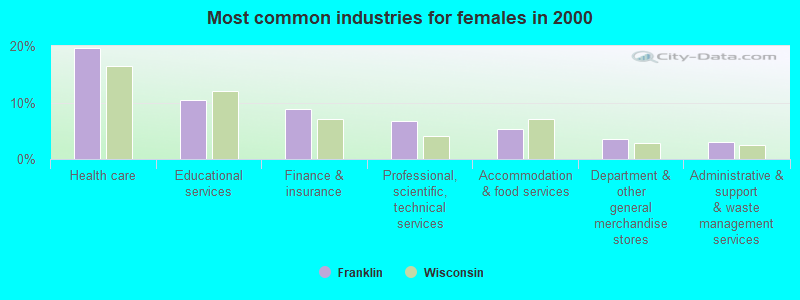
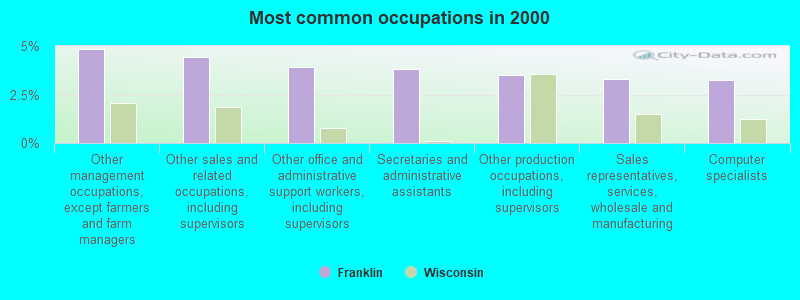
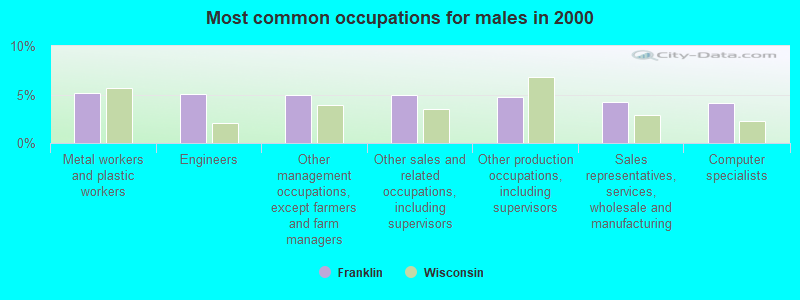
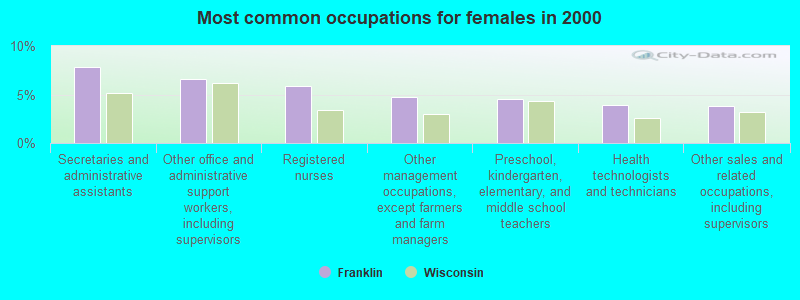


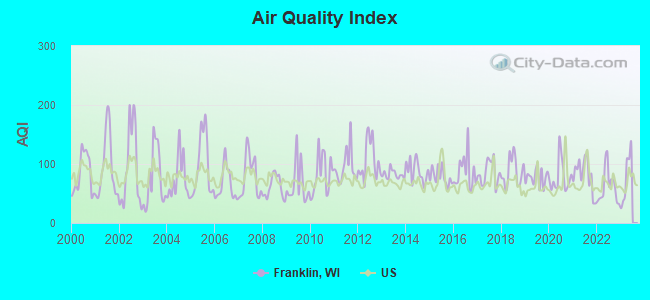
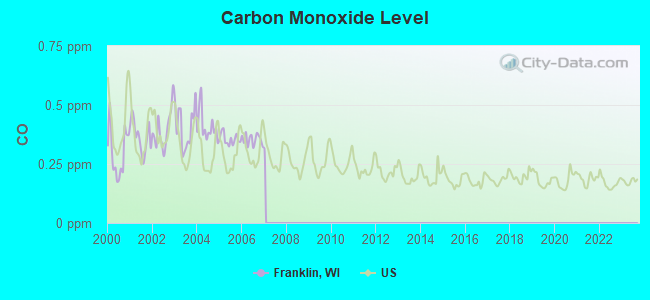
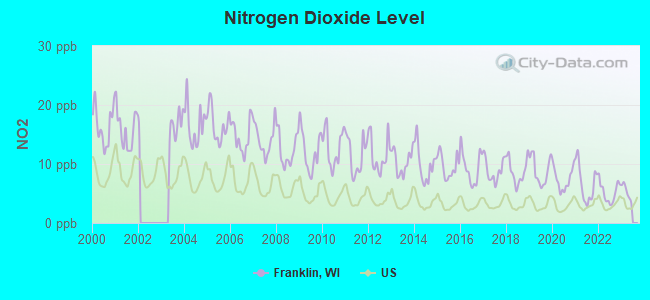
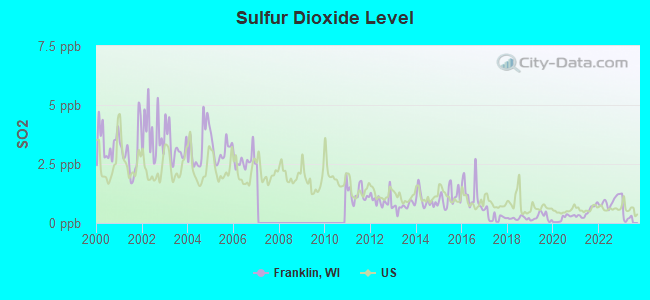
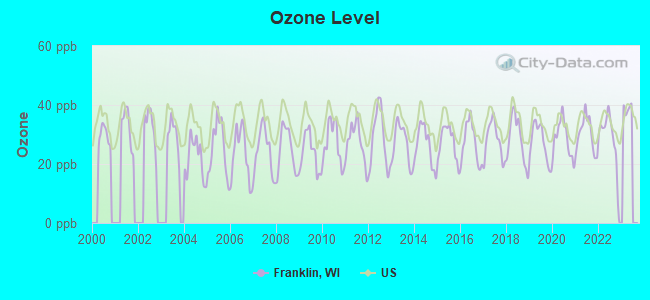
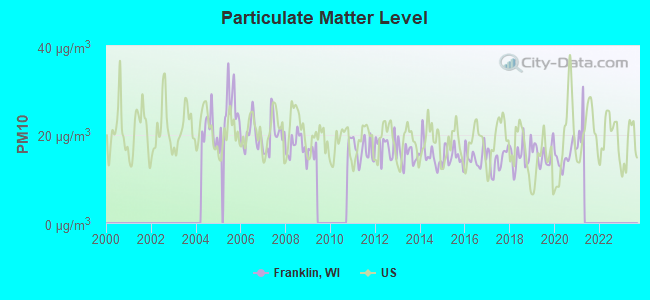
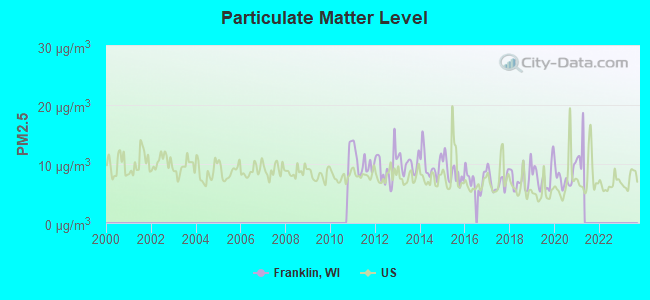
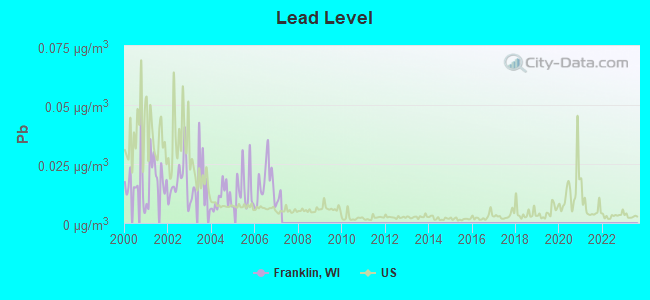

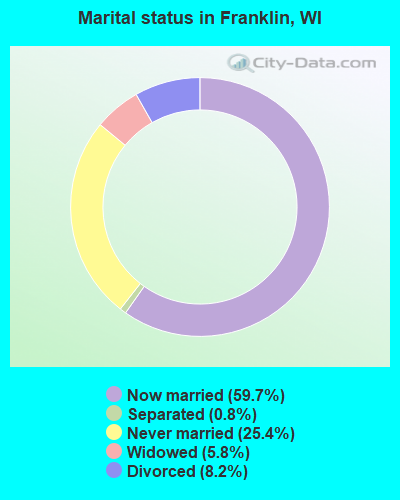
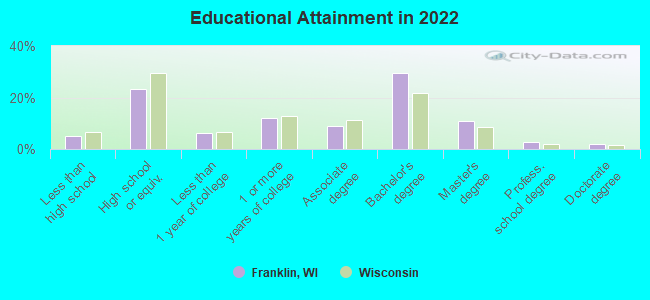
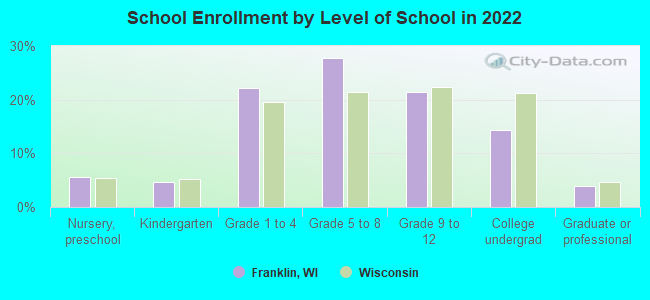
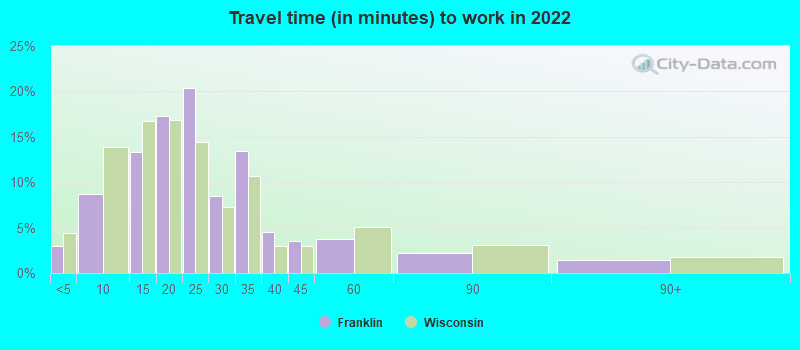
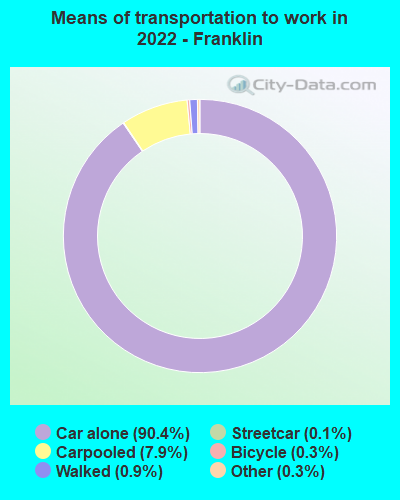
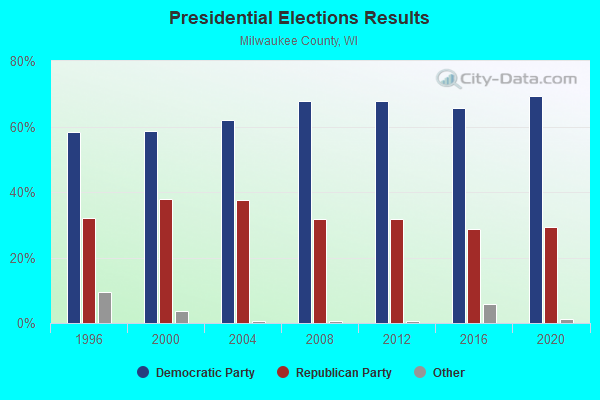
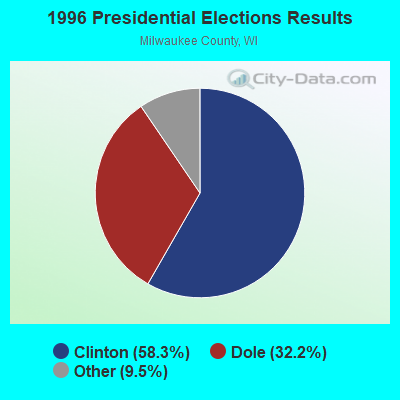
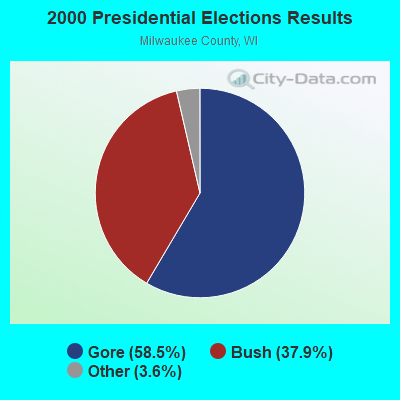
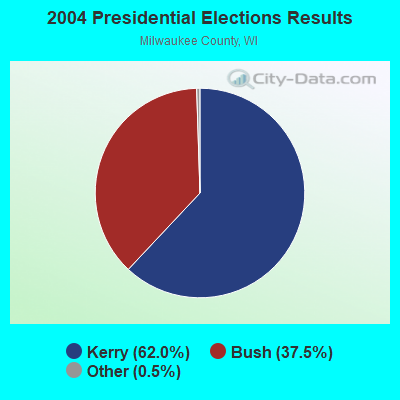
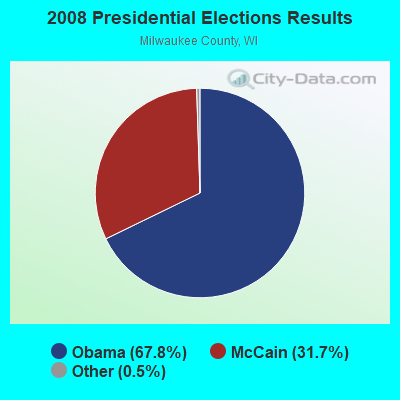
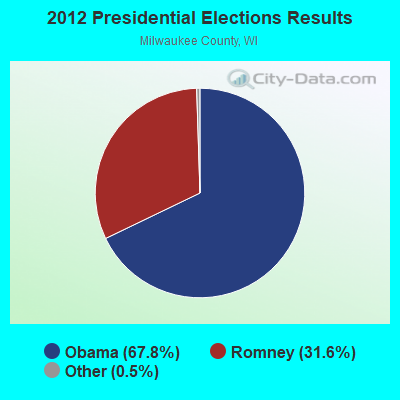
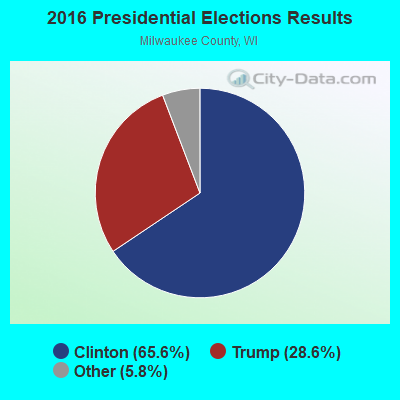
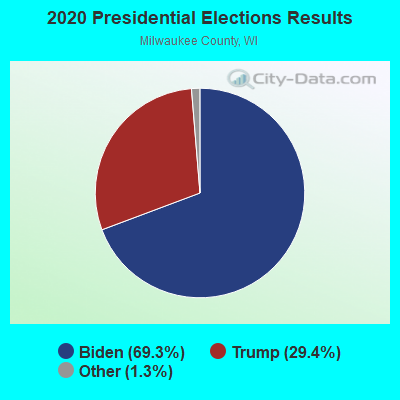
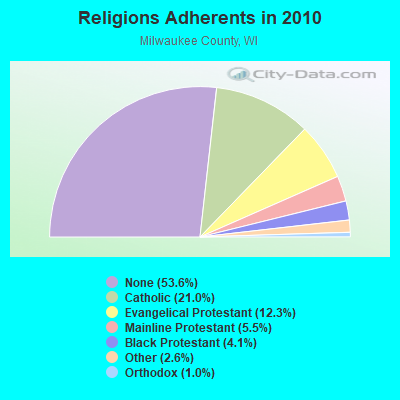
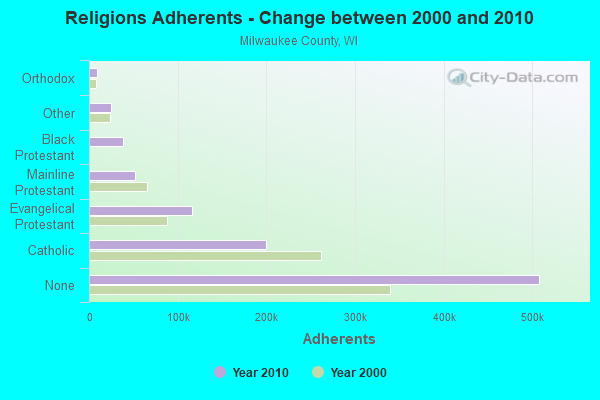
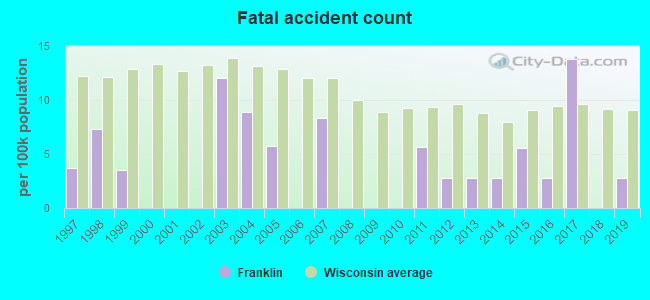
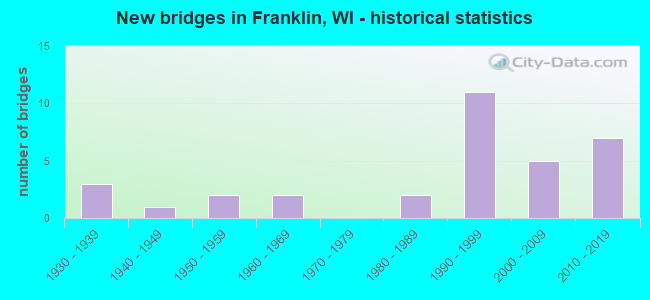
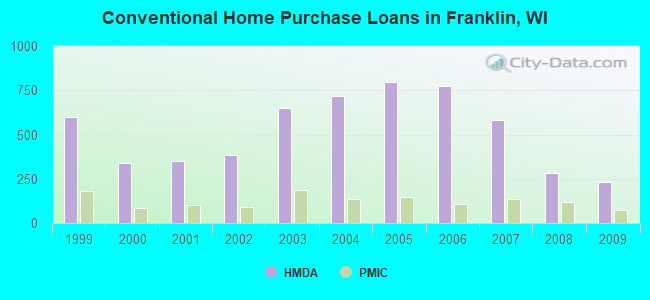
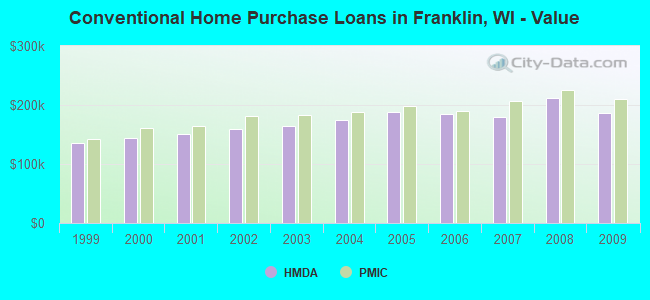
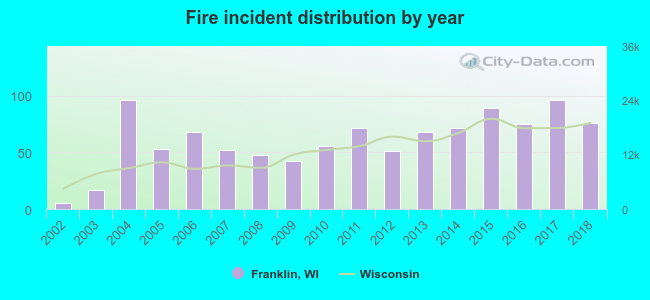 According to the data from the years 2002 - 2018 the average number of fires per year is 61. The highest number of fires - 96 took place in 2004, and the least - 5 in 2002. The data has a rising trend.
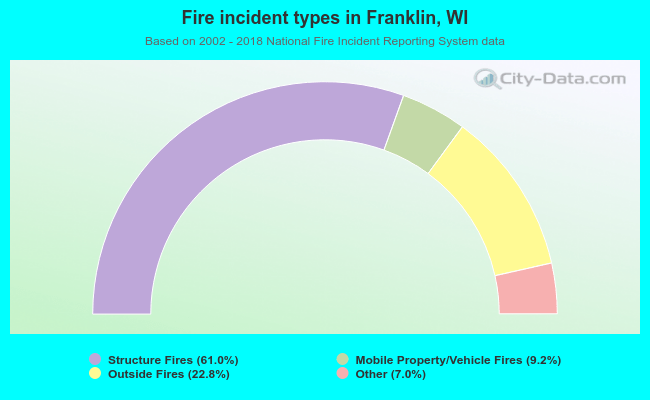 When looking into fire subcategories, the most incidents belonged to: Structure Fires (61.0%), and Outside Fires (22.8%).