Columbia, Pennsylvania Submit your own pictures of this borough and show them to the world
OSM Map
General Map
Google Map
MSN Map
OSM Map
General Map
Google Map
MSN Map
OSM Map
General Map
Google Map
MSN Map
OSM Map
General Map
Google Map
MSN Map
Please wait while loading the map...
Population in 2022: 10,126 (100% urban, 0% rural). Population change since 2000: -1.8%Males: 5,238 Females: 4,888
March 2022 cost of living index in Columbia: 94.7 (less than average, U.S. average is 100) Percentage of residents living in poverty in 2022: 16.5%for White Non-Hispanic residents , 32.0% for Black residents , 37.0% for Hispanic or Latino residents , 38.0% for American Indian residents , 41.5% for other race residents , 43.0% for two or more races residents )
Profiles of local businesses
Business Search - 14 Million verified businesses
Data:
Median household income ($)
Median household income (% change since 2000)
Household income diversity
Ratio of average income to average house value (%)
Ratio of average income to average rent
Median household income ($) - White
Median household income ($) - Black or African American
Median household income ($) - Asian
Median household income ($) - Hispanic or Latino
Median household income ($) - American Indian and Alaska Native
Median household income ($) - Multirace
Median household income ($) - Other Race
Median household income for houses/condos with a mortgage ($)
Median household income for apartments without a mortgage ($)
Races - White alone (%)
Races - White alone (% change since 2000)
Races - Black alone (%)
Races - Black alone (% change since 2000)
Races - American Indian alone (%)
Races - American Indian alone (% change since 2000)
Races - Asian alone (%)
Races - Asian alone (% change since 2000)
Races - Hispanic (%)
Races - Hispanic (% change since 2000)
Races - Native Hawaiian and Other Pacific Islander alone (%)
Races - Native Hawaiian and Other Pacific Islander alone (% change since 2000)
Races - Two or more races (%)
Races - Two or more races (% change since 2000)
Races - Other race alone (%)
Races - Other race alone (% change since 2000)
Racial diversity
Unemployment (%)
Unemployment (% change since 2000)
Unemployment (%) - White
Unemployment (%) - Black or African American
Unemployment (%) - Asian
Unemployment (%) - Hispanic or Latino
Unemployment (%) - American Indian and Alaska Native
Unemployment (%) - Multirace
Unemployment (%) - Other Race
Population density (people per square mile)
Population - Males (%)
Population - Females (%)
Population - Males (%) - White
Population - Males (%) - Black or African American
Population - Males (%) - Asian
Population - Males (%) - Hispanic or Latino
Population - Males (%) - American Indian and Alaska Native
Population - Males (%) - Multirace
Population - Males (%) - Other Race
Population - Females (%) - White
Population - Females (%) - Black or African American
Population - Females (%) - Asian
Population - Females (%) - Hispanic or Latino
Population - Females (%) - American Indian and Alaska Native
Population - Females (%) - Multirace
Population - Females (%) - Other Race
Coronavirus confirmed cases (Jun 08, 2024)
Deaths caused by coronavirus (Jun 08, 2024)
Coronavirus confirmed cases (per 100k population) (Jun 08, 2024)
Deaths caused by coronavirus (per 100k population) (Jun 08, 2024)
Daily increase in number of cases (Jun 08, 2024)
Weekly increase in number of cases (Jun 08, 2024)
Cases doubled (in days) (Jun 08, 2024)
Hospitalized patients (Apr 18, 2022)
Negative test results (Apr 18, 2022)
Total test results (Apr 18, 2022)
COVID Vaccine doses distributed (per 100k population) (Sep 19, 2023)
COVID Vaccine doses administered (per 100k population) (Sep 19, 2023)
COVID Vaccine doses distributed (Sep 19, 2023)
COVID Vaccine doses administered (Sep 19, 2023)
Likely homosexual households (%)
Likely homosexual households (% change since 2000)
Likely homosexual households - Lesbian couples (%)
Likely homosexual households - Lesbian couples (% change since 2000)
Likely homosexual households - Gay men (%)
Likely homosexual households - Gay men (% change since 2000)
Cost of living index
Median gross rent ($)
Median contract rent ($)
Median monthly housing costs ($)
Median house or condo value ($)
Median house or condo value ($ change since 2000)
Mean house or condo value by units in structure - 1, detached ($)
Mean house or condo value by units in structure - 1, attached ($)
Mean house or condo value by units in structure - 2 ($)
Mean house or condo value by units in structure by units in structure - 3 or 4 ($)
Mean house or condo value by units in structure - 5 or more ($)
Mean house or condo value by units in structure - Boat, RV, van, etc. ($)
Mean house or condo value by units in structure - Mobile home ($)
Median house or condo value ($) - White
Median house or condo value ($) - Black or African American
Median house or condo value ($) - Asian
Median house or condo value ($) - Hispanic or Latino
Median house or condo value ($) - American Indian and Alaska Native
Median house or condo value ($) - Multirace
Median house or condo value ($) - Other Race
Median resident age
Resident age diversity
Median resident age - Males
Median resident age - Females
Median resident age - White
Median resident age - Black or African American
Median resident age - Asian
Median resident age - Hispanic or Latino
Median resident age - American Indian and Alaska Native
Median resident age - Multirace
Median resident age - Other Race
Median resident age - Males - White
Median resident age - Males - Black or African American
Median resident age - Males - Asian
Median resident age - Males - Hispanic or Latino
Median resident age - Males - American Indian and Alaska Native
Median resident age - Males - Multirace
Median resident age - Males - Other Race
Median resident age - Females - White
Median resident age - Females - Black or African American
Median resident age - Females - Asian
Median resident age - Females - Hispanic or Latino
Median resident age - Females - American Indian and Alaska Native
Median resident age - Females - Multirace
Median resident age - Females - Other Race
Commute - mean travel time to work (minutes)
Travel time to work - Less than 5 minutes (%)
Travel time to work - Less than 5 minutes (% change since 2000)
Travel time to work - 5 to 9 minutes (%)
Travel time to work - 5 to 9 minutes (% change since 2000)
Travel time to work - 10 to 19 minutes (%)
Travel time to work - 10 to 19 minutes (% change since 2000)
Travel time to work - 20 to 29 minutes (%)
Travel time to work - 20 to 29 minutes (% change since 2000)
Travel time to work - 30 to 39 minutes (%)
Travel time to work - 30 to 39 minutes (% change since 2000)
Travel time to work - 40 to 59 minutes (%)
Travel time to work - 40 to 59 minutes (% change since 2000)
Travel time to work - 60 to 89 minutes (%)
Travel time to work - 60 to 89 minutes (% change since 2000)
Travel time to work - 90 or more minutes (%)
Travel time to work - 90 or more minutes (% change since 2000)
Marital status - Never married (%)
Marital status - Now married (%)
Marital status - Separated (%)
Marital status - Widowed (%)
Marital status - Divorced (%)
Median family income ($)
Median family income (% change since 2000)
Median non-family income ($)
Median non-family income (% change since 2000)
Median per capita income ($)
Median per capita income (% change since 2000)
Median family income ($) - White
Median family income ($) - Black or African American
Median family income ($) - Asian
Median family income ($) - Hispanic or Latino
Median family income ($) - American Indian and Alaska Native
Median family income ($) - Multirace
Median family income ($) - Other Race
Median year house/condo built
Median year apartment built
Year house built - Built 2005 or later (%)
Year house built - Built 2000 to 2004 (%)
Year house built - Built 1990 to 1999 (%)
Year house built - Built 1980 to 1989 (%)
Year house built - Built 1970 to 1979 (%)
Year house built - Built 1960 to 1969 (%)
Year house built - Built 1950 to 1959 (%)
Year house built - Built 1940 to 1949 (%)
Year house built - Built 1939 or earlier (%)
Average household size
Household density (households per square mile)
Average household size - White
Average household size - Black or African American
Average household size - Asian
Average household size - Hispanic or Latino
Average household size - American Indian and Alaska Native
Average household size - Multirace
Average household size - Other Race
Occupied housing units (%)
Vacant housing units (%)
Owner occupied housing units (%)
Renter occupied housing units (%)
Vacancy status - For rent (%)
Vacancy status - For sale only (%)
Vacancy status - Rented or sold, not occupied (%)
Vacancy status - For seasonal, recreational, or occasional use (%)
Vacancy status - For migrant workers (%)
Vacancy status - Other vacant (%)
Residents with income below the poverty level (%)
Residents with income below 50% of the poverty level (%)
Children below poverty level (%)
Poor families by family type - Married-couple family (%)
Poor families by family type - Male, no wife present (%)
Poor families by family type - Female, no husband present (%)
Poverty status for native-born residents (%)
Poverty status for foreign-born residents (%)
Poverty among high school graduates not in families (%)
Poverty among people who did not graduate high school not in families (%)
Residents with income below the poverty level (%) - White
Residents with income below the poverty level (%) - Black or African American
Residents with income below the poverty level (%) - Asian
Residents with income below the poverty level (%) - Hispanic or Latino
Residents with income below the poverty level (%) - American Indian and Alaska Native
Residents with income below the poverty level (%) - Multirace
Residents with income below the poverty level (%) - Other Race
Air pollution - Air Quality Index (AQI)
Air pollution - CO
Air pollution - NO2
Air pollution - SO2
Air pollution - Ozone
Air pollution - PM10
Air pollution - PM25
Air pollution - Pb
Crime - Murders per 100,000 population
Crime - Rapes per 100,000 population
Crime - Robberies per 100,000 population
Crime - Assaults per 100,000 population
Crime - Burglaries per 100,000 population
Crime - Thefts per 100,000 population
Crime - Auto thefts per 100,000 population
Crime - Arson per 100,000 population
Crime - City-data.com crime index
Crime - Violent crime index
Crime - Property crime index
Crime - Murders per 100,000 population (5 year average)
Crime - Rapes per 100,000 population (5 year average)
Crime - Robberies per 100,000 population (5 year average)
Crime - Assaults per 100,000 population (5 year average)
Crime - Burglaries per 100,000 population (5 year average)
Crime - Thefts per 100,000 population (5 year average)
Crime - Auto thefts per 100,000 population (5 year average)
Crime - Arson per 100,000 population (5 year average)
Crime - City-data.com crime index (5 year average)
Crime - Violent crime index (5 year average)
Crime - Property crime index (5 year average)
1996 Presidential Elections Results (%) - Democratic Party (Clinton)
1996 Presidential Elections Results (%) - Republican Party (Dole)
1996 Presidential Elections Results (%) - Other
2000 Presidential Elections Results (%) - Democratic Party (Gore)
2000 Presidential Elections Results (%) - Republican Party (Bush)
2000 Presidential Elections Results (%) - Other
2004 Presidential Elections Results (%) - Democratic Party (Kerry)
2004 Presidential Elections Results (%) - Republican Party (Bush)
2004 Presidential Elections Results (%) - Other
2008 Presidential Elections Results (%) - Democratic Party (Obama)
2008 Presidential Elections Results (%) - Republican Party (McCain)
2008 Presidential Elections Results (%) - Other
2012 Presidential Elections Results (%) - Democratic Party (Obama)
2012 Presidential Elections Results (%) - Republican Party (Romney)
2012 Presidential Elections Results (%) - Other
2016 Presidential Elections Results (%) - Democratic Party (Clinton)
2016 Presidential Elections Results (%) - Republican Party (Trump)
2016 Presidential Elections Results (%) - Other
2020 Presidential Elections Results (%) - Democratic Party (Biden)
2020 Presidential Elections Results (%) - Republican Party (Trump)
2020 Presidential Elections Results (%) - Other
Ancestries Reported - Arab (%)
Ancestries Reported - Czech (%)
Ancestries Reported - Danish (%)
Ancestries Reported - Dutch (%)
Ancestries Reported - English (%)
Ancestries Reported - French (%)
Ancestries Reported - French Canadian (%)
Ancestries Reported - German (%)
Ancestries Reported - Greek (%)
Ancestries Reported - Hungarian (%)
Ancestries Reported - Irish (%)
Ancestries Reported - Italian (%)
Ancestries Reported - Lithuanian (%)
Ancestries Reported - Norwegian (%)
Ancestries Reported - Polish (%)
Ancestries Reported - Portuguese (%)
Ancestries Reported - Russian (%)
Ancestries Reported - Scotch-Irish (%)
Ancestries Reported - Scottish (%)
Ancestries Reported - Slovak (%)
Ancestries Reported - Subsaharan African (%)
Ancestries Reported - Swedish (%)
Ancestries Reported - Swiss (%)
Ancestries Reported - Ukrainian (%)
Ancestries Reported - United States (%)
Ancestries Reported - Welsh (%)
Ancestries Reported - West Indian (%)
Ancestries Reported - Other (%)
Educational Attainment - No schooling completed (%)
Educational Attainment - Less than high school (%)
Educational Attainment - High school or equivalent (%)
Educational Attainment - Less than 1 year of college (%)
Educational Attainment - 1 or more years of college (%)
Educational Attainment - Associate degree (%)
Educational Attainment - Bachelor's degree (%)
Educational Attainment - Master's degree (%)
Educational Attainment - Professional school degree (%)
Educational Attainment - Doctorate degree (%)
School Enrollment - Nursery, preschool (%)
School Enrollment - Kindergarten (%)
School Enrollment - Grade 1 to 4 (%)
School Enrollment - Grade 5 to 8 (%)
School Enrollment - Grade 9 to 12 (%)
School Enrollment - College undergrad (%)
School Enrollment - Graduate or professional (%)
School Enrollment - Not enrolled in school (%)
School enrollment - Public schools (%)
School enrollment - Private schools (%)
School enrollment - Not enrolled (%)
Median number of rooms in houses and condos
Median number of rooms in apartments
Housing units lacking complete plumbing facilities (%)
Housing units lacking complete kitchen facilities (%)
Density of houses
Urban houses (%)
Rural houses (%)
Households with people 60 years and over (%)
Households with people 65 years and over (%)
Households with people 75 years and over (%)
Households with one or more nonrelatives (%)
Households with no nonrelatives (%)
Population in households (%)
Family households (%)
Nonfamily households (%)
Population in families (%)
Family households with own children (%)
Median number of bedrooms in owner occupied houses
Mean number of bedrooms in owner occupied houses
Median number of bedrooms in renter occupied houses
Mean number of bedrooms in renter occupied houses
Median number of vehichles in owner occupied houses
Mean number of vehichles in owner occupied houses
Median number of vehichles in renter occupied houses
Mean number of vehichles in renter occupied houses
Mortgage status - with mortgage (%)
Mortgage status - with second mortgage (%)
Mortgage status - with home equity loan (%)
Mortgage status - with both second mortgage and home equity loan (%)
Mortgage status - without a mortgage (%)
Average family size
Average family size - White
Average family size - Black or African American
Average family size - Asian
Average family size - Hispanic or Latino
Average family size - American Indian and Alaska Native
Average family size - Multirace
Average family size - Other Race
Geographical mobility - Same house 1 year ago (%)
Geographical mobility - Moved within same county (%)
Geographical mobility - Moved from different county within same state (%)
Geographical mobility - Moved from different state (%)
Geographical mobility - Moved from abroad (%)
Place of birth - Born in state of residence (%)
Place of birth - Born in other state (%)
Place of birth - Native, outside of US (%)
Place of birth - Foreign born (%)
Housing units in structures - 1, detached (%)
Housing units in structures - 1, attached (%)
Housing units in structures - 2 (%)
Housing units in structures - 3 or 4 (%)
Housing units in structures - 5 to 9 (%)
Housing units in structures - 10 to 19 (%)
Housing units in structures - 20 to 49 (%)
Housing units in structures - 50 or more (%)
Housing units in structures - Mobile home (%)
Housing units in structures - Boat, RV, van, etc. (%)
House/condo owner moved in on average (years ago)
Renter moved in on average (years ago)
Year householder moved into unit - Moved in 1999 to March 2000 (%)
Year householder moved into unit - Moved in 1995 to 1998 (%)
Year householder moved into unit - Moved in 1990 to 1994 (%)
Year householder moved into unit - Moved in 1980 to 1989 (%)
Year householder moved into unit - Moved in 1970 to 1979 (%)
Year householder moved into unit - Moved in 1969 or earlier (%)
Means of transportation to work - Drove car alone (%)
Means of transportation to work - Carpooled (%)
Means of transportation to work - Public transportation (%)
Means of transportation to work - Bus or trolley bus (%)
Means of transportation to work - Streetcar or trolley car (%)
Means of transportation to work - Subway or elevated (%)
Means of transportation to work - Railroad (%)
Means of transportation to work - Ferryboat (%)
Means of transportation to work - Taxicab (%)
Means of transportation to work - Motorcycle (%)
Means of transportation to work - Bicycle (%)
Means of transportation to work - Walked (%)
Means of transportation to work - Other means (%)
Working at home (%)
Industry diversity
Most Common Industries - Agriculture, forestry, fishing and hunting, and mining (%)
Most Common Industries - Agriculture, forestry, fishing and hunting (%)
Most Common Industries - Mining, quarrying, and oil and gas extraction (%)
Most Common Industries - Construction (%)
Most Common Industries - Manufacturing (%)
Most Common Industries - Wholesale trade (%)
Most Common Industries - Retail trade (%)
Most Common Industries - Transportation and warehousing, and utilities (%)
Most Common Industries - Transportation and warehousing (%)
Most Common Industries - Utilities (%)
Most Common Industries - Information (%)
Most Common Industries - Finance and insurance, and real estate and rental and leasing (%)
Most Common Industries - Finance and insurance (%)
Most Common Industries - Real estate and rental and leasing (%)
Most Common Industries - Professional, scientific, and management, and administrative and waste management services (%)
Most Common Industries - Professional, scientific, and technical services (%)
Most Common Industries - Management of companies and enterprises (%)
Most Common Industries - Administrative and support and waste management services (%)
Most Common Industries - Educational services, and health care and social assistance (%)
Most Common Industries - Educational services (%)
Most Common Industries - Health care and social assistance (%)
Most Common Industries - Arts, entertainment, and recreation, and accommodation and food services (%)
Most Common Industries - Arts, entertainment, and recreation (%)
Most Common Industries - Accommodation and food services (%)
Most Common Industries - Other services, except public administration (%)
Most Common Industries - Public administration (%)
Occupation diversity
Most Common Occupations - Management, business, science, and arts occupations (%)
Most Common Occupations - Management, business, and financial occupations (%)
Most Common Occupations - Management occupations (%)
Most Common Occupations - Business and financial operations occupations (%)
Most Common Occupations - Computer, engineering, and science occupations (%)
Most Common Occupations - Computer and mathematical occupations (%)
Most Common Occupations - Architecture and engineering occupations (%)
Most Common Occupations - Life, physical, and social science occupations (%)
Most Common Occupations - Education, legal, community service, arts, and media occupations (%)
Most Common Occupations - Community and social service occupations (%)
Most Common Occupations - Legal occupations (%)
Most Common Occupations - Education, training, and library occupations (%)
Most Common Occupations - Arts, design, entertainment, sports, and media occupations (%)
Most Common Occupations - Healthcare practitioners and technical occupations (%)
Most Common Occupations - Health diagnosing and treating practitioners and other technical occupations (%)
Most Common Occupations - Health technologists and technicians (%)
Most Common Occupations - Service occupations (%)
Most Common Occupations - Healthcare support occupations (%)
Most Common Occupations - Protective service occupations (%)
Most Common Occupations - Fire fighting and prevention, and other protective service workers including supervisors (%)
Most Common Occupations - Law enforcement workers including supervisors (%)
Most Common Occupations - Food preparation and serving related occupations (%)
Most Common Occupations - Building and grounds cleaning and maintenance occupations (%)
Most Common Occupations - Personal care and service occupations (%)
Most Common Occupations - Sales and office occupations (%)
Most Common Occupations - Sales and related occupations (%)
Most Common Occupations - Office and administrative support occupations (%)
Most Common Occupations - Natural resources, construction, and maintenance occupations (%)
Most Common Occupations - Farming, fishing, and forestry occupations (%)
Most Common Occupations - Construction and extraction occupations (%)
Most Common Occupations - Installation, maintenance, and repair occupations (%)
Most Common Occupations - Production, transportation, and material moving occupations (%)
Most Common Occupations - Production occupations (%)
Most Common Occupations - Transportation occupations (%)
Most Common Occupations - Material moving occupations (%)
People in Group quarters - Institutionalized population (%)
People in Group quarters - Correctional institutions (%)
People in Group quarters - Federal prisons and detention centers (%)
People in Group quarters - Halfway houses (%)
People in Group quarters - Local jails and other confinement facilities (including police lockups) (%)
People in Group quarters - Military disciplinary barracks (%)
People in Group quarters - State prisons (%)
People in Group quarters - Other types of correctional institutions (%)
People in Group quarters - Nursing homes (%)
People in Group quarters - Hospitals/wards, hospices, and schools for the handicapped (%)
People in Group quarters - Hospitals/wards and hospices for chronically ill (%)
People in Group quarters - Hospices or homes for chronically ill (%)
People in Group quarters - Military hospitals or wards for chronically ill (%)
People in Group quarters - Other hospitals or wards for chronically ill (%)
People in Group quarters - Hospitals or wards for drug/alcohol abuse (%)
People in Group quarters - Mental (Psychiatric) hospitals or wards (%)
People in Group quarters - Schools, hospitals, or wards for the mentally retarded (%)
People in Group quarters - Schools, hospitals, or wards for the physically handicapped (%)
People in Group quarters - Institutions for the deaf (%)
People in Group quarters - Institutions for the blind (%)
People in Group quarters - Orthopedic wards and institutions for the physically handicapped (%)
People in Group quarters - Wards in general hospitals for patients who have no usual home elsewhere (%)
People in Group quarters - Wards in military hospitals for patients who have no usual home elsewhere (%)
People in Group quarters - Juvenile institutions (%)
People in Group quarters - Long-term care (%)
People in Group quarters - Homes for abused, dependent, and neglected children (%)
People in Group quarters - Residential treatment centers for emotionally disturbed children (%)
People in Group quarters - Training schools for juvenile delinquents (%)
People in Group quarters - Short-term care, detention or diagnostic centers for delinquent children (%)
People in Group quarters - Type of juvenile institution unknown (%)
People in Group quarters - Noninstitutionalized population (%)
People in Group quarters - College dormitories (includes college quarters off campus) (%)
People in Group quarters - Military quarters (%)
People in Group quarters - On base (%)
People in Group quarters - Barracks, unaccompanied personnel housing (UPH), (Enlisted/Officer), ;and similar group living quarters for military personnel (%)
People in Group quarters - Transient quarters for temporary residents (%)
People in Group quarters - Military ships (%)
People in Group quarters - Group homes (%)
People in Group quarters - Homes or halfway houses for drug/alcohol abuse (%)
People in Group quarters - Homes for the mentally ill (%)
People in Group quarters - Homes for the mentally retarded (%)
People in Group quarters - Homes for the physically handicapped (%)
People in Group quarters - Other group homes (%)
People in Group quarters - Religious group quarters (%)
People in Group quarters - Dormitories (%)
People in Group quarters - Agriculture workers' dormitories on farms (%)
People in Group quarters - Job Corps and vocational training facilities (%)
People in Group quarters - Other workers' dormitories (%)
People in Group quarters - Crews of maritime vessels (%)
People in Group quarters - Other nonhousehold living situations (%)
People in Group quarters - Other noninstitutional group quarters (%)
Residents speaking English at home (%)
Residents speaking English at home - Born in the United States (%)
Residents speaking English at home - Native, born elsewhere (%)
Residents speaking English at home - Foreign born (%)
Residents speaking Spanish at home (%)
Residents speaking Spanish at home - Born in the United States (%)
Residents speaking Spanish at home - Native, born elsewhere (%)
Residents speaking Spanish at home - Foreign born (%)
Residents speaking other language at home (%)
Residents speaking other language at home - Born in the United States (%)
Residents speaking other language at home - Native, born elsewhere (%)
Residents speaking other language at home - Foreign born (%)
Class of Workers - Employee of private company (%)
Class of Workers - Self-employed in own incorporated business (%)
Class of Workers - Private not-for-profit wage and salary workers (%)
Class of Workers - Local government workers (%)
Class of Workers - State government workers (%)
Class of Workers - Federal government workers (%)
Class of Workers - Self-employed workers in own not incorporated business and Unpaid family workers (%)
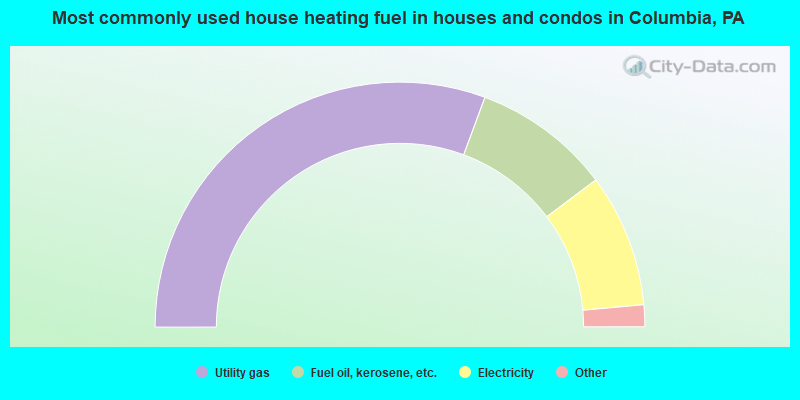
House heating fuel used in houses and condos - Utility gas (%)
House heating fuel used in houses and condos - Bottled, tank, or LP gas (%)
House heating fuel used in houses and condos - Electricity (%)
House heating fuel used in houses and condos - Fuel oil, kerosene, etc. (%)
House heating fuel used in houses and condos - Coal or coke (%)
House heating fuel used in houses and condos - Wood (%)
House heating fuel used in houses and condos - Solar energy (%)
House heating fuel used in houses and condos - Other fuel (%)
House heating fuel used in houses and condos - No fuel used (%)
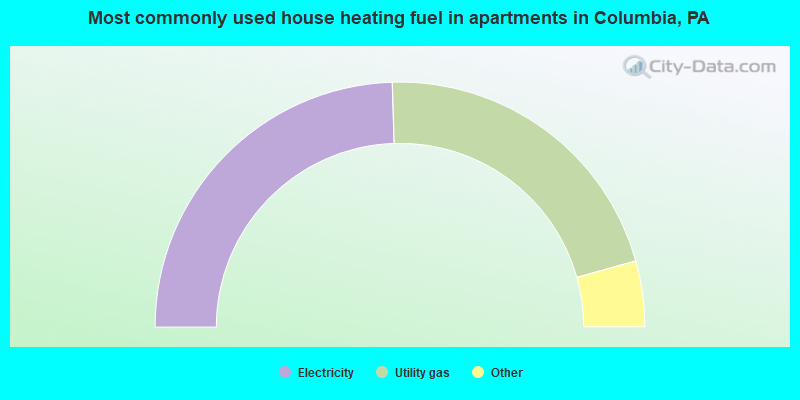
House heating fuel used in apartments - Utility gas (%)
House heating fuel used in apartments - Bottled, tank, or LP gas (%)
House heating fuel used in apartments - Electricity (%)
House heating fuel used in apartments - Fuel oil, kerosene, etc. (%)
House heating fuel used in apartments - Coal or coke (%)
House heating fuel used in apartments - Wood (%)
House heating fuel used in apartments - Solar energy (%)
House heating fuel used in apartments - Other fuel (%)
House heating fuel used in apartments - No fuel used (%)
Armed forces status - In Armed Forces (%)
Armed forces status - Civilian (%)
Armed forces status - Civilian - Veteran (%)
Armed forces status - Civilian - Nonveteran (%)
Fatal accidents locations in years 2005-2021
Fatal accidents locations in 2005
Fatal accidents locations in 2006
Fatal accidents locations in 2007
Fatal accidents locations in 2008
Fatal accidents locations in 2009
Fatal accidents locations in 2010
Fatal accidents locations in 2011
Fatal accidents locations in 2012
Fatal accidents locations in 2013
Fatal accidents locations in 2014
Fatal accidents locations in 2015
Fatal accidents locations in 2016
Fatal accidents locations in 2017
Fatal accidents locations in 2018
Fatal accidents locations in 2019
Fatal accidents locations in 2020
Fatal accidents locations in 2021
Alcohol use - People drinking some alcohol every month (%)
Alcohol use - People not drinking at all (%)
Alcohol use - Average days/month drinking alcohol
Alcohol use - Average drinks/week
Alcohol use - Average days/year people drink much
Audiometry - Average condition of hearing (%)
Audiometry - People that can hear a whisper from across a quiet room (%)
Audiometry - People that can hear normal voice from across a quiet room (%)
Audiometry - Ears ringing, roaring, buzzing (%)
Audiometry - Had a job exposure to loud noise (%)
Audiometry - Had off-work exposure to loud noise (%)
Blood Pressure & Cholesterol - Has high blood pressure (%)
Blood Pressure & Cholesterol - Checking blood pressure at home (%)
Blood Pressure & Cholesterol - Frequently checking blood cholesterol (%)
Blood Pressure & Cholesterol - Has high cholesterol level (%)
Consumer Behavior - Money monthly spent on food at supermarket/grocery store
Consumer Behavior - Money monthly spent on food at other stores
Consumer Behavior - Money monthly spent on eating out
Consumer Behavior - Money monthly spent on carryout/delivered foods
Consumer Behavior - Income spent on food at supermarket/grocery store (%)
Consumer Behavior - Income spent on food at other stores (%)
Consumer Behavior - Income spent on eating out (%)
Consumer Behavior - Income spent on carryout/delivered foods (%)
Current Health Status - General health condition (%)
Current Health Status - Blood donors (%)
Current Health Status - Has blood ever tested for HIV virus (%)
Current Health Status - Left-handed people (%)
Dermatology - People using sunscreen (%)
Diabetes - Diabetics (%)
Diabetes - Had a blood test for high blood sugar (%)
Diabetes - People taking insulin (%)
Diet Behavior & Nutrition - Diet health (%)
Diet Behavior & Nutrition - Milk product consumption (# of products/month)
Diet Behavior & Nutrition - Meals not home prepared (#/week)
Diet Behavior & Nutrition - Meals from fast food or pizza place (#/week)
Diet Behavior & Nutrition - Ready-to-eat foods (#/month)
Diet Behavior & Nutrition - Frozen meals/pizza (#/month)
Drug Use - People that ever used marijuana or hashish (%)
Drug Use - Ever used hard drugs (%)
Drug Use - Ever used any form of cocaine (%)
Drug Use - Ever used heroin (%)
Drug Use - Ever used methamphetamine (%)
Health Insurance - People covered by health insurance (%)
Kidney Conditions-Urology - Avg. # of times urinating at night
Medical Conditions - People with asthma (%)
Medical Conditions - People with anemia (%)
Medical Conditions - People with psoriasis (%)
Medical Conditions - People with overweight (%)
Medical Conditions - Elderly people having difficulties in thinking or remembering (%)
Medical Conditions - People who ever received blood transfusion (%)
Medical Conditions - People having trouble seeing even with glass/contacts (%)
Medical Conditions - People with arthritis (%)
Medical Conditions - People with gout (%)
Medical Conditions - People with congestive heart failure (%)
Medical Conditions - People with coronary heart disease (%)
Medical Conditions - People with angina pectoris (%)
Medical Conditions - People who ever had heart attack (%)
Medical Conditions - People who ever had stroke (%)
Medical Conditions - People with emphysema (%)
Medical Conditions - People with thyroid problem (%)
Medical Conditions - People with chronic bronchitis (%)
Medical Conditions - People with any liver condition (%)
Medical Conditions - People who ever had cancer or malignancy (%)
Mental Health - People who have little interest in doing things (%)
Mental Health - People feeling down, depressed, or hopeless (%)
Mental Health - People who have trouble sleeping or sleeping too much (%)
Mental Health - People feeling tired or having little energy (%)
Mental Health - People with poor appetite or overeating (%)
Mental Health - People feeling bad about themself (%)
Mental Health - People who have trouble concentrating on things (%)
Mental Health - People moving or speaking slowly or too fast (%)
Mental Health - People having thoughts they would be better off dead (%)
Oral Health - Average years since last visit a dentist
Oral Health - People embarrassed because of mouth (%)
Oral Health - People with gum disease (%)
Oral Health - General health of teeth and gums (%)
Oral Health - Average days a week using dental floss/device
Oral Health - Average days a week using mouthwash for dental problem
Oral Health - Average number of teeth
Pesticide Use - Households using pesticides to control insects (%)
Pesticide Use - Households using pesticides to kill weeds (%)
Physical Activity - People doing vigorous-intensity work activities (%)
Physical Activity - People doing moderate-intensity work activities (%)
Physical Activity - People walking or bicycling (%)
Physical Activity - People doing vigorous-intensity recreational activities (%)
Physical Activity - People doing moderate-intensity recreational activities (%)
Physical Activity - Average hours a day doing sedentary activities
Physical Activity - Average hours a day watching TV or videos
Physical Activity - Average hours a day using computer
Physical Functioning - People having limitations keeping them from working (%)
Physical Functioning - People limited in amount of work they can do (%)
Physical Functioning - People that need special equipment to walk (%)
Physical Functioning - People experiencing confusion/memory problems (%)
Physical Functioning - People requiring special healthcare equipment (%)
Prescription Medications - Average number of prescription medicines taking
Preventive Aspirin Use - Adults 40+ taking low-dose aspirin (%)
Reproductive Health - Vaginal deliveries (%)
Reproductive Health - Cesarean deliveries (%)
Reproductive Health - Deliveries resulted in a live birth (%)
Reproductive Health - Pregnancies resulted in a delivery (%)
Reproductive Health - Women breastfeeding newborns (%)
Reproductive Health - Women that had a hysterectomy (%)
Reproductive Health - Women that had both ovaries removed (%)
Reproductive Health - Women that have ever taken birth control pills (%)
Reproductive Health - Women taking birth control pills (%)
Reproductive Health - Women that have ever used Depo-Provera or injectables (%)
Reproductive Health - Women that have ever used female hormones (%)
Sexual Behavior - People 18+ that ever had sex (vaginal, anal, or oral) (%)
Sexual Behavior - Males 18+ that ever had vaginal sex with a woman (%)
Sexual Behavior - Males 18+ that ever performed oral sex on a woman (%)
Sexual Behavior - Males 18+ that ever had anal sex with a woman (%)
Sexual Behavior - Males 18+ that ever had any sex with a man (%)
Sexual Behavior - Females 18+ that ever had vaginal sex with a man (%)
Sexual Behavior - Females 18+ that ever performed oral sex on a man (%)
Sexual Behavior - Females 18+ that ever had anal sex with a man (%)
Sexual Behavior - Females 18+ that ever had any kind of sex with a woman (%)
Sexual Behavior - Average age people first had sex
Sexual Behavior - Average number of female sex partners in lifetime (males 18+)
Sexual Behavior - Average number of female vaginal sex partners in lifetime (males 18+)
Sexual Behavior - Average age people first performed oral sex on a woman (18+)
Sexual Behavior - Average number of woman performed oral sex on in lifetime (18+)
Sexual Behavior - Average number of male sex partners in lifetime (males 18+)
Sexual Behavior - Average number of male anal sex partners in lifetime (males 18+)
Sexual Behavior - Average age people first performed oral sex on a man (18+)
Sexual Behavior - Average number of male oral sex partners in lifetime (18+)
Sexual Behavior - People using protection when performing oral sex (%)
Sexual Behavior - Average number of times people have vaginal or anal sex a year
Sexual Behavior - People having sex without condom (%)
Sexual Behavior - Average number of male sex partners in lifetime (females 18+)
Sexual Behavior - Average number of male vaginal sex partners in lifetime (females 18+)
Sexual Behavior - Average number of female sex partners in lifetime (females 18+)
Sexual Behavior - Circumcised males 18+ (%)
Sleep Disorders - Average hours sleeping at night
Sleep Disorders - People that has trouble sleeping (%)
Smoking-Cigarette Use - People smoking cigarettes (%)
Taste & Smell - People 40+ having problems with smell (%)
Taste & Smell - People 40+ having problems with taste (%)
Taste & Smell - People 40+ that ever had wisdom teeth removed (%)
Taste & Smell - People 40+ that ever had tonsils teeth removed (%)
Taste & Smell - People 40+ that ever had a loss of consciousness because of a head injury (%)
Taste & Smell - People 40+ that ever had a broken nose or other serious injury to face or skull (%)
Taste & Smell - People 40+ that ever had two or more sinus infections (%)
Weight - Average height (inches)
Weight - Average weight (pounds)
Weight - Average BMI
Weight - People that are obese (%)
Weight - People that ever were obese (%)
Weight - People trying to lose weight (%)
Officers per 1,000 residents here:
1.75Pennsylvania average:
2.55
Latest news from Columbia, PA collected exclusively by city-data.com from local newspapers, TV, and radio stations
Columbia, PA City Guides: Ancestries: German (26.2%), American (13.3%), Irish (4.1%), English (2.8%), European (2.7%), Italian (2.4%).
Current Local Time:
Incorporated on 02/25/1814
Land area: 2.44 square miles.
Population density: 4,152 people per square mile (average).
431 residents are foreign born (2.4% Latin America , 1.2% Africa ).
This borough:
4.2%Pennsylvania:
7.3%
Median real estate property taxes paid for housing units with mortgages in 2022: $3,011 (1.7%)Median real estate property taxes paid for housing units with no mortgage in 2022: $3,133 (2.0%)
Nearest city with pop. 50,000+: Lancaster, PA
Nearest city with pop. 200,000+: Baltimore, MD
Nearest city with pop. 1,000,000+: Philadelphia, PA
Nearest cities:
Latitude: 40.03 N, Longitude: 76.50 W
Daytime population change due to commuting: -2,420 (-23.6%)Workers who live and work in this borough: 801 (15.8%)
Columbia tourist attractions:
Unemployment in December 2023: Here:
2.3%Pennsylvania:
2.9%
Most common occupations in Columbia, PA (%)
Both Males Females
Other production occupations, including supervisors (9.2%)
Laborers and material movers, hand (9.1%)
Metal workers and plastic workers (6.1%)
Building and grounds cleaning and maintenance occupations (4.8%)
Electrical equipment mechanics and other installation, maintenance, and repair workers, including supervisors (4.5%)
Material recording, scheduling, dispatching, and distributing workers (4.2%)
Cashiers (4.1%)
Laborers and material movers, hand (12.0%)
Metal workers and plastic workers (10.3%)
Other production occupations, including supervisors (9.5%)
Electrical equipment mechanics and other installation, maintenance, and repair workers, including supervisors (8.6%)
Building and grounds cleaning and maintenance occupations (5.8%)
Driver/sales workers and truck drivers (5.0%)
Vehicle and mobile equipment mechanics, installers, and repairers (3.1%)
Other production occupations, including supervisors (8.9%)
Cashiers (6.5%)
Laborers and material movers, hand (5.8%)
Material recording, scheduling, dispatching, and distributing workers (5.5%)
Secretaries and administrative assistants (5.3%)
Nursing, psychiatric, and home health aides (5.1%)
Customer service representatives (4.2%)
Tornado activity:
Columbia-area historical tornado activity is slightly above Pennsylvania state average. It is 20% greater than the overall U.S. average.
On 4/5/1952, a category F3 (max. wind speeds 158-206 mph) tornado 13.2 miles away from the Columbia borough center injured 4 people and caused between $500,000 and $5,000,000 in damages.
On 7/14/2004, a category F3 tornado 17.6 miles away from the borough center caused $18 million in damages.
Earthquake activity:
Columbia-area historical earthquake activity is significantly above Pennsylvania state average. It is 61% smaller than the overall U.S. average. On 8/23/2011 at 17:51:04, a magnitude 5.8 (5.8 MW, Depth: 3.7 mi, Class: Moderate, Intensity: VI - VII) earthquake occurred 166.0 miles away from the city center On 1/16/1994 at 01:49:16, a magnitude 4.6 (4.6 MB, 4.6 LG, Depth: 3.1 mi, Class: Light, Intensity: IV - V) earthquake occurred 31.8 miles away from Columbia center On 9/25/1998 at 19:52:52, a magnitude 5.2 (4.8 MB, 4.3 MS, 5.2 LG, 4.5 MW, Depth: 3.1 mi) earthquake occurred 227.8 miles away from Columbia center On 1/16/1994 at 00:42:43, a magnitude 4.2 (4.2 MB, 4.0 LG, Depth: 3.1 mi) earthquake occurred 32.9 miles away from the city center On 10/7/1983 at 10:18:46, a magnitude 5.3 (5.1 MB, 5.3 LG, 5.1 ML) earthquake occurred 292.8 miles away from the city center On 11/30/2017 at 21:47:31, a magnitude 4.1 (4.1 MW, Depth: 6.1 mi) earthquake occurred 81.0 miles away from Columbia center Magnitude types: regional Lg-wave magnitude (LG), body-wave magnitude (MB), local magnitude (ML), surface-wave magnitude (MS), moment magnitude (MW) Natural disasters: The number of natural disasters in Lancaster County (19) is greater than the US average (15).Major Disasters (Presidential) Declared: 14Emergencies Declared: 5Floods: 5, Storms: 5, Winter Storms: 5, Hurricanes: 3, Snowstorms: 3, Tropical Storms: 3, Blizzard: 1, Heavy Rain: 1, Mudslide: 1, Snowfall: 1, Other: 1 (Note: some incidents may be assigned to more than one category). Hospitals and medical centers in Columbia: LANCASTER GENERAL HOSPITAL SUSQUEHANNA (provides emergency services, 631 POPLAR STREET) ST ANNE'S RETIREMENT COMMUNITY (3952 COLUMBIA AVENUE)
SUSQUEHANNA VALLEY NURSING AND REHABILITATION CENTER (745 CHIQUES HILL ROAD)
Amtrak stations near Columbia: 6 miles: MOUNT JOY (DELTA & HENRY STS.) Services: public payphones, free short-term parking, call for taxi service, public transit connection.
11 miles: ELIZABETHTOWN (WILSON AVE.) Services: public payphones, free short-term parking, free long-term parking, call for taxi service.
11 miles: LANCASTER (53 MCGOVERN AVE.) Services: ticket office, partially wheelchair accessible, enclosed waiting area, public restrooms, public payphones, vending machines, ATM, paid short-term parking, paid long-term parking, call for car rental service, call for taxi service, intercity bus service, public transit connection.
Colleges/universities with over 2000 students nearest to Columbia:
Millersville University of Pennsylvania (about 8 miles; Millersville, PA ; Full-time enrollment: 7,743)
YTI Career Institute-York (about 10 miles; York, PA ; FT enrollment: 2,212)
Franklin and Marshall College (about 10 miles; Lancaster, PA ; FT enrollment: 2,585)
York College Pennsylvania (about 14 miles; York, PA ; FT enrollment: 5,140)
Pennsylvania State University-Penn State Harrisburg (about 18 miles; Middletown, PA ; FT enrollment: 3,797)
Messiah College (about 28 miles; Mechanicsburg, PA ; FT enrollment: 3,035)
Harrisburg Area Community College-Harrisburg (about 28 miles; Harrisburg, PA ; FT enrollment: 13,276)
Public high school in Columbia: COLUMBIA HS Students: 693, Location: 901 IRONVILLE PIKE, Grades: 9-12)Public elementary/middle schools in Columbia: PARK EL SCH Location: 50 S 6TH ST, Grades: KG-4)
COLUMBIA MS Location: 45 N 9TH ST, Grades: 5-8)
Private elementary/middle school in Columbia: OUR LADY OF THE ANGELS SCHOOL Students: 176, Location: 215 UNION ST, Grades: PK-8)
See full list of schools located in Columbia Library in Columbia: COLUMBIA PUBLIC LIBRARY Operating income: $122,089; Location: 24 SOUTH SIXTH ST; 26,802 books ; 30 e-books ; 932 audio materials ; 799 video materials ; 18 local licensed databases ; 41 state licensed databases ; 51 print serial subscriptions )
Birthplace of: John W. Woolley - Mormon fundamentalist leader, Stephen Atkins Swails - Union Army officer, Thomas Welsh (general) - Union Army general, Jack Kiefer - Professional golfer, Amelia Reynolds Long - Science fiction writer, John Knox MacArthur - World War I flying ace, Suzanne Westenhoefer - Comedian.
Lancaster County has a predicted average indoor radon screening level greater than 4 pCi/L (pico curies per liter) - Highest Potential Drinking water stations with addresses in Columbia and their reported violations in the past:
COLUMBIA WATER CO (Population served: 25,001, Surface water):
Past health violations:
MCL, Monthly (TCR) - In AUG-2008, Contaminant: Coliform. Follow-up actions: St Public Notif received (SEP-24-2008), St Formal NOV issued (SEP-24-2008), St Public Notif received (SEP-24-2008), St Formal NOV issued (SEP-24-2008), St Compliance achieved (OCT-22-2008)
Past monitoring violations:
Single Turbidity Exceed (Enhanced SWTR) - In SEP-2011, Contaminant: IESWTR. Follow-up actions: St Boil Water Order (NOV-01-2011), St Compliance achieved (NOV-01-2011), St Compliance Meeting conducted (NOV-01-2011)
Single Turbidity Exceed (Enhanced SWTR) - In AUG-2011, Contaminant: IESWTR. Follow-up actions: St Boil Water Order (OCT-05-2011), St Public Notif received (OCT-05-2011), St Compliance achieved (OCT-05-2011), St Violation/Reminder Notice (OCT-05-2011)
Monitoring of Treatment (SWTR-Filter) - In SEP-2009. Follow-up actions: St Compliance achieved (NOV-02-2009)
Monitoring and Reporting (DBP) - Between APR-2007 and JUN-2007, Contaminant: CARBON, TOTAL. Follow-up actions: St Compliance achieved (AUG-14-2007)
Monitoring and Reporting (DBP) - Between JUL-2006 and SEP-2006, Contaminant: CARBON, TOTAL. Follow-up actions: St Compliance achieved (OCT-25-2006)
2 other older monitoring violations
Average household size: This borough:
2.4 peoplePennsylvania:
2.5 people
Percentage of family households: This borough:
59.1%Whole state:
65.0%
Percentage of households with unmarried partners: This borough:
9.9%Whole state:
6.6%
Likely homosexual households (counted as self-reported same-sex unmarried-partner households)
Lesbian couples: 0.2% of all households Gay men: 0.2% of all households
People in group quarters in Columbia in 2010:
159 people in nursing facilities/skilled-nursing facilities
36 people in group homes intended for adults
9 people in emergency and transitional shelters (with sleeping facilities) for people experiencing homelessness
4 people in other noninstitutional facilities
People in group quarters in Columbia in 2000:
197 people in nursing homes
9 people in hospitals or wards for drug/alcohol abuse
6 people in homes for the mentally retarded
4 people in religious group quarters
3 people in homes for the mentally ill
Banks with branches in Columbia (2011 data):
Union Community Bank FSB: Columbia Branch at 921 Lancaster Avenue, branch established on 1992/10/19; Columbia Branch at 10 South 18th St, branch established on 2002/12/02. Info updated 2011/07/21: Bank assets: $533.2 mil, Deposits: $454.9 mil, headquarters in Lancaster, PA, positive income , Commercial Lending Specialization, 15 total offices
Wells Fargo Bank, National Association: Columbia Branch at 345 Locust Street, branch established on 1967/01/30. Info updated 2011/04/05: Bank assets: $1,161,490.0 mil, Deposits: $905,653.0 mil, headquarters in Sioux Falls, SD, positive income , 6395 total offices , Holding Company: Wells Fargo & Company
Susquehanna Bank: Central Savings Branch at 325 Locust Street, branch established on 1925/01/01. Info updated 2012/02/28: Bank assets: $14,849.0 mil, Deposits: $10,294.4 mil, headquarters in Lititz, PA, positive income , Commercial Lending Specialization, 308 total offices , Holding Company: Susquehanna Bancshares, Inc.
Northwest Savings Bank: Columbia Branch at 350 Locust Street, branch established on 1902/01/01. Info updated 2009/11/23: Bank assets: $7,975.9 mil, Deposits: $5,985.6 mil, headquarters in Warren, PA, positive income , Mortgage Lending Specialization, 172 total offices
For population 15 years and over in Columbia:
Never married: 35.9%Now married: 39.0%Separated: 2.3%Widowed: 7.6%Divorced: 15.2% For population 25 years and over in Columbia:
High school or higher: 82.2%Bachelor's degree or higher: 16.7%Graduate or professional degree: 4.0%Unemployed: 5.3%Mean travel time to work (commute): 24.4 minutes
Education Gini index (Inequality in education) Here:
9.7Pennsylvania average:
11.4
Religion statistics for Columbia, PA (based on Lancaster County data)
Religion Adherents Congregations Evangelical Protestant 122,957 568 Mainline Protestant 71,573 192 Catholic 51,292 20 Other 5,536 20 Black Protestant 2,163 8 Orthodox 1,600 2 None 264,324 -
Source: Clifford Grammich, Kirk Hadaway, Richard Houseal, Dale E.Jones, Alexei Krindatch, Richie Stanley and Richard H.Taylor. 2012. 2010 U.S.Religion Census: Religious Congregations & Membership Study. Association of Statisticians of American Religious Bodies. Jones, Dale E., et al. 2002. Congregations and Membership in the United States 2000. Nashville, TN: Glenmary Research Center. Graphs represent county-level data
Food Environment Statistics: Number of grocery stores : 106This county :
2.13 / 10,000 pop.State :
2.04 / 10,000 pop.
Number of supercenters and club stores : 4Lancaster County :
0.08 / 10,000 pop.Pennsylvania :
0.09 / 10,000 pop.
Number of convenience stores (no gas) : 31Here :
0.62 / 10,000 pop.Pennsylvania :
0.88 / 10,000 pop.
Number of convenience stores (with gas) : 131Lancaster County :
2.63 / 10,000 pop.Pennsylvania :
2.52 / 10,000 pop.
Number of full-service restaurants : 296Here :
5.94 / 10,000 pop.State :
7.12 / 10,000 pop.
Adult diabetes rate : Lancaster County :
8.4%Pennsylvania :
9.1%
Adult obesity rate : Lancaster County :
27.4%Pennsylvania :
27.2%
Low-income preschool obesity rate : This county :
13.1%State :
11.5%
Health and Nutrition: Healthy diet rate : Here:
50.3%Pennsylvania:
50.2%
Average overall health of teeth and gums : This city:
46.9%Pennsylvania:
47.1%
People feeling badly about themselves : Columbia:
20.0%Pennsylvania:
20.8%
People not drinking alcohol at all : This city:
11.4%Pennsylvania:
10.9%
Average hours sleeping at night : This city:
6.8Pennsylvania:
6.8
Overweight people : This city:
34.2%Pennsylvania:
34.3%
General health condition : Columbia:
56.5%Pennsylvania:
56.2%
Average condition of hearing : Columbia:
77.9%Pennsylvania:
78.3%
More about Health and Nutrition of Columbia, PA Residents
Local government employment and payroll (March 2022)
Function
Full-time employees
Monthly full-time payroll
Average yearly full-time wage
Part-time employees
Monthly part-time payroll
Police Protection - Officers
19 $157,018 $99,169 0 $0 Sewerage
7 $43,041 $73,785 0 $0 Streets and Highways
6 $39,462 $78,924 0 $0 Other Government Administration
6 $33,071 $66,142 3 $367 Police - Other
3 $14,712 $58,848 16 $20,749 Financial Administration
2 $10,244 $61,464 0 $0 Other and Unallocable
2 $12,332 $73,992 4 $9,553 Solid Waste Management
2 $12,464 $74,784 0 $0 Fire - Other
0 $0 3 $367 Judicial and Legal
0 $0 14 $2,577
Totals for Government
47 $322,344 $82,301 40 $33,613
Columbia government finances - Expenditure in 2018 (per resident):
Current Operations - Police Protection: $2,938,000 ($290.14)
Regular Highways: $2,016,000 ($199.09)General - Other: $738,000 ($72.88)Financial Administration: $503,000 ($49.67)Parks and Recreation: $474,000 ($46.81)General Public Buildings: $417,000 ($41.18)Protective Inspection and Regulation - Other: $294,000 ($29.03)Sewerage: $277,000 ($27.36)Local Fire Protection: $215,000 ($21.23)Housing and Community Development: $192,000 ($18.96)Central Staff Services: $167,000 ($16.49)Judicial and Legal Services: $123,000 ($12.15)Miscellaneous Commercial Activities - Other: $58,000 ($5.73)Libraries: $10,000 ($0.99)General - Interest on Debt: $707,000 ($69.82)
Total Salaries and Wages: $3,085,000 ($304.66)
Columbia government finances - Revenue in 2018 (per resident):
Charges - Sewerage: $741,000 ($73.18)
Other: $290,000 ($28.64)Regular Highways: $120,000 ($11.85)Parking Facilities: $73,000 ($7.21)Local Intergovernmental - Other: $816,000 ($80.58)
Miscellaneous - Sale of Property: $2,433,000 ($240.27)
Fines and Forfeits: $161,000 ($15.90)General Revenue - Other: $147,000 ($14.52)Interest Earnings: $108,000 ($10.67)Rents: $34,000 ($3.36)Donations From Private Sources: $22,000 ($2.17)Revenue - Electric Utilities: $50,000 ($4.94)
State Intergovernmental - Other: $392,000 ($38.71)
Highways: $270,000 ($26.66)General Local Government Support: $8,000 ($0.79)Tax - Property: $2,817,000 ($278.19)
Individual Income: $894,000 ($88.29)Occupation and Business License - Other: $157,000 ($15.50)Public Utility License: $137,000 ($13.53)Documentary and Stock Transfer: $132,000 ($13.04)
Columbia government finances - Debt in 2018 (per resident):
Long Term Debt - Beginning Outstanding - Unspecified Public Purpose: $9,794,000 ($967.21)
Outstanding Unspecified Public Purpose: $9,600,000 ($948.05)Retired Unspecified Public Purpose: $194,000 ($19.16)
Columbia government finances - Cash and Securities in 2018 (per resident):
Bond Funds - Cash and Securities: $14,561,000 ($1437.98)
Other Funds - Cash and Securities: $4,463,000 ($440.75)
4.04% of this county's 2021 resident taxpayers lived in other counties in 2020 ($63,382 average adjusted gross income )
Here:
4.04%Pennsylvania average:
5.27%
0.01% of residents moved from foreign countries ($104 average AGI )Lancaster County:
0.01%Pennsylvania average:
0.01%
Top counties from which taxpayers relocated into this county between 2020 and 2021:
4.16% of this county's 2020 resident taxpayers moved to other counties in 2021 ($63,657 average adjusted gross income )
Here:
4.16%Pennsylvania average:
5.44%
0.01% of residents moved to foreign countries ($74 average AGI )Lancaster County:
0.01%Pennsylvania average:
0.01%
Top counties to which taxpayers relocated from this county between 2020 and 2021:
Businesses in Columbia, PA
Name Count Name Count
Ace Hardware 1 Kmart 1 AutoZone 1 Kroger 3 Blockbuster 1 Little Caesars Pizza 1 Burger King 1 McDonald's 1 CVS 1 RadioShack 1 Comfort Inn 1 Rite Aid 1 Dairy Queen 1 Subway 2 Domino's Pizza 1 T-Mobile 1 Dunkin Donuts 1 U-Haul 1 FedEx 1 UPS 1 Ford 1 Wendy's 1 H&R Block 1
Strongest AM radio stations in Columbia:
WVZN (1580 AM; 0 kW; COLUMBIA, PA; Owner: ESFUERZO DE UNION CRISTIANA)
WLAN (1390 AM; 5 kW; LANCASTER, PA)
WSBA (910 AM; 5 kW; YORK, PA; Owner: WSBA LICO, INC.)
WCBM (680 AM; 50 kW; BALTIMORE, MD; Owner: WCBM MARYLAND, INC.)
WBAL (1090 AM; 50 kW; BALTIMORE, MD; Owner: HEARST RADIO, INC.)
WEEU (830 AM; 20 kW; READING, PA; Owner: WEEU BROADCASTING COMPANY)
WVCH (740 AM; 50 kW; CHESTER, PA; Owner: WVCH COMMUNICATIONS, INC.)
WWLG (1370 AM; 50 kW; BALTIMORE, MD; Owner: M-10 BROADCASTING, INC.)
WWJZ (640 AM; 50 kW; MOUNT HOLLY, NJ; Owner: ABC, INC.)
WGOP (700 AM; daytime; 25 kW; WALKERSVILLE, MD; Owner: BIRACH BROADCASTING CORPORATION)
WPEN (950 AM; 50 kW; PHILADELPHIA, PA; Owner: GREATER PHILADELPHIA RADIO, INC.)
WZZD (990 AM; 50 kW; PHILADELPHIA, PA; Owner: PENNSYLVANIA MEDIA ASSOCIATES, INC.)
WOYK (1350 AM; 5 kW; YORK, PA; Owner: WOYK, INC.)
Strongest FM radio stations in Columbia:
WLAN-FM (96.9 FM; LANCASTER, PA; Owner: CLEAR CHANNEL BROADCASTING LICENSES, INC.)
WARM-FM (103.3 FM; YORK, PA; Owner: WSBA LICO, INC.)
WROZ (101.3 FM; LANCASTER, PA; Owner: HALL COMMUNICATIONS, INC.)
W220BX (91.9 FM; MARIETTA, PA; Owner: CALVARY CHAPEL OF TWIN FALLS, INC.)
WSOX (96.1 FM; RED LION, PA; Owner: LANCASTER-YORK BROADCASTING, LLC)
WCAT-FM (106.7 FM; HERSHEY, PA; Owner: CITADEL BROADCASTING COMPANY)
WQXA-FM (105.7 FM; YORK, PA; Owner: CITADEL BROADCASTING COMPANY)
WHBO (92.7 FM; STARVIEW, PA; Owner: HALL COMMUNICATIONS, INC.)
WJTL (90.3 FM; LANCASTER, PA; Owner: CREATIVE MINISTRIES, INC.)
WDAC (94.5 FM; LANCASTER, PA; Owner: WDAC RADIO COMPANY)
WIOV-FM (105.1 FM; EPHRATA, PA; Owner: REGENT BROADCASTING OF LANCASTER, INC.)
WITF-FM (89.5 FM; HARRISBURG, PA; Owner: WITF, INC.)
WTPA (93.5 FM; MECHANICSBURG, PA; Owner: CUMULUS LICENSING CORP.)
WYCR (98.5 FM; YORK-HANOVER, PA; Owner: RADIO HANOVER, INC.)
WRTL (90.7 FM; EPHRATA, PA; Owner: TEMPLE UNIV OF COMMONWEALTH SYSTEM)
WGTY (107.7 FM; GETTYSBURG, PA; Owner: TIMES AND NEWS PUBLISHING COMPANY)
WRVV (97.3 FM; HARRISBURG, PA; Owner: CLEAR CHANNEL BROADCASTING LICENSES, INC.)
W259AA (99.7 FM; LANCASTER, PA; Owner: WITF, INC.)
WHKF (99.3 FM; HARRISBURG, PA; Owner: CLEAR CHANNEL BROADCASTING LICENSES, INC.)
WFNM (89.1 FM; LANCASTER, PA; Owner: FRANKLIN AND MARSHALL COLLEGE)
TV broadcast stations around Columbia:
WPMT (Channel 43; YORK, PA; Owner: TRIBUNE TELEVISION COMPANY)
WGAL (Channel 8; LANCASTER, PA; Owner: WGAL HEARST-ARGYLE TELEVISION, INC.)
WLYH-TV (Channel 15; LANCASTER, PA; Owner: TELEVISION STATION GROUP LICENSE SUBSIDIARY, LLC)
WGCB-TV (Channel 49; RED LION, PA; Owner: RED LION BROADCASTING CO., INC.)
W23AY (Channel 23; YORK, PA; Owner: WIRELESS CABLE TV OF PA, INC.)
WITF-TV (Channel 33; HARRISBURG, PA; Owner: WITF, INC.)
WMPB (Channel 67; BALTIMORE, MD; Owner: MARYLAND PUBLIC BROADCASTING COMMISSION)
WBFF (Channel 45; BALTIMORE, MD; Owner: CHESAPEAKE TELEVISION LICENSEE, LLC)
WNUV (Channel 54; BALTIMORE, MD; Owner: BALTIMORE (WNUV-TV) LICENSEE, INC.)
WHTM-TV (Channel 27; HARRISBURG, PA; Owner: HARRISBURG TELEVISION, INC.)
WHP-TV (Channel 21; HARRISBURG, PA; Owner: CLEAR CHANNEL BROADCASTING LICENSES, INC.)
Medal of Honor Recipients
Medal of Honor Recipient born in Columbia: Chester S. Furman.
National Bridge Inventory (NBI) Statistics 34 Number of bridges1,414ft / 431m Total length $36,167,000 Total costs518,928 Total average daily traffic85,596 Total average daily truck traffic
New bridges - historical statistics
1 Before 1900 1 1900-1909 3 1920-1929 1 1930-1939 1 1950-1959 1 1960-1969 20 1970-1979 2 1980-1989 1 2000-2009 3 2010-2019
See full National Bridge Inventory statistics for Columbia, PA
FCC Registered Antenna Towers: 31 (
See the full list of FCC Registered Antenna Towers in Columbia )
FCC Registered Private Land Mobile Towers: 1 (
See the full list of FCC Registered Private Land Mobile Towers in Columbia, PA )
FCC Registered Broadcast Land Mobile Towers: 21 (
See the full list of FCC Registered Broadcast Land Mobile Towers )
FCC Registered Microwave Towers: 12 (
See the full list of FCC Registered Microwave Towers in this town )
FCC Registered Paging Towers: 3 (
See the full list of FCC Registered Paging Towers )
FCC Registered Amateur Radio Licenses: 57 (
See the full list of FCC Registered Amateur Radio Licenses in Columbia )
FAA Registered Aircraft: 6
Aircraft: DJI PHANTOM 3 ADVANCED (Category: Land, Engines: 4), Engine: ElectricN-Number: 769BF, N769BF, N-769BF, Serial Number: P76DCH05011476, Certificate Issue Date: 09/06/2016Registrant (LLC): Land Grant Surveyors LLC, 3904 Abel Dr, Columbia, PA 17512Aircraft: CESSNA 340A (Category: Land, Engines: 2, Seats: 6, Weight: Up to 12,499 Pounds, Speed: 90 mph), Engine: ReciprocatingN-Number: 800BC, N800BC, N-800BC, Serial Number: 340A0232, Airworthiness Date: 01/18/1977, Certificate Issue Date: 05/27/2015Registrant (LLC): N800bc LLC, 2372 Franklin Rd, Columbia, PA 17512Aircraft: AERONCA 7AC (Category: Land, Seats: 2, Weight: Up to 12,499 Pounds, Speed: 90 mph), Engine: CONT MOTOR A&C65 SERIES (65 HP) (Reciprocating)N-Number: 82773, N82773, N-82773, Serial Number: 7AC-1420, Year manufactured: 1946, Airworthiness Date: 08/13/2019, Certificate Issue Date: 02/24/2020Registrant (Individual): Sheldon L Horst, 2674 Hemlock Dr, Columbia, PA 17512Aircraft: DJI PHANTOM 2 VISION + (Category: Land, Engines: 4), Engine: ElectricN-Number: 703AQ, N703AQ, N-703AQ, Serial Number: PH645514164, Certificate Issue Date: 07/19/2016Registrant (LLC): Land Grant Surveyors LLC, 3904 Abel Dr, Columbia, PA 17512Deregistered: Cancel Date: 11/04/2019Aircraft: TAYLORCRAFT BF (Category: Land, Seats: 2, Weight: Up to 12,499 Pounds, Speed: 78 mph), Engine: CONT MOTOR A&C65 SERIES (65 HP) (Reciprocating)N-Number: 95023, N95023, N-95023, Serial Number: 9423, Year manufactured: 1946Registrant (Partnership): Aero Club Inc Columbia, 254 N 9th St, Columbia, PA 17512Deregistered: Cancel Date: 02/28/2019Aircraft: PIPER PA-38-112 (Category: Land, Seats: 2, Weight: Up to 12,499 Pounds, Speed: 183 mph), Engine: LYCOMING 0-235 SERIES (115 HP) (4 Cycle)N-Number: 2508T, N2508T, N-2508T, Serial Number: 38-78A0819, Year manufactured: 1978, Airworthiness Date: 01/05/1979, Certificate Issue Date: 06/01/2006Registrant (Individual): Jeffery C Hess, 1470 Habecker Rd, Columbia, PA 17512Deregistered: Cancel Date: 05/23/2017
Home Mortgage Disclosure Act Aggregated Statistics For Year 2009(Based on 3 full tracts) A) FHA, FSA/RHS & VA B) Conventional C) Refinancings D) Home Improvement Loans E) Loans on Dwellings For 5+ Families F) Non-occupant Loans on G) Loans On Manufactured Number Average Value Number Average Value Number Average Value Number Average Value Number Average Value Number Average Value Number Average Value
LOANS ORIGINATED 69 $100,087 36 $76,389 125 $98,328 19 $53,737 2 $157,000 30 $65,467 0 $0 APPLICATIONS APPROVED, NOT ACCEPTED 7 $97,286 2 $90,500 7 $96,286 3 $8,000 0 $0 0 $0 1 $87,000 APPLICATIONS DENIED 9 $98,333 9 $71,889 54 $104,852 17 $30,588 1 $10,000 12 $50,750 1 $57,000 APPLICATIONS WITHDRAWN 3 $88,000 2 $74,000 44 $111,955 4 $36,250 0 $0 3 $56,000 1 $30,000 FILES CLOSED FOR INCOMPLETENESS 3 $117,000 0 $0 5 $114,200 0 $0 0 $0 1 $97,000 0 $0
Aggregated Statistics For Year 2008(Based on 3 full tracts) A) FHA, FSA/RHS & VA B) Conventional C) Refinancings D) Home Improvement Loans E) Loans on Dwellings For 5+ Families F) Non-occupant Loans on G) Loans On Manufactured Number Average Value Number Average Value Number Average Value Number Average Value Number Average Value Number Average Value Number Average Value
LOANS ORIGINATED 56 $96,482 68 $83,221 119 $82,706 34 $20,824 2 $144,500 45 $70,978 0 $0 APPLICATIONS APPROVED, NOT ACCEPTED 5 $87,600 3 $42,000 15 $72,267 5 $19,600 0 $0 5 $58,600 2 $29,000 APPLICATIONS DENIED 8 $102,750 14 $71,571 123 $95,984 52 $56,558 1 $15,000 19 $60,263 2 $156,000 APPLICATIONS WITHDRAWN 2 $110,500 9 $78,222 45 $122,933 3 $90,667 0 $0 8 $74,625 0 $0 FILES CLOSED FOR INCOMPLETENESS 1 $51,000 1 $65,000 9 $111,333 1 $14,000 0 $0 1 $128,000 0 $0
Aggregated Statistics For Year 2007(Based on 3 full tracts) A) FHA, FSA/RHS & VA B) Conventional C) Refinancings D) Home Improvement Loans E) Loans on Dwellings For 5+ Families F) Non-occupant Loans on G) Loans On Manufactured Number Average Value Number Average Value Number Average Value Number Average Value Number Average Value Number Average Value Number Average Value
LOANS ORIGINATED 43 $90,558 130 $84,754 130 $76,831 26 $30,615 4 $113,250 40 $70,400 2 $95,500 APPLICATIONS APPROVED, NOT ACCEPTED 0 $0 8 $84,875 25 $88,360 6 $38,000 0 $0 4 $53,750 0 $0 APPLICATIONS DENIED 3 $77,667 18 $64,556 171 $92,333 51 $55,412 1 $50,000 15 $59,800 5 $51,400 APPLICATIONS WITHDRAWN 3 $140,667 15 $98,067 70 $101,200 5 $88,200 0 $0 6 $68,833 0 $0 FILES CLOSED FOR INCOMPLETENESS 0 $0 7 $69,857 20 $85,850 2 $47,500 0 $0 2 $102,500 0 $0
Aggregated Statistics For Year 2006(Based on 3 full tracts) A) FHA, FSA/RHS & VA B) Conventional C) Refinancings D) Home Improvement Loans E) Loans on Dwellings For 5+ Families F) Non-occupant Loans on G) Loans On Manufactured Number Average Value Number Average Value Number Average Value Number Average Value Number Average Value Number Average Value Number Average Value
LOANS ORIGINATED 44 $94,977 157 $72,975 156 $76,385 66 $30,909 1 $719,000 50 $60,640 3 $51,333 APPLICATIONS APPROVED, NOT ACCEPTED 1 $145,000 11 $75,182 37 $99,730 9 $20,889 0 $0 4 $62,250 0 $0 APPLICATIONS DENIED 5 $93,400 36 $62,639 185 $90,443 48 $30,792 0 $0 18 $56,611 2 $17,000 APPLICATIONS WITHDRAWN 3 $90,000 15 $75,467 90 $95,222 4 $39,500 0 $0 9 $61,444 0 $0 FILES CLOSED FOR INCOMPLETENESS 0 $0 3 $86,000 15 $81,667 0 $0 0 $0 2 $57,000 0 $0
Aggregated Statistics For Year 2005(Based on 3 full tracts) A) FHA, FSA/RHS & VA B) Conventional C) Refinancings D) Home Improvement Loans E) Loans on Dwellings For 5+ Families F) Non-occupant Loans on G) Loans On Manufactured Number Average Value Number Average Value Number Average Value Number Average Value Number Average Value Number Average Value Number Average Value
LOANS ORIGINATED 40 $92,925 181 $65,685 193 $67,891 54 $38,185 4 $156,750 56 $67,643 2 $92,500 APPLICATIONS APPROVED, NOT ACCEPTED 0 $0 15 $71,600 35 $75,343 3 $64,333 0 $0 5 $50,200 2 $48,500 APPLICATIONS DENIED 4 $72,000 45 $53,378 250 $84,432 61 $38,262 0 $0 9 $58,333 6 $17,667 APPLICATIONS WITHDRAWN 2 $136,500 18 $64,278 150 $91,507 18 $110,722 2 $398,500 11 $68,182 0 $0 FILES CLOSED FOR INCOMPLETENESS 1 $123,000 5 $65,400 16 $81,188 2 $67,500 0 $0 2 $41,500 1 $25,000
Aggregated Statistics For Year 2004(Based on 3 full tracts) A) FHA, FSA/RHS & VA B) Conventional C) Refinancings D) Home Improvement Loans E) Loans on Dwellings For 5+ Families F) Non-occupant Loans on G) Loans On Manufactured Number Average Value Number Average Value Number Average Value Number Average Value Number Average Value Number Average Value Number Average Value
LOANS ORIGINATED 49 $73,939 122 $73,705 221 $71,923 44 $26,250 3 $188,667 56 $63,286 0 $0 APPLICATIONS APPROVED, NOT ACCEPTED 2 $103,500 16 $75,625 35 $71,429 3 $30,667 0 $0 5 $63,400 1 $10,000 APPLICATIONS DENIED 4 $65,500 33 $85,576 272 $80,136 40 $32,850 0 $0 10 $61,800 3 $64,333 APPLICATIONS WITHDRAWN 4 $88,250 16 $70,562 143 $83,678 8 $51,875 0 $0 11 $80,364 0 $0 FILES CLOSED FOR INCOMPLETENESS 2 $118,000 6 $67,000 18 $95,389 2 $17,500 0 $0 1 $58,000 0 $0
Aggregated Statistics For Year 2003(Based on 3 full tracts) A) FHA, FSA/RHS & VA B) Conventional C) Refinancings D) Home Improvement Loans E) Loans on Dwellings For 5+ Families F) Non-occupant Loans on Number Average Value Number Average Value Number Average Value Number Average Value Number Average Value Number Average Value
LOANS ORIGINATED 57 $79,105 83 $71,446 293 $76,618 27 $27,148 2 $364,500 38 $67,474 APPLICATIONS APPROVED, NOT ACCEPTED 1 $124,000 8 $54,250 52 $76,019 6 $39,500 0 $0 8 $50,125 APPLICATIONS DENIED 10 $66,100 24 $67,542 226 $70,000 30 $18,233 2 $82,500 17 $50,294 APPLICATIONS WITHDRAWN 4 $50,500 10 $74,500 129 $80,240 0 $0 0 $0 2 $73,000 FILES CLOSED FOR INCOMPLETENESS 0 $0 4 $64,250 11 $77,455 1 $110,000 0 $0 1 $50,000
Aggregated Statistics For Year 2002(Based on 3 full tracts) A) FHA, FSA/RHS & VA B) Conventional C) Refinancings D) Home Improvement Loans E) Loans on Dwellings For 5+ Families F) Non-occupant Loans on Number Average Value Number Average Value Number Average Value Number Average Value Number Average Value Number Average Value
LOANS ORIGINATED 81 $84,284 105 $66,343 187 $67,176 50 $21,560 1 $131,000 43 $58,953 APPLICATIONS APPROVED, NOT ACCEPTED 3 $66,667 10 $91,300 41 $62,829 7 $37,429 0 $0 6 $104,667 APPLICATIONS DENIED 4 $90,250 27 $67,000 172 $64,442 25 $15,800 1 $72,000 5 $60,000 APPLICATIONS WITHDRAWN 3 $57,667 5 $47,800 108 $69,065 4 $22,500 0 $0 3 $44,667 FILES CLOSED FOR INCOMPLETENESS 2 $84,000 3 $55,333 13 $60,769 1 $32,000 0 $0 1 $36,000
Aggregated Statistics For Year 2001(Based on 3 full tracts) A) FHA, FSA/RHS & VA B) Conventional C) Refinancings D) Home Improvement Loans E) Loans on Dwellings For 5+ Families F) Non-occupant Loans on Number Average Value Number Average Value Number Average Value Number Average Value Number Average Value Number Average Value
LOANS ORIGINATED 70 $71,800 84 $69,798 151 $68,344 51 $22,353 4 $122,000 33 $51,758 APPLICATIONS APPROVED, NOT ACCEPTED 1 $78,000 10 $104,300 26 $68,231 10 $19,500 0 $0 1 $60,000 APPLICATIONS DENIED 2 $69,500 17 $49,941 164 $60,524 30 $20,367 0 $0 6 $72,500 APPLICATIONS WITHDRAWN 2 $96,000 5 $45,000 75 $63,613 7 $21,143 0 $0 2 $42,000 FILES CLOSED FOR INCOMPLETENESS 1 $68,000 0 $0 8 $70,250 0 $0 0 $0 0 $0
Aggregated Statistics For Year 2000(Based on 3 full tracts) A) FHA, FSA/RHS & VA B) Conventional C) Refinancings D) Home Improvement Loans E) Loans on Dwellings For 5+ Families F) Non-occupant Loans on Number Average Value Number Average Value Number Average Value Number Average Value Number Average Value Number Average Value
LOANS ORIGINATED 70 $67,457 69 $61,913 75 $53,187 57 $16,719 1 $90,000 28 $53,857 APPLICATIONS APPROVED, NOT ACCEPTED 2 $64,500 4 $28,500 29 $59,345 14 $19,071 0 $0 3 $89,333 APPLICATIONS DENIED 5 $70,800 31 $51,194 134 $55,246 38 $18,711 0 $0 5 $35,400 APPLICATIONS WITHDRAWN 4 $65,000 10 $65,200 71 $56,296 6 $23,333 0 $0 0 $0 FILES CLOSED FOR INCOMPLETENESS 1 $45,000 0 $0 21 $63,952 0 $0 0 $0 3 $54,000
Aggregated Statistics For Year 1999(Based on 4 full tracts) A) FHA, FSA/RHS & VA B) Conventional C) Refinancings D) Home Improvement Loans E) Loans on Dwellings For 5+ Families F) Non-occupant Loans on Number Average Value Number Average Value Number Average Value Number Average Value Number Average Value Number Average Value
LOANS ORIGINATED 90 $84,261 103 $73,720 285 $58,866 78 $17,078 4 $163,025 26 $42,417 APPLICATIONS APPROVED, NOT ACCEPTED 2 $75,185 15 $62,253 81 $60,523 12 $14,478 0 $0 4 $47,865 APPLICATIONS DENIED 11 $59,487 38 $53,988 167 $57,203 48 $16,105 0 $0 13 $44,922 APPLICATIONS WITHDRAWN 7 $71,303 19 $63,437 118 $68,378 13 $44,108 1 $340,000 6 $44,620 FILES CLOSED FOR INCOMPLETENESS 0 $0 1 $45,650 27 $66,823 0 $0 0 $0 0 $0
Detailed HMDA statistics for the following Tracts:
0112.00
, 0113.00 , 0114.00
Private Mortgage Insurance Companies Aggregated Statistics For Year 2009(Based on 2 full tracts) A) Conventional B) Refinancings Number Average Value Number Average Value
LOANS ORIGINATED 2 $78,000 1 $105,000 APPLICATIONS APPROVED, NOT ACCEPTED 1 $126,000 0 $0 APPLICATIONS DENIED 0 $0 0 $0 APPLICATIONS WITHDRAWN 0 $0 0 $0 FILES CLOSED FOR INCOMPLETENESS 0 $0 0 $0
Aggregated Statistics For Year 2008(Based on 3 full tracts) A) Conventional B) Refinancings C) Non-occupant Loans on Number Average Value Number Average Value Number Average Value
LOANS ORIGINATED 22 $97,227 6 $100,000 4 $59,750 APPLICATIONS APPROVED, NOT ACCEPTED 7 $112,143 5 $124,600 1 $42,000 APPLICATIONS DENIED 2 $126,000 0 $0 0 $0 APPLICATIONS WITHDRAWN 0 $0 0 $0 0 $0 FILES CLOSED FOR INCOMPLETENESS 0 $0 0 $0 0 $0
Aggregated Statistics For Year 2007(Based on 3 full tracts) A) Conventional B) Refinancings C) Non-occupant Loans on Number Average Value Number Average Value Number Average Value
LOANS ORIGINATED 63 $93,302 7 $112,286 5 $68,400 APPLICATIONS APPROVED, NOT ACCEPTED 2 $67,000 2 $94,000 0 $0 APPLICATIONS DENIED 1 $42,000 0 $0 1 $42,000 APPLICATIONS WITHDRAWN 2 $66,000 2 $106,000 1 $58,000 FILES CLOSED FOR INCOMPLETENESS 1 $152,000 0 $0 0 $0
Aggregated Statistics For Year 2006(Based on 3 full tracts) A) Conventional B) Refinancings C) Non-occupant Loans on Number Average Value Number Average Value Number Average Value
LOANS ORIGINATED 54 $82,352 9 $87,667 10 $62,700 APPLICATIONS APPROVED, NOT ACCEPTED 4 $87,250 2 $135,500 0 $0 APPLICATIONS DENIED 2 $94,500 0 $0 1 $83,000 APPLICATIONS WITHDRAWN 1 $70,000 1 $170,000 0 $0 FILES CLOSED FOR INCOMPLETENESS 0 $0 1 $170,000 0 $0
Aggregated Statistics For Year 2005(Based on 3 full tracts) A) Conventional B) Refinancings C) Non-occupant Loans on Number Average Value Number Average Value Number Average Value
LOANS ORIGINATED 43 $70,953 8 $93,000 8 $43,250 APPLICATIONS APPROVED, NOT ACCEPTED 5 $70,000 1 $104,000 0 $0 APPLICATIONS DENIED 1 $76,000 0 $0 1 $76,000 APPLICATIONS WITHDRAWN 0 $0 2 $72,500 0 $0 FILES CLOSED FOR INCOMPLETENESS 0 $0 1 $75,000 0 $0
Aggregated Statistics For Year 2004(Based on 3 full tracts) A) Conventional B) Refinancings C) Non-occupant Loans on Number Average Value Number Average Value Number Average Value
LOANS ORIGINATED 38 $80,921 10 $89,400 10 $50,500 APPLICATIONS APPROVED, NOT ACCEPTED 4 $54,500 8 $108,000 1 $34,000 APPLICATIONS DENIED 0 $0 0 $0 0 $0 APPLICATIONS WITHDRAWN 2 $58,000 5 $107,800 0 $0 FILES CLOSED FOR INCOMPLETENESS 0 $0 0 $0 0 $0
Aggregated Statistics For Year 2003(Based on 3 full tracts) A) Conventional B) Refinancings C) Non-occupant Loans on Number Average Value Number Average Value Number Average Value
LOANS ORIGINATED 33 $68,485 38 $85,895 6 $39,833 APPLICATIONS APPROVED, NOT ACCEPTED 2 $71,000 7 $62,571 0 $0 APPLICATIONS DENIED 1 $53,000 1 $72,000 1 $53,000 APPLICATIONS WITHDRAWN 0 $0 2 $68,000 0 $0 FILES CLOSED FOR INCOMPLETENESS 0 $0 2 $70,000 0 $0
Aggregated Statistics For Year 2002(Based on 3 full tracts) A) Conventional B) Refinancings C) Non-occupant Loans on Number Average Value Number Average Value Number Average Value
LOANS ORIGINATED 24 $73,792 16 $76,688 3 $66,333 APPLICATIONS APPROVED, NOT ACCEPTED 7 $114,429 3 $108,333 1 $81,000 APPLICATIONS DENIED 5 $57,600 0 $0 2 $64,000 APPLICATIONS WITHDRAWN 2 $127,500 4 $65,250 0 $0 FILES CLOSED FOR INCOMPLETENESS 1 $61,000 0 $0 0 $0
Aggregated Statistics For Year 2001(Based on 3 full tracts) A) Conventional B) Refinancings C) Non-occupant Loans on Number Average Value Number Average Value Number Average Value
LOANS ORIGINATED 27 $72,148 11 $83,727 1 $30,000 APPLICATIONS APPROVED, NOT ACCEPTED 2 $78,500 6 $89,667 1 $55,000 APPLICATIONS DENIED 1 $32,000 0 $0 1 $32,000 APPLICATIONS WITHDRAWN 1 $54,000 0 $0 0 $0 FILES CLOSED FOR INCOMPLETENESS 0 $0 0 $0 0 $0
Aggregated Statistics For Year 2000(Based on 3 full tracts) A) Conventional B) Refinancings C) Non-occupant Loans on Number Average Value Number Average Value Number Average Value
LOANS ORIGINATED 17 $93,647 8 $61,000 2 $47,000 APPLICATIONS APPROVED, NOT ACCEPTED 3 $57,333 1 $160,000 0 $0 APPLICATIONS DENIED 0 $0 0 $0 0 $0 APPLICATIONS WITHDRAWN 0 $0 0 $0 0 $0 FILES CLOSED FOR INCOMPLETENESS 0 $0 1 $94,000 0 $0
Aggregated Statistics For Year 1999(Based on 4 full tracts) A) Conventional B) Refinancings C) Non-occupant Loans on Number Average Value Number Average Value Number Average Value
LOANS ORIGINATED 50 $101,203 28 $90,424 1 $63,720 APPLICATIONS APPROVED, NOT ACCEPTED 2 $69,150 0 $0 0 $0 APPLICATIONS DENIED 9 $84,892 2 $109,535 1 $23,940 APPLICATIONS WITHDRAWN 0 $0 0 $0 0 $0 FILES CLOSED FOR INCOMPLETENESS 0 $0 0 $0 0 $0
Detailed PMIC statistics for the following Tracts:
0112.00
, 0113.00 , 0114.00
Most common first names in Columbia, PA among deceased individuals Name Count Lived (average)
Mary 235 81.3 years John 232 75.2 years William 179 74.9 years Anna 172 83.3 years Charles 168 73.0 years Robert 120 71.2 years Margaret 118 80.6 years George 110 74.7 years James 101 71.8 years Elizabeth 99 81.7 years
Most common last names in Columbia, PA among deceased individuals Last name Count Lived (average)
Smith 101 72.4 years Miller 56 78.2 years Kauffman 49 73.5 years Myers 48 76.6 years Kline 35 77.6 years Snyder 30 80.8 years Musser 30 79.9 years Jones 29 75.6 years Gable 28 79.5 years Moore 28 74.3 years
Columbia compared to Pennsylvania state average:
Unemployed percentage below state average. Black race population percentage below state average. Hispanic race population percentage above state average. Foreign-born population percentage below state average. Length of stay since moving in significantly above state average. House age above state average. Number of college students below state average.
#30 on the list of "Top 101 cities with the most residents born in Egypt (population 500+)"
#52 on the list of "Top 101 cities with largest percentage of females in occupations: material moving occupations (population 5,000+)"
#64 on the list of "Top 101 cities with the most residents born in Northern Africa (population 500+)"
#98 on the list of "Top 101 cities with the largest percentage of people in dormitories (population 1,000+)"
#98 on the list of "Top 101 cities with the largest percentage of people in group homes (population 1,000+)"
#98 on the list of "Top 101 cities with the largest percentage of people in hospitals/wards, hospices, and schools for the handicapped (population 1,000+)"
#98 on the list of "Top 101 cities with the largest percentage of people in long-term care (population 1,000+)"
#98 on the list of "Top 101 cities with the largest percentage of people in military quarters (population 1,000+)"
#98 on the list of "Top 101 cities with the largest percentage of people in noninstitutionalized settings (population 1,000+)"
#98 on the list of "Top 101 cities with the largest percentage of people in on base quarters (population 1,000+)"
#98 on the list of "Top 101 cities with the largest percentage of people in schools, hospitals, or wards for the physically handicapped (population 1,000+)"
#10 on the list of "Top 101 counties with the lowest percentage of residents relocating to other counties in 2011"
#14 on the list of "Top 101 counties with the lowest percentage of residents relocating from other counties between 2010 and 2011 (pop. 50,000+)"
#21 on the list of "Top 101 counties with the most Evangelical Protestant congregations"
#24 on the list of "Top 101 counties with the most Mainline Protestant congregations"
#25 on the list of "Top 101 counties with the highest Particulate Matter (PM2.5 ) Annual air pollution readings in 2012 (µg/m3 )"
Top Patent Applicants
Richard James Long (15)
William Brian Griffin (5)
Sheldon Lynn Horst (4)
Harold J. Dubensky (4)
Peter Werner (4)
Heath E. Harrington (4)
Michael T. Pham (3)
Ian Joseph Derstler (3)
Andrew Paul Strube (3)
Charles H. Hines (2)
Total of 74 patent applications in 2008-2024.
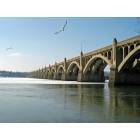


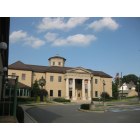

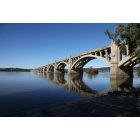

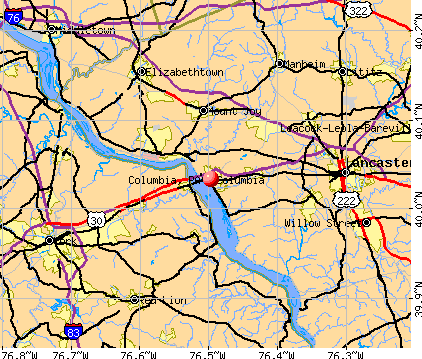


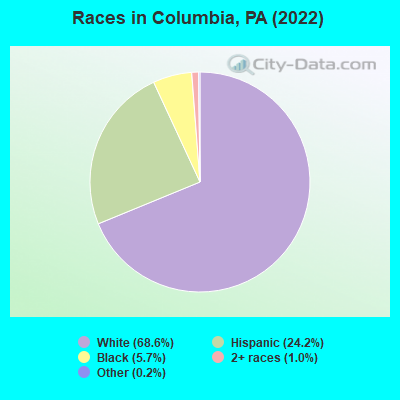
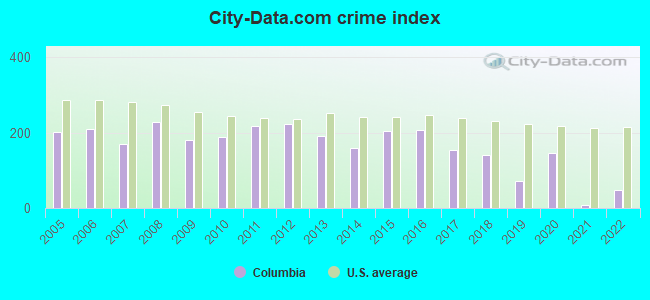
 Recent articles from our blog. Our writers, many of them Ph.D. graduates or candidates, create easy-to-read articles on a wide variety of topics.

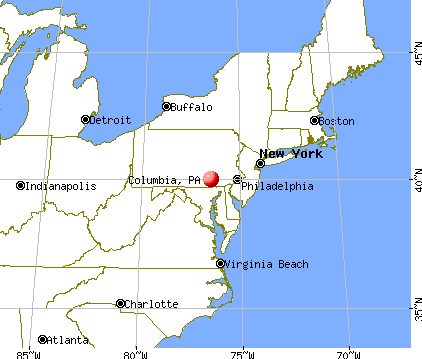
 (10.2 miles
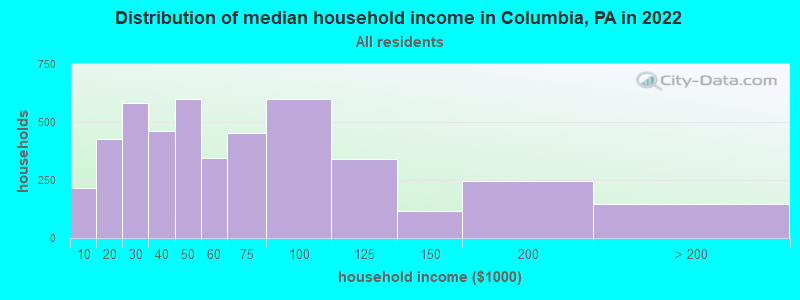
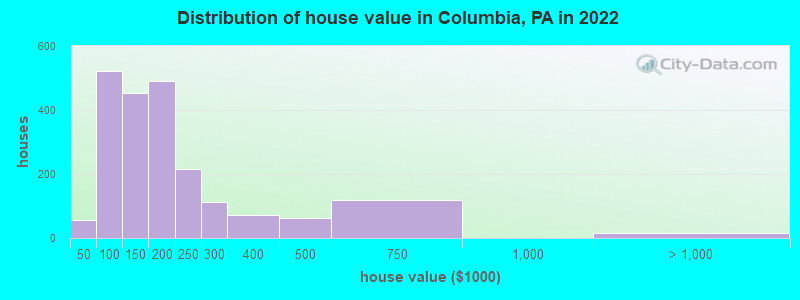

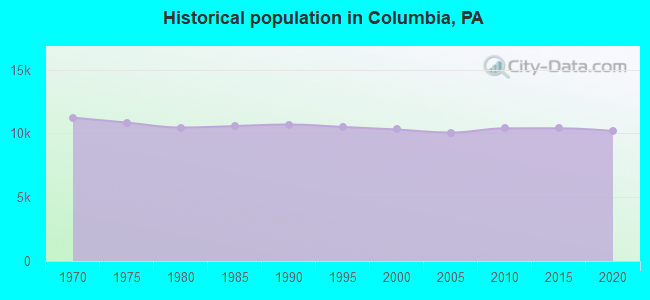
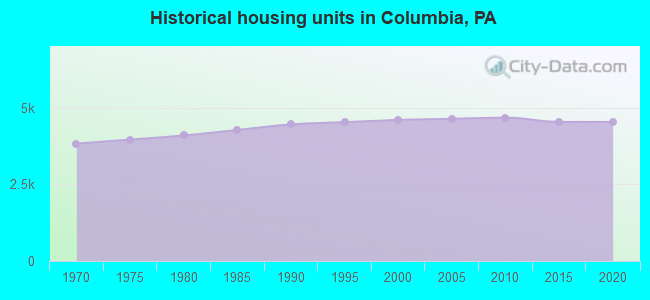
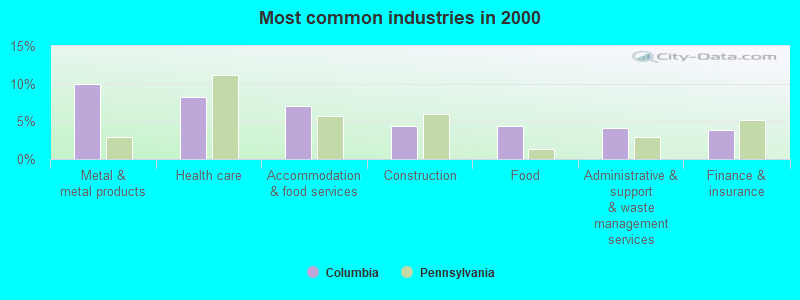
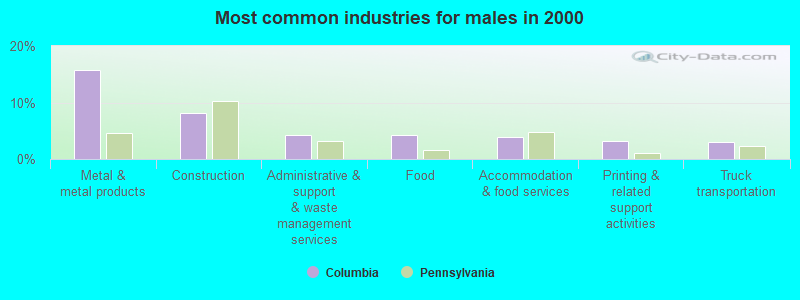
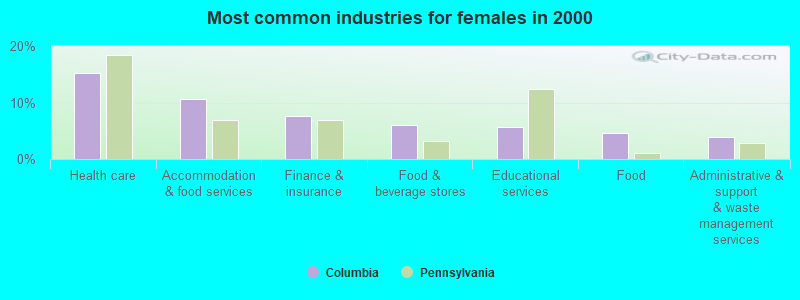
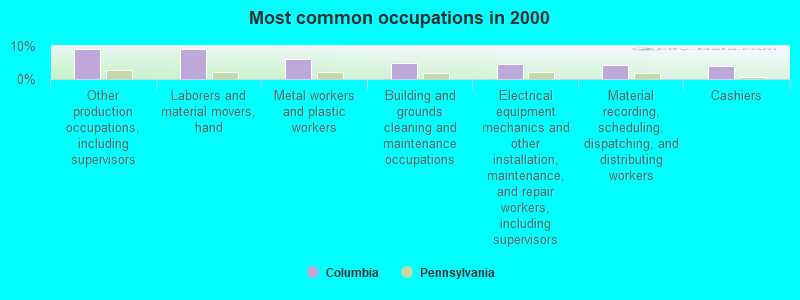
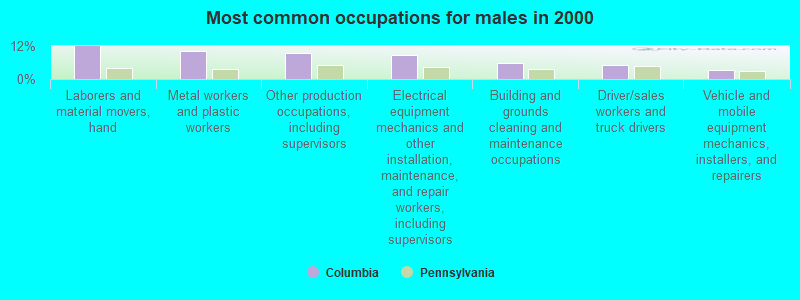
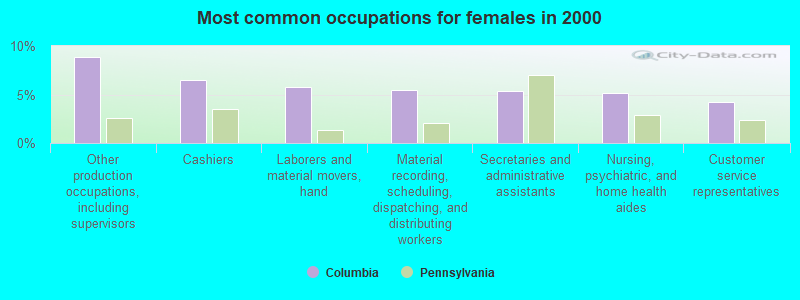


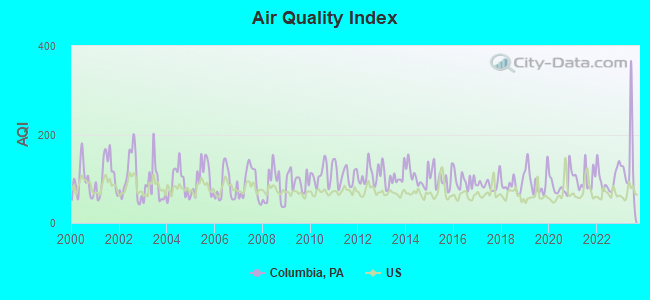
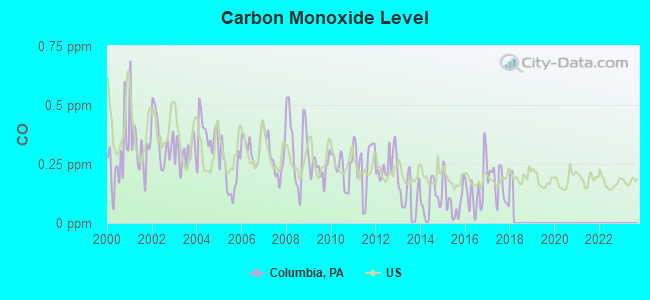
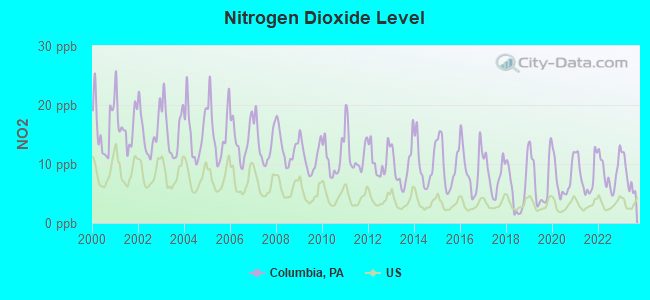
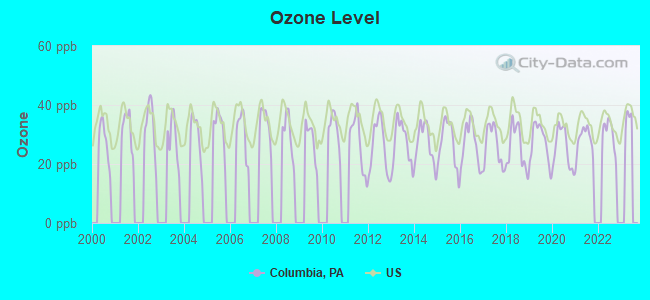
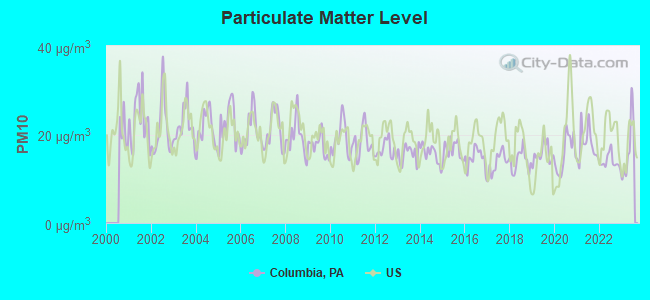
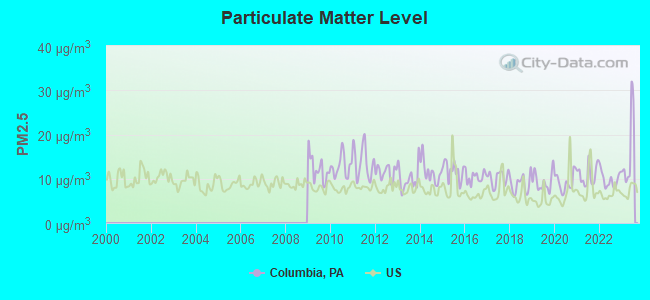
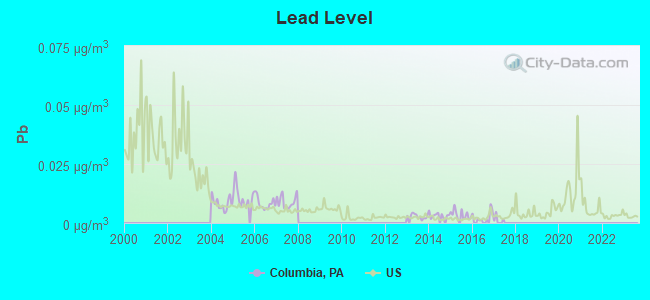

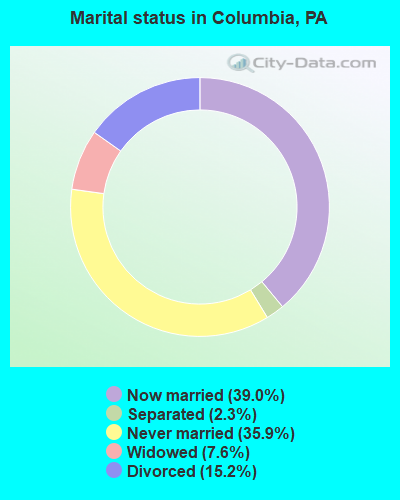
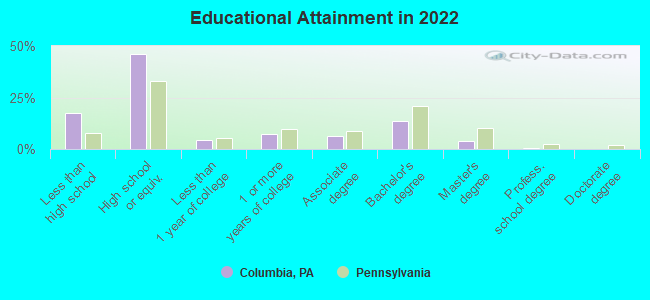
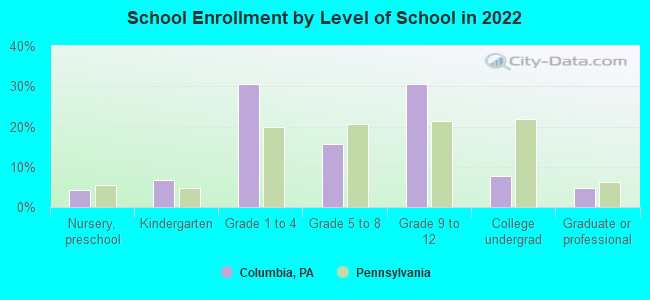
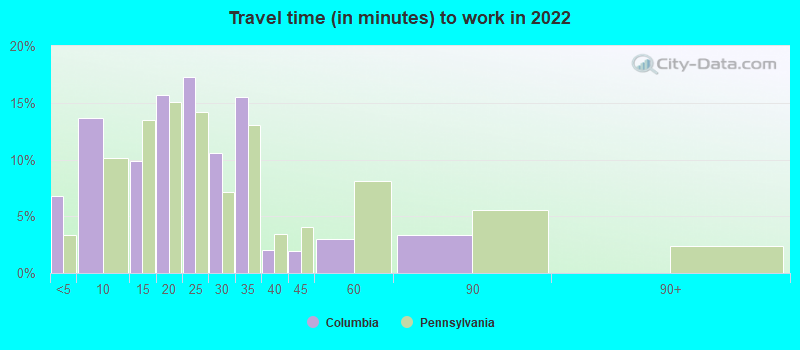
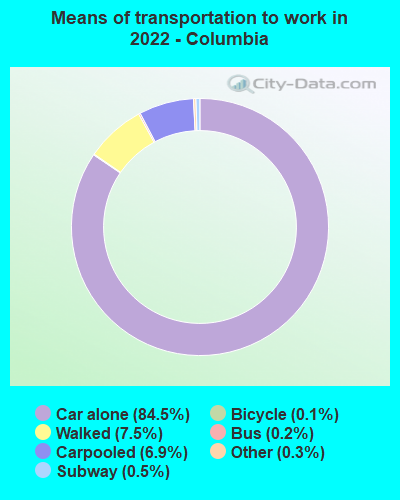
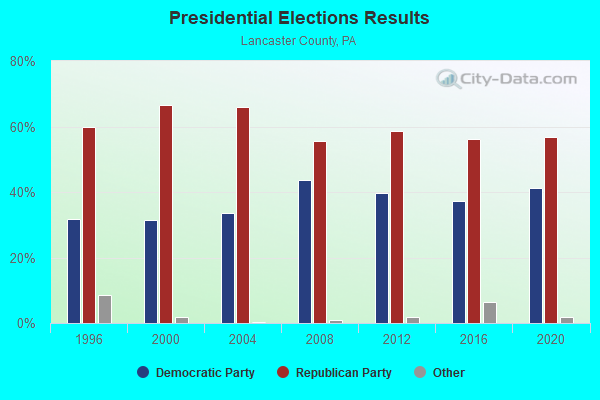
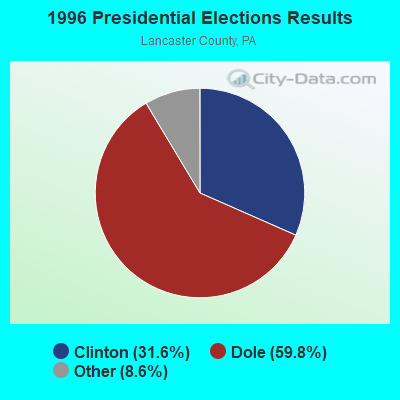
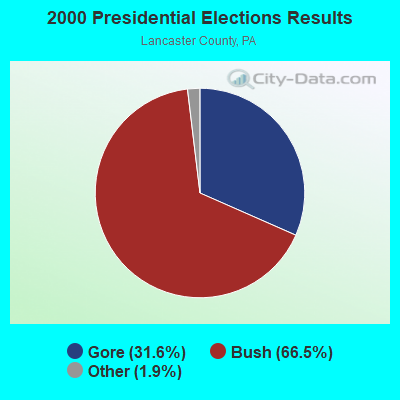
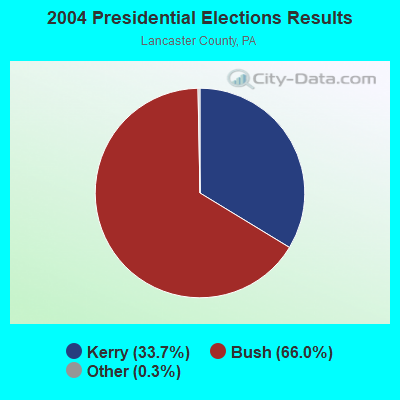
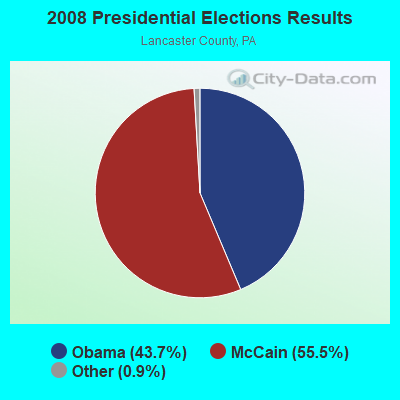
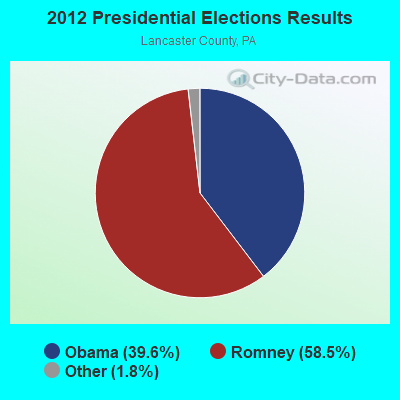
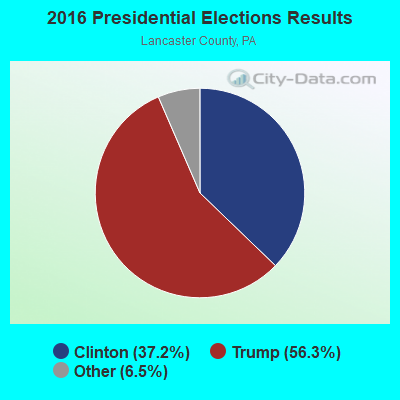
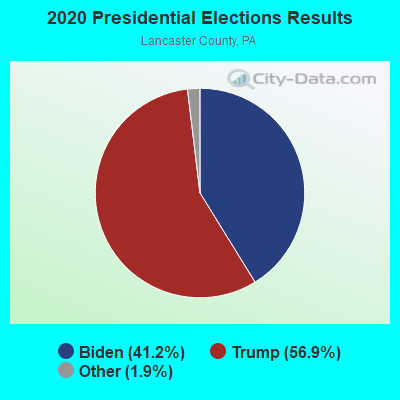
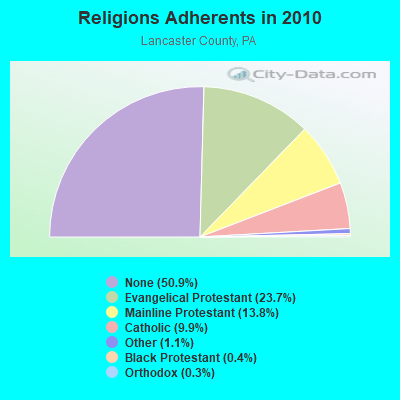
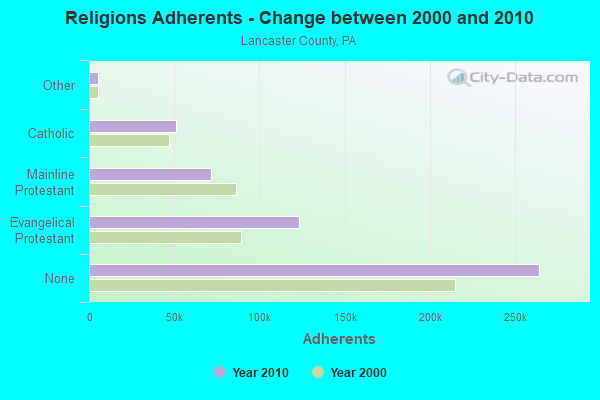
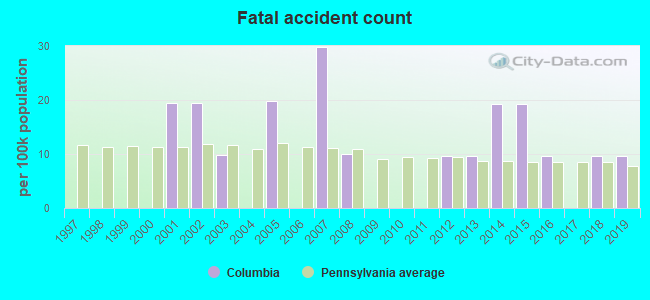
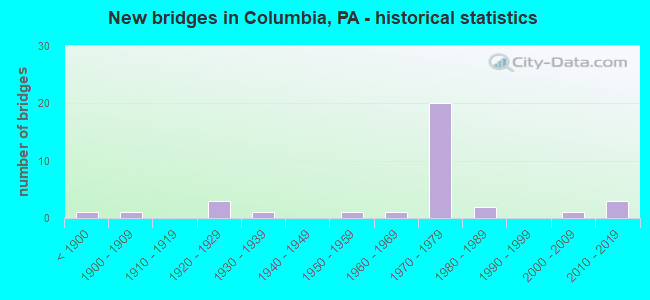
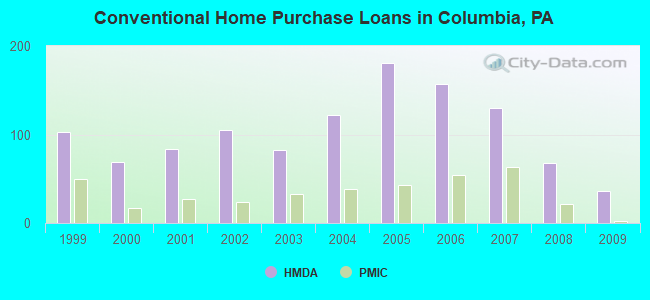
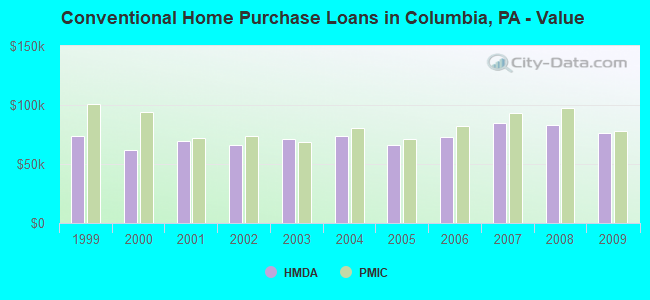
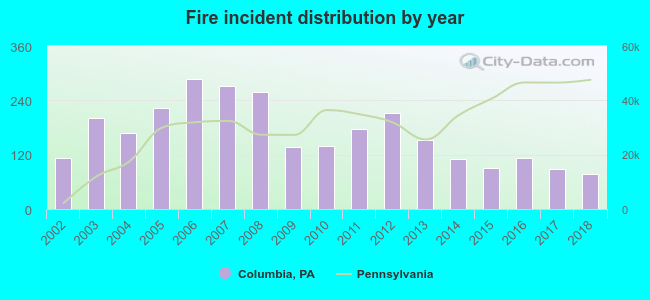 According to the data from the years 2002 - 2018 the average number of fires per year is 166. The highest number of reported fire incidents - 288 took place in 2006, and the least - 78 in 2018. The data has a decreasing trend.
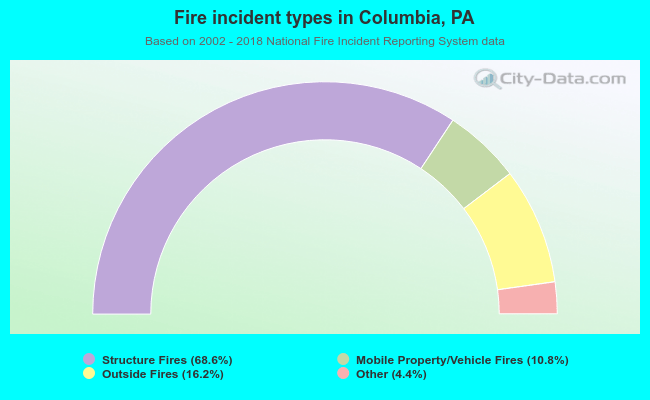 When looking into fire subcategories, the most incidents belonged to: Structure Fires (68.6%), and Outside Fires (16.2%).