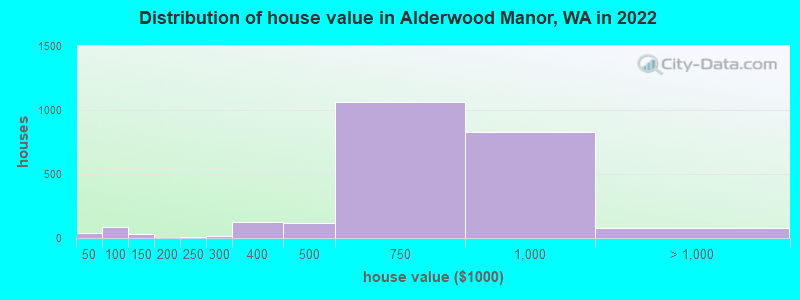
Estimated median house or condo value in 2022: $749,413 (it was $187,000 in 2000)
Alderwood Manor:
$749,413
WA:
$569,500
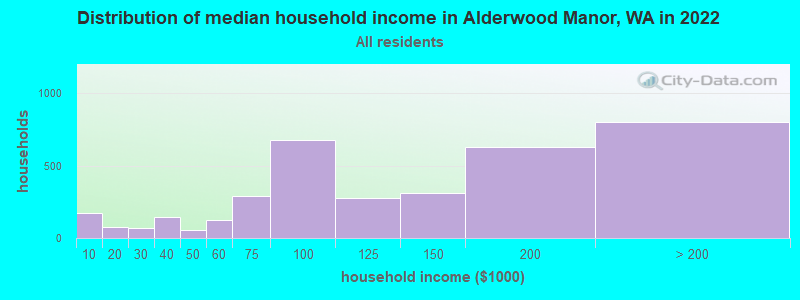
Mean prices in 2022:all housing units: $703,189; detached houses: $751,430; townhouses or other attached units: $612,607; in 5-or-more-unit structures: $616,325; mobile homes: $108,140
Median gross rent in 2022: $1,965.
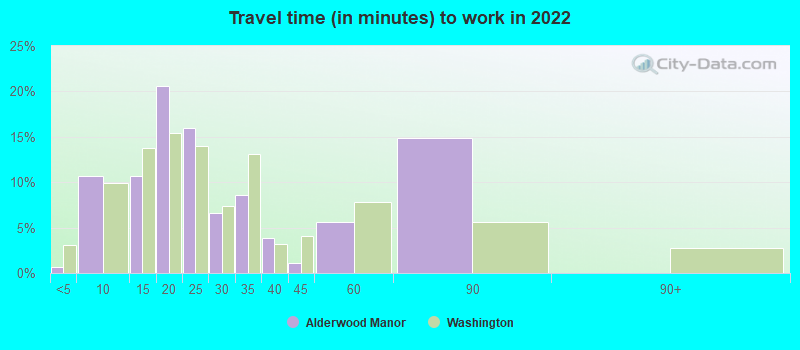
March 2022 cost of living index in Alderwood Manor: 114.3 (more than average, U.S. average is 100)
Percentage of residents living in poverty in 2022: 4.4%
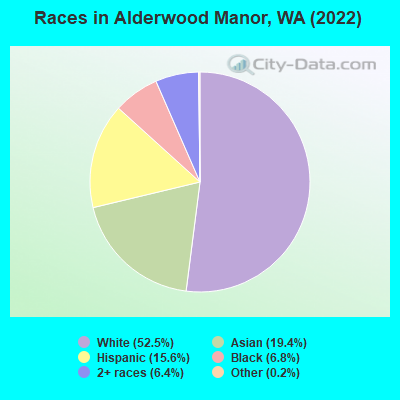
(5.9% for White Non-Hispanic residents, 1.7% for Black residents, 4.8% for Hispanic or Latino residents, 3.0% for other race residents, 8.1% for two or more races residents)
Latest news from Alderwood Manor, WA collected exclusively by city-data.com from local newspapers, TV, and radio stations
Ancestries: American (9.4%), Ethiopian (8.9%), Palestinian (5.5%), English (5.5%), European (4.5%), Greek (2.8%).
Current Local Time: PST time zone
Elevation: 360 feet
Land area: 4.80 square miles.
Population density: 1,759 people per square mile (low).
2,840 residents are foreign born (12.4% Asia, 6.2% Latin America, 4.6% Africa).
This place:
26.6%
Washington:
14.9%
Median real estate property taxes paid for housing units with mortgages in 2022: $5,980 (0.8%) Median real estate property taxes paid for housing units with no mortgage in 2022: $5,210 (0.8%)
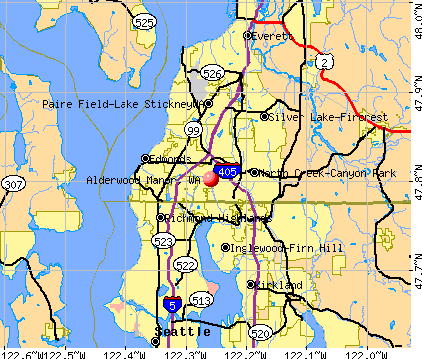
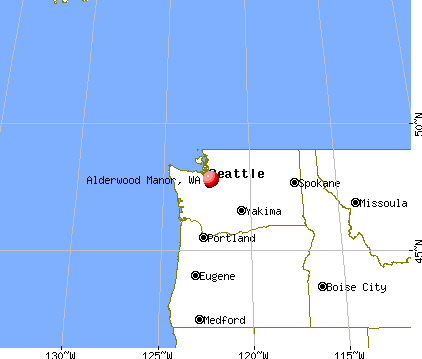
Nearest city with pop. 50,000+: Shoreline, WA (4.9 miles , pop. 53,025).
Nearest city with pop. 200,000+: Seattle, WA (12.7 miles , pop. 563,374).
Nearest city with pop. 1,000,000+: Los Angeles, CA (969.8 miles , pop. 3,694,820).
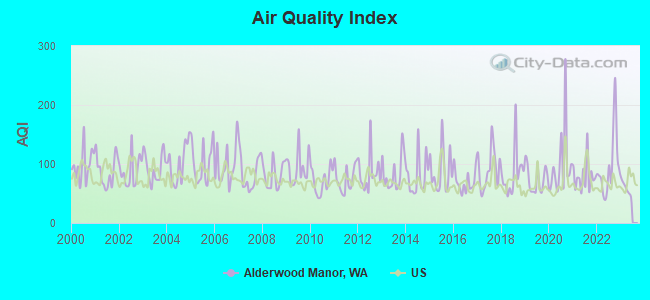
Air Quality Index (AQI) level in 2022 was 97.0. This is worse than average.
City:
97.0
U.S.:
72.6
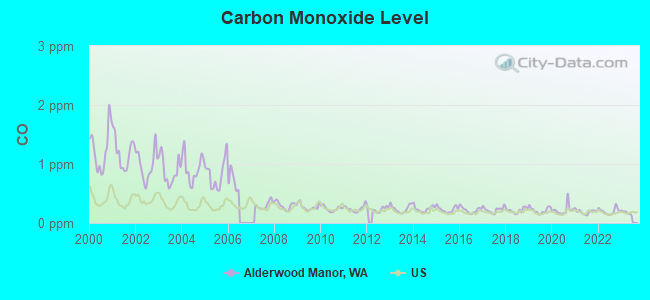
Carbon Monoxide (CO) [ppm] level in 2022 was 0.200. This is better than average.Closest monitor was 2.0 miles away from the city center.
City:
0.200
U.S.:
0.251
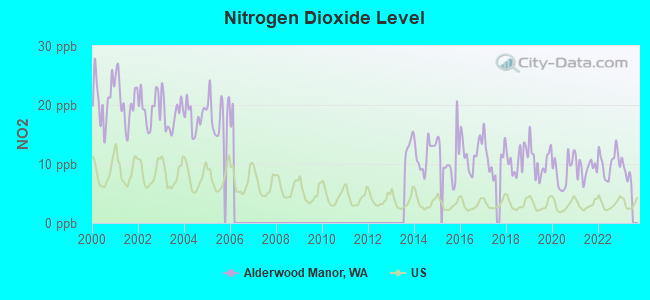
Nitrogen Dioxide (NO2) [ppb] level in 2022 was 10.2. This is significantly worse than average.Closest monitor was 14.1 miles away from the city center.
City:
10.2
U.S.:
5.1
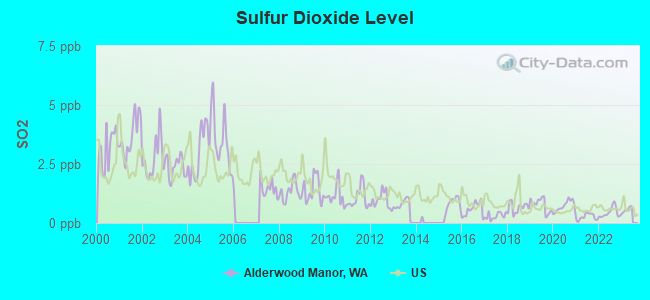
Sulfur Dioxide (SO2) [ppb] level in 2022 was 0.443. This is significantly better than average.Closest monitor was 8.1 miles away from the city center.
City:
0.443
U.S.:
1.515
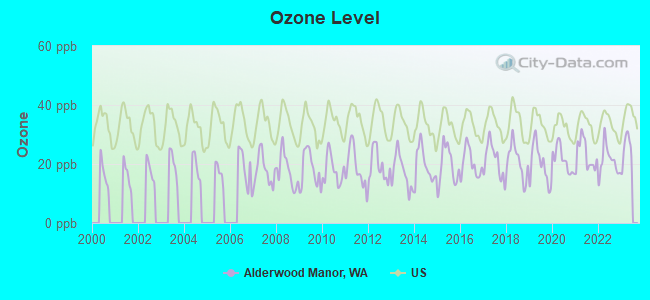
Ozone [ppb] level in 2022 was 21.0. This is significantly better than average.Closest monitor was 12.8 miles away from the city center.
City:
21.0
U.S.:
33.3
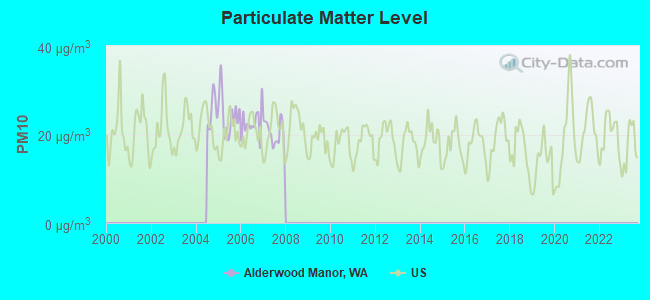
Particulate Matter (PM10) [µg/m3] level in 2007 was 20.3. This is about average.Closest monitor was 2.5 miles away from the city center.
City:
20.3
U.S.:
19.2
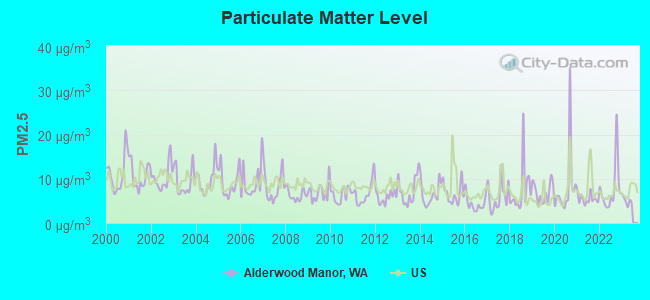
Particulate Matter (PM2.5) [µg/m3] level in 2022 was 7.80. This is about average.Closest monitor was 2.7 miles away from the city center.
City:
7.80
U.S.:
8.11
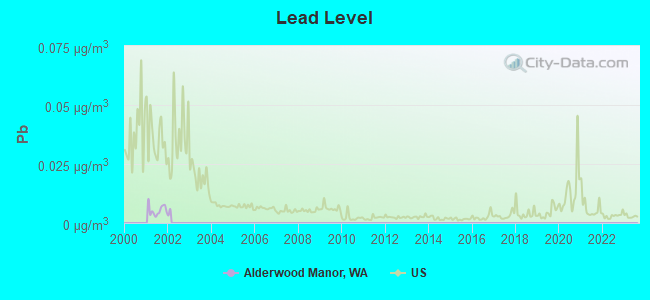
Lead (Pb) [µg/m3] level in 2001 was 0.00545. This is significantly better than average.Closest monitor was 3.4 miles away from the city center.
City:
0.00545
U.S.:
0.00931
Earthquake activity:
Alderwood Manor-area historical earthquake activity is significantly above Washington state average. It is 1254% greater than the overall U.S. average.
On 4/13/1949 at 19:55:42, a magnitude 7.0 (7.0 UK, Class: Major, Intensity: VIII - XII) earthquake occurred 39.8 miles away from the city center, causing $80,000,000 total damage On 2/28/2001 at 18:54:32, a magnitude 6.8 (6.8 MD, Depth: 32.2 mi, Class: Strong, Intensity: VII - IX) earthquake occurred 50.2 miles away from Alderwood Manor center On 2/28/2001 at 18:54:32, a magnitude 6.8 (6.5 MB, 6.6 MS, 6.8 MW) earthquake occurred 51.5 miles away from the city center, causing $2,000,000,000 total damage and $305,000,000 insured losses On 4/29/1965 at 15:28:43, a magnitude 6.6 (6.6 UK) earthquake occurred 33.8 miles away from the city center, causing $28,000,000 total damage On 7/3/1999 at 01:43:54, a magnitude 5.8 (5.4 MB, 5.5 MS, 5.8 MW, 5.3 ME, Depth: 25.2 mi, Class: Moderate, Intensity: VI - VII) earthquake occurred 68.7 miles away from Alderwood Manor center On 5/3/1996 at 04:04:22, a magnitude 5.5 (5.2 MB, 5.3 MD, 5.5 ML, Depth: 2.5 mi) earthquake occurred 24.0 miles away from the city center Magnitude types: body-wave magnitude (MB), duration magnitude (MD), energy magnitude (ME), local magnitude (ML), surface-wave magnitude (MS), moment magnitude (MW)
Natural disasters:
The number of natural disasters in Snohomish County (31) is a lot greater than the US average (15). Major Disasters (Presidential) Declared: 27 Emergencies Declared: 2
Causes of natural disasters: Floods: 21, Storms: 17, Mudslides: 14, Landslides: 10, Winter Storms: 6, Winds: 5, Earthquakes: 2, Heavy Rain: 1, Hurricane: 1, Snow: 1, Tornado: 1, Volcanic Eruption: 1, Other: 1 (Note: some incidents may be assigned to more than one category).
Hospitals and medical centers near Alderwood Manor:
BOTHELL HEALTH CARE (Nursing Home, about 2 miles away; BOTHELL, WA)
EASTERN STAR NURSING HOME (Nursing Home, about 2 miles away; BOTHELL, WA)
PUGET SOUND KC SOUTH (Dialysis Facility, about 2 miles away; MOUNTLAKE TERRACE, WA)
MANOR CARE HEALTH SERVICES (Nursing Home, about 3 miles away; LYNNWOOD, WA)
SWEDISH VISITING NURSE SERVICES (Home Health Center, about 3 miles away; MOUNTLAKE TERRACE, WA)
EMERALD HILLS REHABILITATION AND SKILLED NURSING (Nursing Home, about 4 miles away; LYNNWOOD, WA)
MILL CREEK DIALYSIS CENTER (Dialysis Facility, about 4 miles away; BOTHELL, WA)
Amtrak stations near Alderwood Manor:
6 miles: EDMONDS (211 RAILROAD AVE.) . Services: ticket office, fully wheelchair accessible, enclosed waiting area, public restrooms, public payphones, vending machines, paid short-term parking, paid long-term parking, call for taxi service, public transit connection.
13 miles: EVERETT (2900 BOND ST.) . Services: ticket office, partially wheelchair accessible, enclosed waiting area, public payphones, free short-term parking, free long-term parking, call for car rental service, taxi stand, public transit connection.
15 miles: MONROE (RED BARN UNOCAL) - Bus Station
Colleges/universities with over 2000 students nearest to Alderwood Manor:
Edmonds Community College (about 4 miles; Lynnwood, WA; Full-time enrollment: 7,271)
University of Washington-Bothell Campus (about 5 miles; Bothell, WA; FT enrollment: 3,902)
Cascadia Community College (about 5 miles; Bothell, WA; FT enrollment: 2,238)
Shoreline Community College (about 6 miles; Shoreline, WA; FT enrollment: 5,026)
Seattle Community College-North Campus (about 8 miles; Seattle, WA; FT enrollment: 4,220)
Lake Washington Institute of Technology (about 8 miles; Kirkland, WA; FT enrollment: 2,947)
University of Washington-Seattle Campus (about 11 miles; Seattle, WA; FT enrollment: 39,445)
Notable locations in Alderwood Manor: Brier Substation (A), Snohomish County Fire Protection District 1 Hilltop Station 22 (B). Display/hide their locations on the map
Churches in Alderwood Manor include: Harvest Time Church (A), Cypress Way Community Church (B), Christ Covenant Church (C), Redemption Lutheran Church (D), Calvary Chapel Lynnwood (E), Church of the Good Shepherd (F), Charisma Christian Center (G), Seed Church (H), Gloria Dei Lutheran Church (I). Display/hide their locations on the map
Snohomish County has a predicted average indoor radon screening level less than 2 pCi/L (pico curies per liter) - Low Potential
Average household size:
This place:
2.7 people
Washington:
2.5 people
Percentage of family households:
This place:
70.7%
Whole state:
64.4%
Percentage of households with unmarried partners:
This place:
8.2%
Whole state:
7.7%
Likely homosexual households (counted as self-reported same-sex unmarried-partner households)
Lesbian couples: 0.3% of all households
Gay men: 0.4% of all households
People in group quarters in Alderwood Manor in 2010:
28 people in group homes intended for adults
11 people in workers' group living quarters and job corps centers
3 people in group homes for juveniles (non-correctional)
People in group quarters in Alderwood Manor in 2000:
12 people in other group homes
12 people in other noninstitutional group quarters
4 people in homes for the physically handicapped
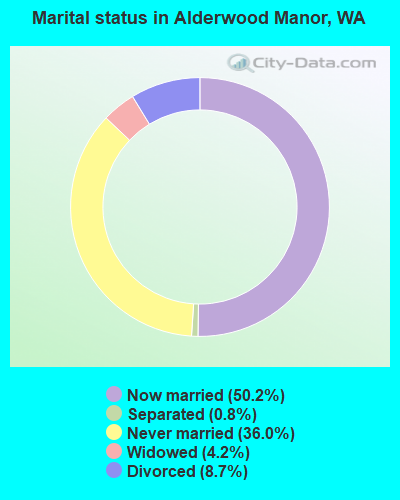
For population 15 years and over in Alderwood Manor:
Never married: 36.0%
Now married: 50.2%
Separated: 0.8%
Widowed: 4.2%
Divorced: 8.7%
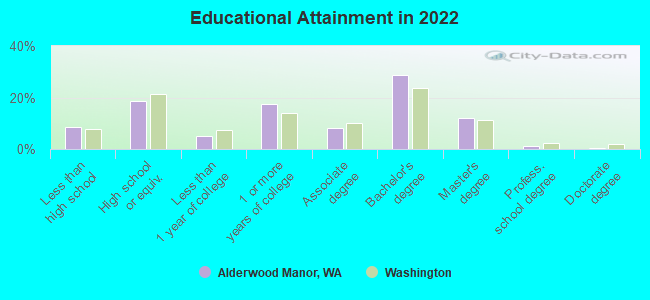
For population 25 years and over in Alderwood Manor:
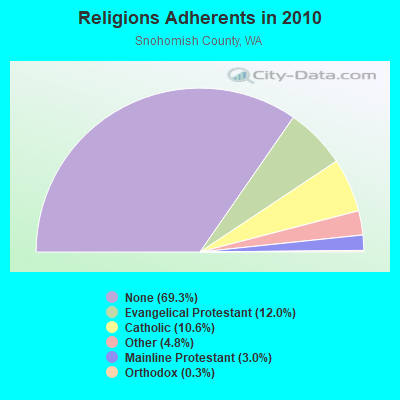
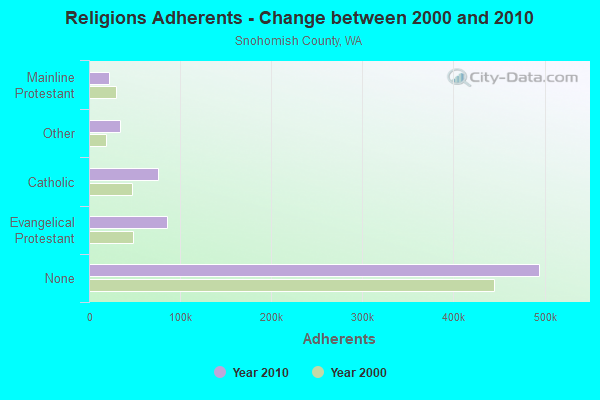
Religion statistics for Alderwood Manor, WA (based on Snohomish County data)
Religion
Adherents
Congregations
Evangelical Protestant
85,354
327
Catholic
75,393
16
Other
34,270
90
Mainline Protestant
21,642
71
Orthodox
1,943
6
Black Protestant
406
4
None
494,327
-
Source: Clifford Grammich, Kirk Hadaway, Richard Houseal, Dale E.Jones, Alexei Krindatch, Richie Stanley and Richard H.Taylor. 2012. 2010 U.S.Religion Census: Religious Congregations & Membership Study. Association of Statisticians of American Religious Bodies. Jones, Dale E., et al. 2002. Congregations and Membership in the United States 2000. Nashville, TN: Glenmary Research Center. Graphs represent county-level data
Call Sign: KA2NTJ, Licensee ID: L00352323, Grant Date: 05/14/1998, Expiration Date: 05/14/2008, Cancellation Date: 05/15/2010, Registrant: Nancy A Hamilton, 903 Kentish Road, Alderwood Manor, WA 98036-4931
Call Sign: W7FEX, Licensee ID: L00240761, Grant Date: 05/24/2010, Expiration Date: 08/07/2020, Cancellation Date: 08/09/2022, Certifier: K Frank Hogan, Registrant: K Frank Hogan, 23027 25th W, Alderwood Manor, WA 98036
Call Sign: W7PYY, Licensee ID: L01112977, Grant Date: 01/31/2006, Expiration Date: 04/23/2016, Cancellation Date: 04/24/2018, Certifier: Harvey H Stivers, Registrant: Harvey H Stivers, 22815 35th W, Alderwood Manor, WA 98036
Call Sign: W7RKO, Licensee ID: L00857309, Grant Date: 05/03/2004, Expiration Date: 07/14/2014, Cancellation Date: 01/26/2011, Certifier: Glenn L Nelson, Registrant: Glenn L Nelson, 20419 Crawford Rd, Alderwood Manor, WA 98036
Call Sign: WA7AVL, Licensee ID: L01293251, Grant Date: 07/06/2017, Expiration Date: 10/01/2027, Certifier: Gregory A Hjellen, Registrant: Gregory A Hjellen, 20510 15th Ave West, Alderwood Manor, WA 98036
Call Sign: WA7BRL, Licensee ID: L00260347, Grant Date: 04/08/2015, Expiration Date: 05/25/2025, Certifier: Charles L Greeno, Registrant: Charles L Greeno, 2914 205th Pl Sw, Alderwood Manor, WA 98036
FAA Registered Aircraft:
1
Aircraft: CESSNA 172 (Category: Land, Seats: 4, Weight: Up to 12,499 Pounds, Speed: 105 mph), Engine: CONT MOTOR 0-300 SER (145 HP) (Reciprocating) N-Number: 9155B, N9155B, N-9155B, Serial Number: 36755, Year manufactured: 1958, Airworthiness Date: 04/17/1958, Certificate Issue Date: 03/06/1978 Registrant (Individual): Dorothy S Dba Hauter, 14820 2nd Ave W, Alderwood Manor, WA 98036, Other Owners: Lake Airport Martha Deregistered:Cancel Date: 02/17/2017
Home Mortgage Disclosure Act Aggregated Statistics For Year 2009 (Based on 6 partial tracts)
A) FHA, FSA/RHS & VA Home Purchase Loans
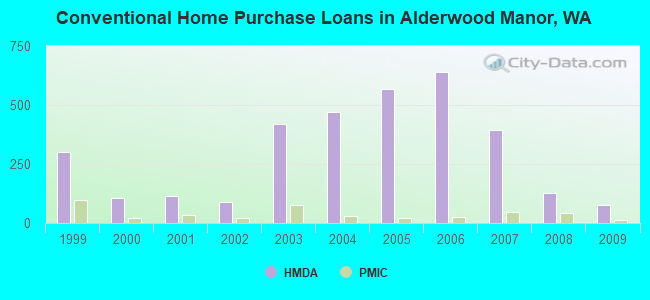
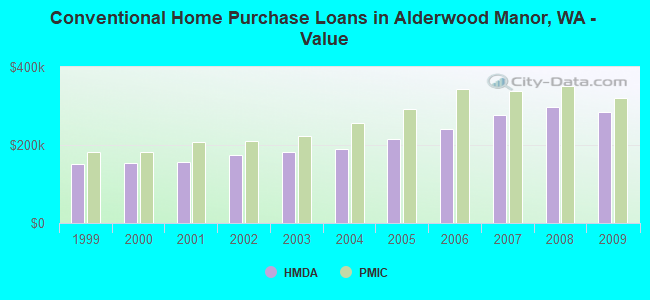
B) Conventional Home Purchase Loans
C) Refinancings
D) Home Improvement Loans
E) Loans on Dwellings For 5+ Families
F) Non-occupant Loans on < 5 Family Dwellings (A B C & D)
G) Loans On Manufactured Home Dwelling (A B C & D)
Number
Average Value
Number
Average Value
Number
Average Value
Number
Average Value
Number
Average Value
Number
Average Value
Number
Average Value
LOANS ORIGINATED
94
$297,039
75
$283,701
739
$251,793
20
$116,260
2
$1,404,490
23
$222,045
8
$184,469
APPLICATIONS APPROVED, NOT ACCEPTED
7
$343,243
12
$304,948
84
$268,467
6
$48,693
0
$0
4
$199,850
1
$24,350
APPLICATIONS DENIED
9
$276,811
15
$299,334
195
$294,307
15
$81,407
0
$0
13
$284,624
2
$145,825
APPLICATIONS WITHDRAWN
12
$276,357
6
$284,195
133
$268,535
6
$197,628
1
$3,040,100
5
$222,874
1
$166,380
FILES CLOSED FOR INCOMPLETENESS
2
$279,180
3
$202,463
30
$266,802
1
$28,320
0
$0
2
$255,545
1
$70,790
Aggregated Statistics For Year 2008 (Based on 6 partial tracts)
A) FHA, FSA/RHS & VA Home Purchase Loans
B) Conventional Home Purchase Loans
C) Refinancings
D) Home Improvement Loans
E) Loans on Dwellings For 5+ Families
F) Non-occupant Loans on < 5 Family Dwellings (A B C & D)
G) Loans On Manufactured Home Dwelling (A B C & D)
Number
Average Value
Number
Average Value
Number
Average Value
Number
Average Value
Number
Average Value
Number
Average Value
Number
Average Value
LOANS ORIGINATED
49
$334,984
127
$298,102
453
$272,114
35
$88,887
2
$1,011,110
32
$261,234
8
$169,659
APPLICATIONS APPROVED, NOT ACCEPTED
6
$279,610
27
$308,526
78
$293,315
5
$214,688
0
$0
8
$355,574
4
$114,768
APPLICATIONS DENIED
14
$360,509
29
$221,526
227
$301,392
22
$120,030
1
$246,510
11
$270,693
9
$117,176
APPLICATIONS WITHDRAWN
7
$306,304
17
$281,043
129
$285,577
10
$191,228
0
$0
8
$237,591
1
$344,110
FILES CLOSED FOR INCOMPLETENESS
3
$343,653
3
$316,270
29
$295,130
3
$157,437
0
$0
2
$328,270
0
$0
Aggregated Statistics For Year 2007 (Based on 6 partial tracts)
A) FHA, FSA/RHS & VA Home Purchase Loans
B) Conventional Home Purchase Loans
C) Refinancings
D) Home Improvement Loans
E) Loans on Dwellings For 5+ Families
F) Non-occupant Loans on < 5 Family Dwellings (A B C & D)
G) Loans On Manufactured Home Dwelling (A B C & D)
Number
Average Value
Number
Average Value
Number
Average Value
Number
Average Value
Number
Average Value
Number
Average Value
Number
Average Value
LOANS ORIGINATED
5
$293,022
392
$275,931
604
$248,530
65
$141,025
2
$716,520
57
$255,174
15
$169,280
APPLICATIONS APPROVED, NOT ACCEPTED
0
$0
53
$297,214
114
$267,789
13
$109,298
0
$0
15
$261,978
2
$94,450
APPLICATIONS DENIED
0
$0
85
$261,995
224
$278,156
38
$151,504
0
$0
29
$273,121
8
$103,745
APPLICATIONS WITHDRAWN
0
$0
41
$285,705
133
$266,178
15
$163,913
0
$0
8
$276,989
4
$231,712
FILES CLOSED FOR INCOMPLETENESS
0
$0
11
$220,210
41
$284,797
4
$193,512
0
$0
4
$198,855
0
$0
Aggregated Statistics For Year 2006 (Based on 6 partial tracts)
A) FHA, FSA/RHS & VA Home Purchase Loans
B) Conventional Home Purchase Loans
C) Refinancings
D) Home Improvement Loans
E) Loans on Dwellings For 5+ Families
F) Non-occupant Loans on < 5 Family Dwellings (A B C & D)
G) Loans On Manufactured Home Dwelling (A B C & D)
Number
Average Value
Number
Average Value
Number
Average Value
Number
Average Value
Number
Average Value
Number
Average Value
Number
Average Value
LOANS ORIGINATED
8
$286,939
638
$240,950
640
$218,364
75
$110,396
1
$1,469,200
81
$233,810
8
$138,358
APPLICATIONS APPROVED, NOT ACCEPTED
0
$0
78
$210,962
99
$218,739
9
$118,873
0
$0
11
$223,996
2
$158,650
APPLICATIONS DENIED
1
$257,190
106
$239,256
208
$235,870
47
$114,822
0
$0
20
$213,635
6
$151,455
APPLICATIONS WITHDRAWN
0
$0
72
$232,764
208
$233,038
17
$166,398
0
$0
14
$250,401
2
$105,195
FILES CLOSED FOR INCOMPLETENESS
0
$0
8
$291,988
48
$242,038
2
$148,145
0
$0
1
$158,590
1
$34,540
Aggregated Statistics For Year 2005 (Based on 6 partial tracts)
A) FHA, FSA/RHS & VA Home Purchase Loans
B) Conventional Home Purchase Loans
C) Refinancings
D) Home Improvement Loans
E) Loans on Dwellings For 5+ Families
F) Non-occupant Loans on < 5 Family Dwellings (A B C & D)
G) Loans On Manufactured Home Dwelling (A B C & D)
Number
Average Value
Number
Average Value
Number
Average Value
Number
Average Value
Number
Average Value
Number
Average Value
Number
Average Value
LOANS ORIGINATED
4
$256,902
569
$214,972
667
$195,592
60
$126,980
1
$1,027,130
71
$204,780
7
$116,077
APPLICATIONS APPROVED, NOT ACCEPTED
0
$0
70
$199,047
102
$196,797
13
$95,192
1
$986,040
8
$173,236
2
$103,365
APPLICATIONS DENIED
1
$164,490
100
$213,516
238
$195,738
30
$78,640
0
$0
21
$264,618
6
$150,035
APPLICATIONS WITHDRAWN
1
$94,570
73
$228,067
226
$197,229
14
$138,314
1
$1,068,210
18
$167,151
5
$134,904
FILES CLOSED FOR INCOMPLETENESS
0
$0
12
$231,129
96
$225,774
2
$190,710
0
$0
4
$313,872
1
$238,610
Aggregated Statistics For Year 2004 (Based on 6 partial tracts)
A) FHA, FSA/RHS & VA Home Purchase Loans
B) Conventional Home Purchase Loans
C) Refinancings
D) Home Improvement Loans
E) Loans on Dwellings For 5+ Families
F) Non-occupant Loans on < 5 Family Dwellings (A B C & D)
G) Loans On Manufactured Home Dwelling (A B C & D)
Number
Average Value
Number
Average Value
Number
Average Value
Number
Average Value
Number
Average Value
Number
Average Value
Number
Average Value
LOANS ORIGINATED
17
$221,639
469
$190,465
701
$179,935
51
$84,989
2
$277,700
52
$193,056
12
$125,784
APPLICATIONS APPROVED, NOT ACCEPTED
0
$0
51
$176,373
126
$202,510
8
$57,938
0
$0
8
$179,739
1
$188,010
APPLICATIONS DENIED
3
$174,727
63
$179,117
320
$183,897
37
$68,523
0
$0
18
$181,699
7
$100,276
APPLICATIONS WITHDRAWN
2
$236,980
52
$188,144
202
$201,784
12
$54,275
0
$0
6
$166,747
3
$86,157
FILES CLOSED FOR INCOMPLETENESS
1
$214,460
8
$182,755
101
$207,531
3
$38,640
0
$0
1
$183,820
0
$0
Aggregated Statistics For Year 2003 (Based on 6 partial tracts)
A) FHA, FSA/RHS & VA Home Purchase Loans
B) Conventional Home Purchase Loans
C) Refinancings
D) Home Improvement Loans
F) Non-occupant Loans on < 5 Family Dwellings (A B C & D)
Number
Average Value
Number
Average Value
Number
Average Value
Number
Average Value
Number
Average Value
LOANS ORIGINATED
65
$213,869
420
$180,855
1,712
$165,182
43
$35,404
96
$162,978
APPLICATIONS APPROVED, NOT ACCEPTED
3
$185,653
40
$186,936
186
$170,538
11
$37,758
9
$134,778
APPLICATIONS DENIED
3
$228,007
51
$152,111
304
$183,176
25
$19,188
16
$140,761
APPLICATIONS WITHDRAWN
4
$195,335
38
$191,730
243
$175,809
12
$66,448
9
$136,738
FILES CLOSED FOR INCOMPLETENESS
2
$104,765
6
$141,045
51
$167,414
2
$142,675
4
$128,288
Aggregated Statistics For Year 2002 (Based on 1 partial tract)
A) FHA, FSA/RHS & VA Home Purchase Loans
B) Conventional Home Purchase Loans
C) Refinancings
D) Home Improvement Loans
E) Loans on Dwellings For 5+ Families
F) Non-occupant Loans on < 5 Family Dwellings (A B C & D)
Number
Average Value
Number
Average Value
Number
Average Value
Number
Average Value
Number
Average Value
Number
Average Value
LOANS ORIGINATED
19
$196,127
90
$173,287
380
$156,839
15
$22,405
0
$0
26
$162,254
APPLICATIONS APPROVED, NOT ACCEPTED
2
$118,325
18
$185,658
48
$165,641
2
$23,420
0
$0
1
$151,190
APPLICATIONS DENIED
2
$190,225
24
$148,762
81
$156,640
15
$35,717
1
$1,494,670
10
$163,190
APPLICATIONS WITHDRAWN
4
$213,848
12
$167,558
75
$164,986
4
$53,410
0
$0
1
$129,830
FILES CLOSED FOR INCOMPLETENESS
0
$0
7
$208,243
20
$154,808
0
$0
0
$0
1
$129,830
Aggregated Statistics For Year 2001 (Based on 1 partial tract)
A) FHA, FSA/RHS & VA Home Purchase Loans
B) Conventional Home Purchase Loans
C) Refinancings
D) Home Improvement Loans
F) Non-occupant Loans on < 5 Family Dwellings (A B C & D)
Number
Average Value
Number
Average Value
Number
Average Value
Number
Average Value
Number
Average Value
LOANS ORIGINATED
19
$187,651
116
$156,435
278
$153,877
20
$18,530
22
$146,599
APPLICATIONS APPROVED, NOT ACCEPTED
2
$114,215
18
$173,379
38
$161,313
7
$23,711
2
$112,985
APPLICATIONS DENIED
1
$138,050
27
$106,973
55
$147,771
17
$19,479
2
$55,875
APPLICATIONS WITHDRAWN
1
$137,220
11
$188,692
66
$159,098
7
$23,007
0
$0
FILES CLOSED FOR INCOMPLETENESS
0
$0
1
$30,400
20
$159,164
2
$31,635
2
$136,815
Aggregated Statistics For Year 2000 (Based on 1 partial tract)
A) FHA, FSA/RHS & VA Home Purchase Loans
B) Conventional Home Purchase Loans
C) Refinancings
D) Home Improvement Loans
E) Loans on Dwellings For 5+ Families
F) Non-occupant Loans on < 5 Family Dwellings (A B C & D)
Number
Average Value
Number
Average Value
Number
Average Value
Number
Average Value
Number
Average Value
Number
Average Value
LOANS ORIGINATED
25
$182,286
108
$153,673
66
$123,317
35
$24,581
2
$3,944,160
12
$122,638
APPLICATIONS APPROVED, NOT ACCEPTED
2
$175,020
14
$129,829
13
$132,989
13
$12,325
0
$0
2
$177,485
APPLICATIONS DENIED
2
$170,090
23
$103,213
42
$144,776
17
$23,394
1
$110,110
7
$127,246
APPLICATIONS WITHDRAWN
2
$141,330
13
$123,698
26
$112,130
2
$73,130
0
$0
2
$154,070
FILES CLOSED FOR INCOMPLETENESS
0
$0
5
$167,298
23
$143,154
2
$16,845
1
$395,240
2
$134,760
Aggregated Statistics For Year 1999 (Based on 4 partial tracts)
A) FHA, FSA/RHS & VA Home Purchase Loans
B) Conventional Home Purchase Loans
C) Refinancings
D) Home Improvement Loans
E) Loans on Dwellings For 5+ Families
F) Non-occupant Loans on < 5 Family Dwellings (A B C & D)
#33 on the list of "Top 101 cities with the most residents born in Hong Kong (population 500+)"
#48 on the list of "Top 101 cities with the most residents born in Afghanistan (population 500+)"
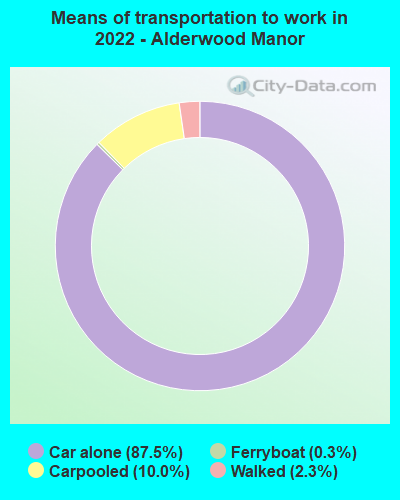
#78 on the list of "Top 101 cities that people commute from (largest negative percentage daily daytime population change due to commuting) (population 5,000+)"
#98 on the list of "Top 100 cities with declining populations from 2000 to 2014"
#24 on the list of "Top 101 counties with the lowest Particulate Matter (PM2.5) Annual air pollution readings in 2012 (µg/m3)"
#45 on the list of "Top 101 counties with the lowest number of infant deaths per 1000 residents 2007-2013 (pop. 50,000+)"
#46 on the list of "Top 101 counties with the highest percentage of residents that exercised in the past month"
#48 on the list of "Top 101 counties with the highest average weight of females"
#60 on the list of "Top 101 counties with the most Other congregations (pop. 50,000+)"
There is 1 pilot and no other airmen in this city.


 Recent articles from our blog. Our writers, many of them Ph.D. graduates or candidates, create easy-to-read articles on a wide variety of topics.

 (4.9 miles