San Antonio, TX (Texas) Houses and Residents
Estimated median house or condo value in 2022: $230,700 (it was $67,500 in 2000 )
San Antonio:
$230,700Texas:
$275,400
Lower value quartile - upper value quartile: $150,800 - $335,600Mean price in 2022: Detached houses: $257,450 Here:
$257,450State:
$369,058
Townhouses or other attached units: $278,164 Here:
$278,164State:
$327,631
In 2-unit structures: $323,201 Here:
$323,201State:
$374,947
In 3-to-4-unit structures: $186,623 Here:
$186,623State:
$209,652
In 5-or-more-unit structures: $209,743 Here:
$209,743State:
$413,944
Mobile homes: $81,302 Here:
$81,302State:
$124,413
Occupied boats, RVs, vans, etc.: $105,053 Here:
$105,053State:
$73,921
Total population: 1,436,697 (Urban population: 1,136,848, Rural population: 7,706 (53 farm, 7,653 nonfarm ))
Houses: 612,031 (557,118 occupied: 289,235 owner occupied, 267,883 renter occupied )
% of renters here:
48%State:
38%
Housing density: 1,502 houses/condos per square mile
Median price asked for vacant for-sale houses and condos in 2022: $290,358.
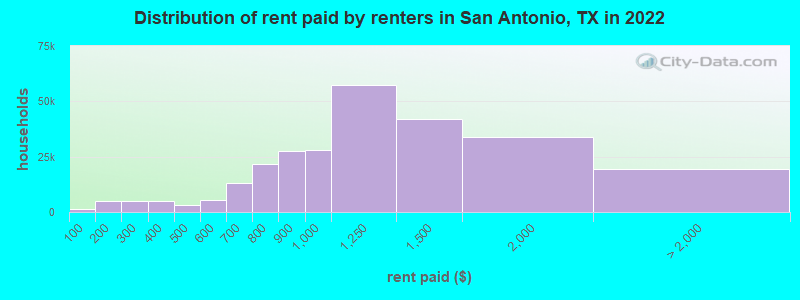
Median contract rent in 2022: $1,060 (lower quartile is $817, upper quartile is $1,374)
Median rent asked for vacant for-rent units in 2022: $1,326
Median gross rent in San Antonio, TX in 2022: $1,234
Housing units in San Antonio with a mortgage: 160,852 (9,147 second mortgage, 366 home equity loan, 7,394 both second mortgage and home equity loan )Houses without a mortgage: 4,245
Median household income for houses/condos with a mortgage: $90,189
Median household income for apartments without a mortgage: $61,556
Median monthly housing costs: $1,199
Data:
Median house or condo value ($)
Median house or condo value ($ change since 2000)
Median house or condo value ($) - White
Median house or condo value ($) - Black or African American
Median house or condo value ($) - Asian
Median house or condo value ($) - Hispanic or Latino
Median house or condo value ($) - American Indian and Alaska Native
Median house or condo value ($) - Multirace
Median house or condo value ($) - Other Race
Median price asked for mobile homes ($)
Household density (households per square mile)
Mean house or condo value by units in structure - 1, detached ($)
Mean house or condo value by units in structure - 1, attached ($)
Mean house or condo value by units in structure - 2 ($)
Mean house or condo value by units in structure by units in structure - 3 or 4 ($)
Mean house or condo value by units in structure - 5 or more ($)
Mean house or condo value by units in structure - Boat, RV, van, etc. ($)
Mean house or condo value by units in structure - Mobile home ($)
Median contract rent ($)
Median contract rent - Lower quartile ($)
Median contract rent - Upper quartile ($)
Median gross rent ($)
Urban houses (%)
Rural houses (%)
Houses occupied (%)
Houses occupied (% change since 2000)
Houses owner occupied (%)
Houses owner occupied (% change since 2000)
Houses renter occupied (%)
Houses renter occupied (% change since 2000)
Vacant housing units - For rent (%)
Vacant housing units - For rent (% change since 2000)
Vacant housing units - For sale only (%)
Vacant housing units - For sale only (% change since 2000)
Vacant housing units - Rented or sold, not occupied (%)
Vacant housing units - Rented or sold, not occupied (% change since 2000)
Vacant housing units - For seasonal, recreational, or occasional use (%)
Vacant housing units - For seasonal, recreational, or occasional use (% change since 2000)
Vacant housing units - For migrant workers (%)
Vacant housing units - For migrant workers (% change since 2000)
Vacant housing units - Other vacant (%)
Vacant housing units - Other vacant (% change since 2000)
Median monthly housing costs ($)
Median household income for houses/condos with a mortgage ($)
Median household income for houses/condos without a mortgage ($)
Median household income ($)
Median household income ($) - White
Median household income ($) - Black or African American
Median household income ($) - Asian
Median household income ($) - Hispanic or Latino
Median household income ($) - American Indian and Alaska Native
Median household income ($) - Multirace
Median household income ($) - Other Race
Mortgage status - with mortgage (%)
Mortgage status - with second mortgage (%)
Mortgage status - with home equity loan (%)
Mortgage status - with both second mortgage and home equity loan (%)
Mortgage status - without a mortgage (%)
Median year house/condo built
Median year apartment built
Household type by relationship - Male householder living alone (%)
Household type by relationship - Male householder not living alone (%)
Household type by relationship - Female householder living alone (%)
Household type by relationship - Female householder not living alone (%)
Household type by relationship - Opposite-Sex spouse (%)
Household type by relationship - Same-Sex spouse (%)
Household type by relationship - Opposite-Sex unmarried partner (%)
Household type by relationship - Same-Sex unmarried partner (%)
Household type by relationship - In group quarters (%)
Size of family households - 2-person household (%)
Size of family households - 3-person household (%)
Size of family households - 4-person household (%)
Size of family households - 5-person household (%)
Size of family households - 6-person household (%)
Size of family households - 7-or-more-person household (%)
Size of nonfamily households - 1-person household (%)
Size of nonfamily households - 2-person household (%)
Size of nonfamily households - 3-person household (%)
Size of nonfamily households - 4-person household (%)
Size of nonfamily households - 5-person household (%)
Size of nonfamily households - 6-person household (%)
Size of nonfamily households - 7-or-moreperson household (%)
Year house built - Built 2010 or later (%)
Year house built - Built 2000 to 2009 (%)
Year house built - Built 1990 to 1999 (%)
Year house built - Built 1980 to 1989 (%)
Year house built - Built 1970 to 1979 (%)
Year house built - Built 1960 to 1969 (%)
Year house built - Built 1950 to 1959 (%)
Year house built - Built 1940 to 1949 (%)
Year house built - Built 1939 or earlier (%)
Median number of rooms in houses and condos
Median number of rooms in apartments
Median number of bedrooms in owner occupied houses
Mean number of bedrooms in owner occupied houses
Median number of bedrooms in renter occupied houses
Mean number of bedrooms in renter occupied houses
Median number of vehichles in owner occupied houses
Mean number of vehichles in owner occupied houses
Median number of vehichles in renter occupied houses
Mean number of vehichles in renter occupied houses
Rooms in owner-occupied houses - 1 room (%)
Rooms in owner-occupied houses - 2 rooms (%)
Rooms in owner-occupied houses - 3 rooms (%)
Rooms in owner-occupied houses - 4 rooms (%)
Rooms in owner-occupied houses - 5 rooms (%)
Rooms in owner-occupied houses - 6 rooms (%)
Rooms in owner-occupied houses - 7 rooms (%)
Rooms in owner-occupied houses - 8 rooms (%)
Rooms in owner-occupied houses - 9+ rooms (%)
Rooms in renter-occupied houses - 1 room (%)
Rooms in renter-occupied houses - 2 rooms (%)
Rooms in renter-occupied houses - 3 rooms (%)
Rooms in renter-occupied houses - 4 rooms (%)
Rooms in renter-occupied houses - 5 rooms (%)
Rooms in renter-occupied houses - 6 rooms (%)
Rooms in renter-occupied houses - 7 rooms (%)
Rooms in renter-occupied houses - 8 rooms (%)
Rooms in renter-occupied houses - 9+ rooms (%)
Bedrooms in owner-occupied houses - no bedrooms (%)
Bedrooms in owner-occupied houses - 1 bedroom (%)
Bedrooms in owner-occupied houses - 2 bedrooms (%)
Bedrooms in owner-occupied houses - 3 bedrooms (%)
Bedrooms in owner-occupied houses - 4 bedrooms (%)
Bedrooms in owner-occupied houses - 5+ bedrooms (%)
Bedrooms in renter-occupied houses - no bedrooms (%)
Bedrooms in renter-occupied houses - 1 bedroom (%)
Bedrooms in renter-occupied houses - 2 bedrooms (%)
Bedrooms in renter-occupied houses - 3 bedrooms (%)
Bedrooms in renter-occupied houses - 4 bedrooms (%)
Bedrooms in renter-occupied houses - 5+ bedrooms (%)
Vehicles available in owner-occupied houses - no vehicle available (%)
Vehicles available in owner-occupied houses - 1 vehicle available(%)
Vehicles available in owner-occupied houses - 2 Vehicles available (%)
Vehicles available in owner-occupied houses - 3 Vehicles available (%)
Vehicles available in owner-occupied houses - 4 Vehicles available (%)
Vehicles available in owner-occupied houses - 5+ Vehicles available (%)
Vehicles available in renter-occupied houses - no vehicle available (%)
Vehicles available in renter-occupied houses - 1 vehicle available (%)
Vehicles available in renter-occupied houses - 2 Vehicles available (%)
Vehicles available in renter-occupied houses - 3 Vehicles available (%)
Vehicles available in renter-occupied houses - 4 Vehicles available (%)
Vehicles available in renter-occupied houses - 5+ Vehicles available (%)
Housing units in structures - 1, detached (%)
Housing units in structures - 1, attached (%)
Housing units in structures - 2 (%)
Housing units in structures - 3 or 4 (%)
Housing units in structures - 5 to 9 (%)
Housing units in structures - 10 to 19 (%)
Housing units in structures - 20 to 49 (%)
Housing units in structures - 50 or more (%)
Housing units in structures - Mobile home (%)
Housing units in structures - Boat, RV, van, etc. (%)
Housing units in structures - Owners - 1, detached (%)
Housing units in structures - Owners - 1, attached (%)
Housing units in structures - Owners - 2 (%)
Housing units in structures - Owners - 3 or 4 (%)
Housing units in structures - Owners - 5 to 9 (%)
Housing units in structures - Owners - 10 to 19 (%)
Housing units in structures - Owners - 20 to 49 (%)
Housing units in structures - Owners - 50 or more (%)
Housing units in structures - Owners - Mobile home (%)
Housing units in structures - Owners - Boat, RV, van, etc. (%)
Housing units in structures - Renters - 1, detached (%)
Housing units in structures - Renters - 1, attached (%)
Housing units in structures - Renters - 2 (%)
Housing units in structures - Renters - 3 or 4 (%)
Housing units in structures - Renters - 5 to 9 (%)
Housing units in structures - Renters - 10 to 19 (%)
Housing units in structures - Renters - 20 to 49 (%)
Housing units in structures - Renters - 50 or more (%)
Housing units in structures - Renters - Mobile home (%)
Housing units in structures - Renters - Boat, RV, van, etc. (%)
House/condo owner moved in on average (years ago)
Renter moved in on average (years ago)
Year householder moved into unit - Moved in 1999 to March 2000 (%)
Year householder moved into unit - Moved in 1999 to March 2000 (%) - White
Year householder moved into unit - Moved in 1999 to March 2000 (%) - Black or African American
Year householder moved into unit - Moved in 1999 to March 2000 (%) - Asian
Year householder moved into unit - Moved in 1999 to March 2000 (%) - Hispanic or Latino
Year householder moved into unit - Moved in 1999 to March 2000 (%) - American Indian and Alaska Native
Year householder moved into unit - Moved in 1999 to March 2000 (%) - Multirace
Year householder moved into unit - Moved in 1999 to March 2000 (%) - Other Race
Year householder moved into unit - Moved in 1995 to 1998 (%)
Year householder moved into unit - Moved in 1995 to 1998 (%) - White
Year householder moved into unit - Moved in 1995 to 1998 (%) - Black or African American
Year householder moved into unit - Moved in 1995 to 1998 (%) - Asian
Year householder moved into unit - Moved in 1995 to 1998 (%) - Hispanic or Latino
Year householder moved into unit - Moved in 1995 to 1998 (%) - American Indian and Alaska Native
Year householder moved into unit - Moved in 1995 to 1998 (%) - Multirace
Year householder moved into unit - Moved in 1995 to 1998 (%) - Other Race
Year householder moved into unit - Moved in 1990 to 1994 (%)
Year householder moved into unit - Moved in 1990 to 1994 (%) - White
Year householder moved into unit - Moved in 1990 to 1994 (%) - Black or African American
Year householder moved into unit - Moved in 1990 to 1994 (%) - Asian
Year householder moved into unit - Moved in 1990 to 1994 (%) - Hispanic or Latino
Year householder moved into unit - Moved in 1990 to 1994 (%) - American Indian and Alaska Native
Year householder moved into unit - Moved in 1990 to 1994 (%) - Multirace
Year householder moved into unit - Moved in 1990 to 1994 (%) - Other Race
Year householder moved into unit - Moved in 1980 to 1989 (%)
Year householder moved into unit - Moved in 1980 to 1989 (%) - White
Year householder moved into unit - Moved in 1980 to 1989 (%) - Black or African American
Year householder moved into unit - Moved in 1980 to 1989 (%) - Asian
Year householder moved into unit - Moved in 1980 to 1989 (%) - Hispanic or Latino
Year householder moved into unit - Moved in 1980 to 1989 (%) - American Indian and Alaska Native
Year householder moved into unit - Moved in 1980 to 1989 (%) - Multirace
Year householder moved into unit - Moved in 1980 to 1989 (%) - Other Race
Year householder moved into unit - Moved in 1970 to 1979 (%)
Year householder moved into unit - Moved in 1970 to 1979 (%) - White
Year householder moved into unit - Moved in 1970 to 1979 (%) - Black or African American
Year householder moved into unit - Moved in 1970 to 1979 (%) - Asian
Year householder moved into unit - Moved in 1970 to 1979 (%) - Hispanic or Latino
Year householder moved into unit - Moved in 1970 to 1979 (%) - American Indian and Alaska Native
Year householder moved into unit - Moved in 1970 to 1979 (%) - Multirace
Year householder moved into unit - Moved in 1970 to 1979 (%) - Other Race
Year householder moved into unit - Moved in 1969 or earlier (%)
Year householder moved into unit - Moved in 1969 or earlier (%) - White
Year householder moved into unit - Moved in 1969 or earlier (%) - Black or African American
Year householder moved into unit - Moved in 1969 or earlier (%) - Asian
Year householder moved into unit - Moved in 1969 or earlier (%) - Hispanic or Latino
Year householder moved into unit - Moved in 1969 or earlier (%) - American Indian and Alaska Native
Year householder moved into unit - Moved in 1969 or earlier (%) - Multirace
Year householder moved into unit - Moved in 1969 or earlier (%) - Other Race
Housing units lacking complete plumbing facilities (%)
Housing units lacking complete kitchen facilities (%)
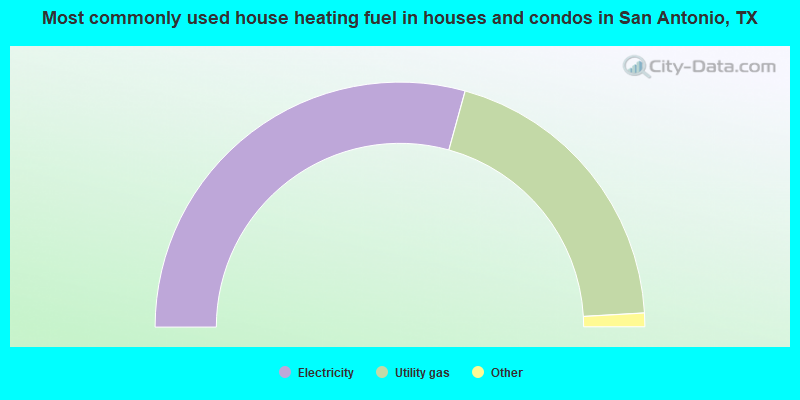
House heating fuel used in houses and condos - Utility gas (%)
House heating fuel used in houses and condos - Bottled, tank, or LP gas (%)
House heating fuel used in houses and condos - Electricity (%)
House heating fuel used in houses and condos - Fuel oil, kerosene, etc. (%)
House heating fuel used in houses and condos - Coal or coke (%)
House heating fuel used in houses and condos - Wood (%)
House heating fuel used in houses and condos - Solar energy (%)
House heating fuel used in houses and condos - Other fuel (%)
House heating fuel used in houses and condos - No fuel used (%)
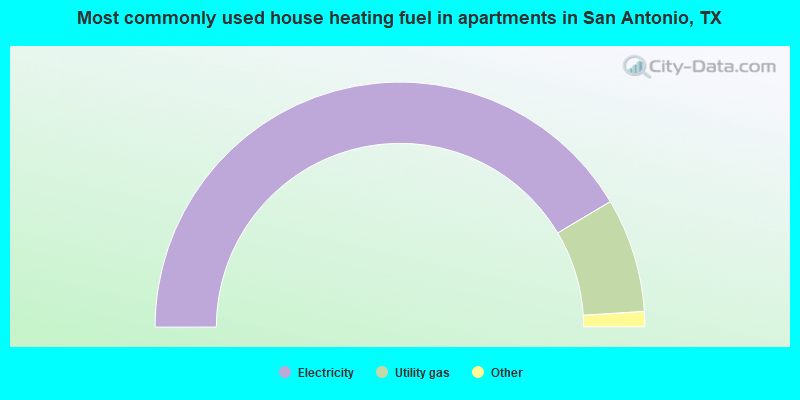
House heating fuel used in apartments - Utility gas (%)
House heating fuel used in apartments - Bottled, tank, or LP gas (%)
House heating fuel used in apartments - Electricity (%)
House heating fuel used in apartments - Fuel oil, kerosene, etc. (%)
House heating fuel used in apartments - Coal or coke (%)
House heating fuel used in apartments - Wood (%)
House heating fuel used in apartments - Solar energy (%)
House heating fuel used in apartments - Other fuel (%)
House heating fuel used in apartments - No fuel used (%)
Median year house/condo built: 1982Median year apartment built: 1989Household type by relationship:
Households: 1,472,904
Male householders: 268,080 (87,665 living alone ), Female householders: 289,038 (92,848 living alone )214,229 spouses (210,660 opposite-sex spouses ), 43,426 unmarried partners , (39,931 opposite-sex unmarried partners ), 447,059 children (418,635 natural , 10,069 adopted , 18,355 stepchildren ), 57,910 grandchildren , 21,378 brothers or sisters , 23,417 parents , 1,176 foster children , 30,480 other relatives , 46,425 non-relatives In group quarters: 30,286
Size of family households: 138,060 2-persons , 82,939 3-persons , 59,358 4-persons , 34,970 5-persons , 13,564 6-persons , 10,597 7-or-more-persons .
Size of nonfamily households: 180,513 1-person , 31,570 2-persons , 3,109 3-persons , 1,488 4-persons , 361 5-persons , 527 6-persons , 62 7-or-more-persons .
175,921 married couples with children. single-parent households (30,643 men , 86,417 women ).
59.3% of residents of San Antonio speak English at home. of residents speak Spanish at home (69% speak English very well , 16% speak English well , 10% speak English not well , 5% don't speak English at all ).of residents speak other Indo-European language at home (57% speak English very well , 23% speak English well , 11% speak English not well , 10% don't speak English at all ).of residents speak Asian or Pacific Island language at home (59% speak English very well , 23% speak English well , 14% speak English not well , 4% don't speak English at all ).of residents speak other language at home (67% speak English very well , 14% speak English well , 19% speak English not well ).
Foreign born population: 211,588 (14.4%)of them are naturalized citizens )
Median number of rooms in houses and condos:
Median number of rooms in apartments
Owner-occupied Renter-occupied
Bedrooms in owner-occupied houses and condos in San Antonio, Texas
1,547 no bedroom 5,946 1 bedroom 38,493 2 bedrooms 159,089 3 bedrooms 73,094 4 bedrooms 11,066 5+ bedrooms
Bedrooms in renter-occupied apartments in San Antonio, Texas
20,206 no bedroom 88,610 1 bedroom 88,380 2 bedrooms 56,300 3 bedrooms 12,713 4 bedrooms 1,674 5+ bedrooms
Owner-occupied Renter-occupied
Cars and other vehicles available in San Antonio in owner-occupied houses/condos
8,414 no vehicle 77,830 1 vehicle 128,930 2 vehicles 52,634 3 vehicles 16,109 4 vehicles 5,318 5+ vehicles
Cars and other vehicles available in San Antonio in renter-occupied apartments
33,592 no vehicle 142,775 1 vehicle 70,558 2 vehicles 15,492 3 vehicles 4,666 4 vehicles 800 5+ vehicles
Owner-occupied Renter-occupied
Rooms in owner-occupied houses in San Antonio, Texas
1,360 1 room 939 2 rooms 6,836 3 rooms 30,843 4 rooms 59,078 5 rooms 72,453 6 rooms 47,155 7 rooms 34,601 8 rooms 35,970 9+ rooms
Rooms in renter-occupied apartments in San Antonio, Texas
19,897 1 room 26,111 2 rooms 64,663 3 rooms 66,054 4 rooms 46,639 5 rooms 24,005 6 rooms 7,159 7 rooms 7,655 8 rooms 5,700 9+ rooms
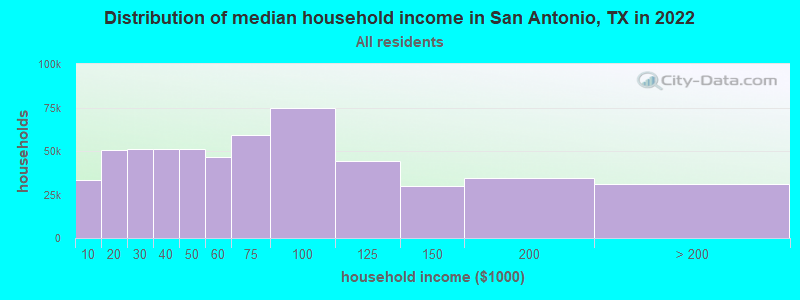
San Antonio, TX household income distribution 33,609 Less than $10,00050,678 $10,000 to $19,99950,901 $20,000 to $29,99950,975 $30,000 to $39,99951,075 $40,000 to $49,99946,300 $50,000 to $59,99959,136 $60,000 to $74,99974,947 $75,000 to $99,99944,016 $100,000 to $124,99929,901 $125,000 to $149,99934,769 $150,000 to $199,99930,811 $200,000 or more
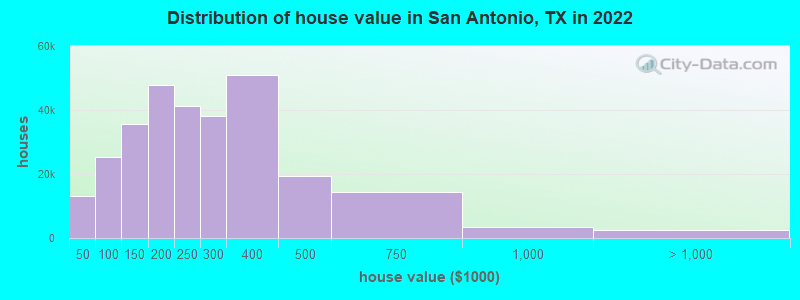
Home value of owner - occupied houses in 2022 in San Antonio, TX 3,506 Less than $10,0001,402 $10,000 to $14,9991,666 $15,000 to $19,9991,641 $20,000 to $24,9991,300 $25,000 to $29,999747 $30,000 to $34,999263 $35,000 to $39,9992,514 $40,000 to $49,9992,692 $50,000 to $59,9992,664 $60,000 to $69,9994,838 $70,000 to $79,9997,202 $80,000 to $89,9995,455 $90,000 to $99,99920,052 $100,000 to $124,99915,470 $125,000 to $149,99926,409 $150,000 to $174,99921,358 $175,000 to $199,99941,393 $200,000 to $249,99938,251 $250,000 to $299,99950,809 $300,000 to $399,99919,416 $400,000 to $499,99914,380 $500,000 to $749,9993,354 $750,000 to $999,9991,241 $1,000,000 to $1,499,999599 $1,500,000 to $1,999,999613 $2,000,000 or moreRent paid by renters in 2022 in San Antonio, TX 1,447 Less than $1001,288 $100 to $1493,479 $150 to $1993,247 $200 to $2491,870 $250 to $2993,282 $300 to $3491,545 $350 to $3991,896 $400 to $4491,488 $450 to $4992,887 $500 to $5492,688 $550 to $5995,858 $600 to $6497,328 $650 to $69911,237 $700 to $74910,408 $750 to $79927,401 $800 to $89928,004 $900 to $99957,465 $1,000 to $1,24942,064 $1,250 to $1,49933,794 $1,500 to $1,9995,825 $2,000 to $2,4991,810 $2,500 to $2,999722 $3,000 to $3,4991,145 $3,500 or more9,705 No cash rent
Percentage of workers working in this county: 95.3%Number of people working at home: 97,710 (13.6% of all workers )
Travel time to work (commute)
Less than 5 minutes: 11,0755 to 9 minutes: 46,54110 to 14 minutes: 72,57215 to 19 minutes: 109,02920 to 24 minutes: 107,59125 to 29 minutes: 62,30530 to 34 minutes: 98,45135 to 39 minutes: 18,92940 to 44 minutes: 19,47745 to 59 minutes: 38,76460 to 89 minutes: 22,66290 or more minutes: 12,913
Means of transportation to work:
Drove a car alone: 600,520 (70.0%)Carpooled: 110,455 (12.9%)Bus : 17,158 (2.0%)Taxi: 14,665 (1.7%)Bicycle: 2,163 (0.3%)Walked: 15,316 (1.8%)Worked at home: 97,710 (11.4%)
Unemployment by race in 2022
Unemployment rate for White non-Hispanic residents 3.8% Males3.2% FemalesUnemployment rate for Black residents 9.4% Males3.4% FemalesUnemployment rate for American Indian and Alaska Native residents 4.1% Males10.0% FemalesUnemployment rate for Asian residents 4.0% Males3.7% FemalesUnemployment rate for other race residents 5.4% Males4.6% FemalesUnemployment rate for two or more race residents 5.2% Males5.2% FemalesUnemployment rate for Hispanic or Latino residents 5.5% Males5.1% Females
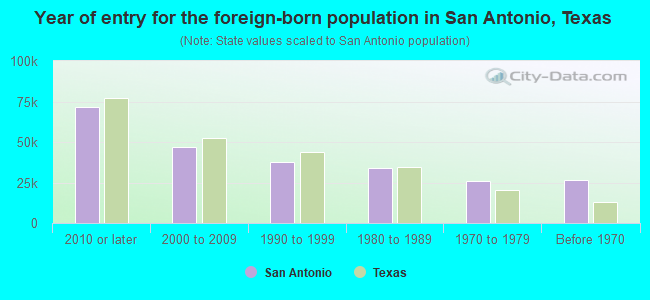
Year of entry for the foreign-born population in San Antonio, Texas
71,331 2010 or later 46,769 2000 to 2009 37,692 1990 to 1999 34,072 1980 to 1989 25,812 1970 to 1979 26,482 Before 1970
First ancestries reported:
American: 33,474 (3.6%)
German: 29,345 (3.1%)
English: 22,956 (2.4%)
Irish: 15,729 (1.7%)
Italian: 6,932 (0.7%)
European: 6,477 (0.7%)
Afghan: 6,406 (0.7%)
Scottish: 3,245 (0.3%)
Polish: 3,221 (0.3%)
African: 3,122 (0.3%)
French: 2,852 (0.3%)
Scotch-Irish: 2,424 (0.3%)
Nigerian: 1,363 (0.1%)
Jamaican: 1,284 (0.1%)
Iranian: 1,208 (0.1%)
Norwegian: 1,184 (0.1%)
Arab: 1,116 (0.1%)
Dutch: 1,076 (0.1%)
Iraqi: 1,036 (0.1%)
Russian: 989 (0.1%)
British: 973 (0.1%)
Eastern European: 953 (0.1%)
Czech: 917 (0.10%)
Swedish: 852 (0.09%)
Turkish: 730 (0.08%)
Lebanese: 715 (0.08%)
Portuguese: 707 (0.08%)
French Canadian: 680 (0.07%)
Romanian: 677 (0.07%)
Egyptian: 676 (0.07%)
Hungarian: 591 (0.06%)
Haitian: 588 (0.06%)
Canadian: 575 (0.06%)
Brazilian: 540 (0.06%)
Welsh: 498 (0.05%)
Scandinavian: 487 (0.05%)
Northern European: 444 (0.05%)
Greek: 439 (0.05%)
Palestinian: 416 (0.04%)
Danish: 369 (0.04%)
Somali: 354 (0.04%)
Czechoslovakian: 324 (0.03%)
Ukrainian: 312 (0.03%)
Jordanian: 280 (0.03%)
Austrian: 273 (0.03%)
Ghanaian: 263 (0.03%)
Guyanese: 263 (0.03%)
Swiss: 251 (0.03%)
Belgian: 183 (0.02%)
Sudanese: 176 (0.02%)
Basque: 144 (0.02%)
Israeli: 141 (0.01%)
Icelander: 133 (0.01%)
West Indian: 123 (0.01%)
Moroccan: 116 (0.01%)
Finnish: 109 (0.01%)
Syrian: 105 (0.01%)
Bulgarian: 102 (0.01%)
Slovak: 101 (0.01%)
Liberian: 93 (0.01%)
Yugoslavian: 93 (0.01%)
Ethiopian: 88 (0.01%)
Kenyan: 79 (0.01%)
Slovene: 79 (0.01%)
Croatian: 77 (0.01%)
Cajun: 77 (0.01%)
Australian: 77 (0.01%)
Lithuanian: 75 (0.01%)
Alsatian: 74 (0.01%)
Celtic: 72 (0.01%)
Trinidadian and Tobagonian: 68 (0.01%)
Armenian: 68 (0.01%)
Barbadian: 67 (0.01%)
South African: 58 (0.01%)
Slavic: 57 (0.01%)
Senegalese: 48 (0.01%)
Most common places of birth for foreign-born residents (%): Mexico San Antonio:
59.8% (127,640)Texas:
48.4% (2,411,723)
India San Antonio:
4.4% (9,320)Texas:
6.1% (306,347)
Afghanistan San Antonio:
3.2% (6,881)Texas:
0.3% (13,197)
Honduras San Antonio:
3.1% (6,697)Texas:
3.0% (147,182)
Philippines San Antonio:
2.5% (5,417)Texas:
2.1% (103,148)
El Salvador San Antonio:
1.9% (3,952)Texas:
4.5% (224,455)
China, excluding Hong Kong and Taiwan San Antonio:
1.6% (3,514)Texas:
2.3% (115,558)
Place of birth for U.S.-born residents:
This state: 949,052Other state: 277,785Northeast: 40,681Midwest: 68,433South: 83,153West: 85,518 81.5% of San Antonio residents lived in the same house 1 years ago.
Out of people who lived in different houses, 42.5% lived in this county.
Out of people who lived in different counties, 49.5% lived in Texas.
San Antonio:
81.5%State average:
85.7%
Education attainment for males 25 years and older:
No schooling: 12,862Nursery to 4th grade: 3,3935th and 6th grade: 9,4997th and 8th grade: 6,9389th grade: 8,80210th grade: 7,17811th grade: 9,38812th grade, no diploma: 8,225High school graduate (or equivalency): 125,782Less than 1 year of college: 30,005Some college more than 1 year, no degree: 76,287Associate degree: 40,374Bachelor's degree: 79,838Master's degree: 35,305Professional school degree: 10,942Doctorate degree: 5,973
Education attainment for females 25 years and older:
No schooling: 14,158Nursery to 4th grade: 3,1095th and 6th grade: 10,0007th and 8th grade: 6,8479th grade: 10,49610th grade: 6,02211th grade: 8,07212th grade, no diploma: 9,731High school graduate (or equivalency): 119,704Less than 1 year of college: 39,433Some college more than 1 year, no degree: 67,738Associate degree: 45,062Bachelor's degree: 93,161Master's degree: 40,270Professional school degree: 6,591Doctorate degree: 6,285
Housing units in structures:
One, detached: 361,139One, attached: 16,458Two: 11,1863 or 4: 28,0785 to 9: 46,89010 to 19: 58,56820 to 49: 28,56450 or more: 53,010Mobile homes: 7,557Boats, RVs, vans, etc.: 581Median worth of mobile homes: $44,600
Housing units lacking complete plumbing facilities in 2022: 1.3%Housing units lacking complete kitchen facilities in 2022: 1.9%House/condo owner moved in on average 13 years ago
Renter moved in on average 2 years ago
Private vs. public school enrollment:
Students in private schools in grades 1 to 8 (elementary and middle school): 15,739 Students in private schools in grades 9 to 12 (high school): 6,031 Students in private undergraduate colleges: 17,722