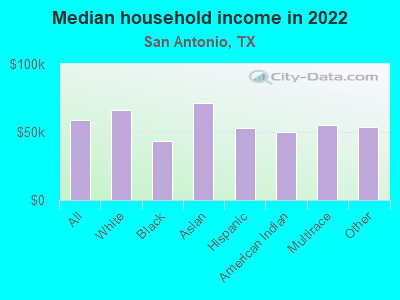
The median household income in San Antonio, TX in 2022 was $58,829, which was 22.9% less than the median annual income of $72,284 across the entire state of Texas. Compared to the median income of $36,214 in 2000 this represents an increase of 38.4%. The per capita income in 2022 was $30,790, which means an increase of 43.2% compared to 2000 when it was $17,487.
Whole page based on the data from 2000 / 2022 when the population of San Antonio, Texas was 1,144,646 / 1,472,904
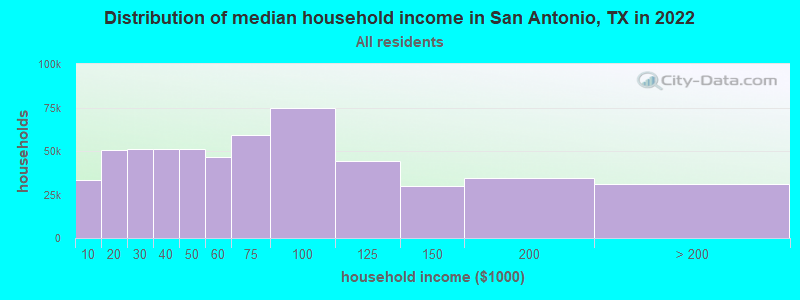
Income statistics for all residents
Median household income in San Antonio, TX in 2022:
San Antonio:
$58,829
State:
$72,284
Change in median household income between 2000 and 2022:
San Antonio, Texas:
+62.4%
State:
+81.0%
Number of households with income < $10k:
San Antonio:
6.0% (33,609)
Texas:
5.5% (611,011)
Number of households with income $10k - 20k:
San Antonio:
9.1% (50,678)
State:
6.7% (743,157)
Number of households with income $20k - 30k:
San Antonio:
9.1% (50,901)
State:
7.2% (803,381)
Number of households with income $30k - 40k:
San Antonio:
9.1% (50,975)
State:
7.8% (866,080)
Number of households with income $40k - 50k:
San Antonio:
9.2% (51,075)
State:
7.3% (810,440)
Number of households with income $50k - 60k:
San Antonio:
8.3% (46,300)
State:
7.2% (799,783)
Number of households with income $60k - 75k:
San Antonio:
10.6% (59,136)
Texas:
9.9% (1,095,384)
Number of households with income $75k - 100k:
San Antonio:
13.5% (74,947)
Texas:
12.8% (1,419,057)
Number of households with income $100k - 125k:
San Antonio:
7.9% (44,016)
State:
9.5% (1,054,577)
Number of households with income $125k - 150k:
San Antonio:
5.4% (29,901)
State:
6.7% (741,518)
Number of households with income $150k - 200k:
San Antonio:
6.2% (34,769)
State:
8.7% (961,776)
Number of households with income > $200k:
San Antonio:
5.5% (30,811)
State:
10.7% (1,181,544)
Aggregate household income in San Antonio in 2022: $43,907,513,200
Median family income in San Antonio in 2022:
San Antonio:
$70,532
State:
$86,267
Number of families with income < $10k:
San Antonio:
4.4% (14,952)
State:
4.0% (297,884)
Number of families with income $10k - 20k:
San Antonio:
6.2% (21,142)
Texas:
4.3% (324,514)
Number of families with income $20k - 30k:
San Antonio:
8.6% (29,199)
State:
5.8% (430,949)
Number of families with income $30k - 40k:
San Antonio:
7.1% (24,252)
State:
6.6% (493,535)
Number of families with income $40k - 50k:
San Antonio:
9.3% (31,434)
State:
6.7% (499,663)
Number of families with income $50k - 60k:
San Antonio:
7.3% (24,892)
State:
6.6% (492,203)
Number of families with income $60k - 75k:
San Antonio:
10.6% (35,969)
Texas:
9.5% (710,229)
Number of families with income $75k - 100k:
San Antonio:
14.4% (48,974)
State:
13.6% (1,015,480)
Number of families with income $100k - 125k:
San Antonio:
10.3% (35,041)
State:
10.7% (797,961)
Number of families with income $125k - 150k:
San Antonio:
6.6% (22,280)
Texas:
8.1% (602,985)
Number of families with income $150k - 200k:
San Antonio:
8.3% (28,053)
State:
10.7% (804,459)
Number of families with income > $200k:
San Antonio:
6.9% (23,300)
State:
13.5% (1,013,514)
Median non-family income in San Antonio in 2022:
San Antonio:
$40,623
State:
$45,999
Change in median non-family income between 2000 and 2022:
San Antonio, Texas:
+62.5%
State:
+79.5%
Median per capita income in San Antonio in 2022:
San Antonio:
$30,790
State:
$38,123
Change in median per capita income between 2000 and 2022:
San Antonio, Texas:
+76.1%
Texas:
+94.3%
Income statistics for White residents
Median household income in San Antonio, TX in 2022:
San Antonio:
$66,150
State:
$82,032
Change in median household income between 2000 and 2022:
San Antonio, Texas:
+67.6%
State:
+91.0%
Number of households with income < $10k:
San Antonio:
4.8% (11,903)
State:
4.7% (273,716)
Number of households with income $10k - 20k:
San Antonio:
8.0% (19,720)
State:
5.5% (322,702)
Number of households with income $20k - 30k:
San Antonio:
7.4% (18,103)
Texas:
6.2% (363,947)
Number of households with income $30k - 40k:
San Antonio:
8.4% (20,757)
State:
6.8% (399,275)
Number of households with income $40k - 50k:
San Antonio:
9.0% (22,067)
State:
6.5% (383,417)
Number of households with income $50k - 60k:
San Antonio:
8.0% (19,679)
Texas:
6.6% (388,535)
Number of households with income $60k - 75k:
San Antonio:
10.0% (24,690)
State:
9.7% (566,295)
Number of households with income $75k - 100k:
San Antonio:
13.9% (34,257)
Texas:
13.0% (760,276)
Number of households with income $100k - 125k:
San Antonio:
8.7% (21,408)
State:
10.2% (597,596)
Number of households with income $125k - 150k:
San Antonio:
6.3% (15,485)
State:
7.4% (436,830)
Number of households with income $150k - 200k:
San Antonio:
7.9% (19,293)
State:
9.9% (583,067)
Number of households with income > $200k:
San Antonio:
7.5% (18,398)
State:
13.5% (792,647)
Aggregate household income in San Antonio in 2022: $21,980,918,600
Median family income in San Antonio in 2022:
San Antonio:
$83,154
State:
$101,788
Number of families with income < $10k:
San Antonio:
3.3% (4,835)
Texas:
2.8% (108,142)
Number of families with income $10k - 20k:
San Antonio:
5.6% (8,189)
State:
2.9% (113,421)
Number of families with income $20k - 30k:
San Antonio:
5.8% (8,351)
Texas:
4.1% (157,688)
Number of families with income $30k - 40k:
San Antonio:
6.3% (9,180)
State:
5.2% (198,847)
Number of families with income $40k - 50k:
San Antonio:
8.0% (11,660)
State:
5.6% (216,490)
Number of families with income $50k - 60k:
San Antonio:
6.6% (9,598)
Texas:
5.7% (220,689)
Number of families with income $60k - 75k:
San Antonio:
9.5% (13,710)
State:
9.0% (346,106)
Number of families with income $75k - 100k:
San Antonio:
15.6% (22,681)
State:
13.7% (527,363)
Number of families with income $100k - 125k:
San Antonio:
11.0% (15,908)
State:
11.6% (448,411)
Number of families with income $125k - 150k:
San Antonio:
8.3% (11,968)
State:
9.2% (355,798)
Number of families with income $150k - 200k:
San Antonio:
10.3% (14,910)
State:
12.5% (480,185)
Number of families with income > $200k:
San Antonio:
9.7% (14,033)
Texas:
17.6% (677,490)
Median non-family income in San Antonio in 2022:
San Antonio:
$44,935
Texas:
$50,587
Change in median non-family income between 2000 and 2022:
San Antonio, Texas:
+71.5%
Texas:
+87.7%
Median per capita income in San Antonio in 2022:
San Antonio:
$37,341
State:
$47,740
Change in median per capita income between 2000 and 2022:
San Antonio, Texas:
+88.3%
Texas:
+114.3%
Income statistics for Black or African American residents
Median household income in San Antonio, TX in 2022:
San Antonio:
$43,039
State:
$55,759
Change in median household income between 2000 and 2022:
San Antonio, Texas:
+45.4%
State:
+90.3%
Number of households with income < $10k:
San Antonio:
11.3% (4,512)
Texas:
8.9% (126,378)
Number of households with income $10k - 20k:
San Antonio:
11.2% (4,459)
State:
9.9% (140,369)
Number of households with income $20k - 30k:
San Antonio:
11.4% (4,535)
State:
8.5% (120,639)
Number of households with income $30k - 40k:
San Antonio:
12.9% (5,166)
State:
9.7% (137,517)
Number of households with income $40k - 50k:
San Antonio:
9.0% (3,604)
State:
8.0% (112,973)
Number of households with income $50k - 60k:
San Antonio:
8.8% (3,501)
State:
8.3% (117,156)
Number of households with income $60k - 75k:
San Antonio:
8.9% (3,572)
State:
10.4% (147,462)
Number of households with income $75k - 100k:
San Antonio:
12.6% (5,026)
Texas:
11.5% (162,718)
Number of households with income $100k - 125k:
San Antonio:
6.0% (2,379)
Texas:
8.2% (115,829)
Number of households with income $125k - 150k:
San Antonio:
3.6% (1,418)
Texas:
4.9% (69,556)
Number of households with income $150k - 200k:
San Antonio:
2.7% (1,064)
State:
6.4% (90,701)
Number of households with income > $200k:
San Antonio:
1.8% (701)
State:
5.5% (77,988)
Aggregate household income in San Antonio in 2022: $2,206,760,300
Median family income in San Antonio in 2022:
San Antonio:
$47,373
Texas:
$69,134
Number of families with income < $10k:
San Antonio:
11.4% (2,281)
Texas:
6.8% (55,625)
Number of families with income $10k - 20k:
San Antonio:
6.2% (1,240)
State:
6.8% (55,300)
Number of families with income $20k - 30k:
San Antonio:
11.0% (2,212)
Texas:
7.1% (57,877)
Number of families with income $30k - 40k:
San Antonio:
10.1% (2,022)
State:
8.5% (68,776)
Number of families with income $40k - 50k:
San Antonio:
13.2% (2,645)
State:
7.1% (57,907)
Number of families with income $50k - 60k:
San Antonio:
8.0% (1,610)
State:
7.3% (59,511)
Number of families with income $60k - 75k:
San Antonio:
9.7% (1,946)
State:
10.1% (81,994)
Number of families with income $75k - 100k:
San Antonio:
9.1% (1,819)
State:
12.7% (103,723)
Number of families with income $100k - 125k:
San Antonio:
10.2% (2,055)
Texas:
9.4% (76,609)
Number of families with income $125k - 150k:
San Antonio:
4.3% (868)
State:
6.8% (55,615)
Number of families with income $150k - 200k:
San Antonio:
4.3% (853)
State:
9.4% (76,146)
Number of families with income > $200k:
San Antonio:
2.5% (499)
State:
7.9% (64,439)
Median non-family income in San Antonio in 2022:
San Antonio:
$31,976
State:
$40,133
Change in median non-family income between 2000 and 2022:
San Antonio, Texas:
+51.6%
Texas:
+102.2%
Median per capita income in San Antonio in 2022:
San Antonio:
$24,293
Texas:
$30,490
Change in median per capita income between 2000 and 2022:
San Antonio, Texas:
+53.1%
State:
+113.9%
Income statistics for Asian residents
Median household income in San Antonio, TX in 2022:
San Antonio:
$71,135
State:
$107,673
Change in median household income between 2000 and 2022:
San Antonio, Texas:
+83.3%
State:
+115.1%
Number of households with income < $10k:
San Antonio:
5.3% (873)
Texas:
5.2% (29,885)
Number of households with income $10k - 20k:
San Antonio:
3.6% (598)
State:
4.7% (27,044)
Number of households with income $20k - 30k:
San Antonio:
5.8% (951)
Texas:
4.1% (23,363)
Number of households with income $30k - 40k:
San Antonio:
9.9% (1,645)
State:
4.1% (23,309)
Number of households with income $40k - 50k:
San Antonio:
8.0% (1,328)
State:
5.2% (29,826)
Number of households with income $50k - 60k:
San Antonio:
8.6% (1,417)
State:
4.7% (26,512)
Number of households with income $60k - 75k:
San Antonio:
9.6% (1,585)
State:
6.5% (36,905)
Number of households with income $75k - 100k:
San Antonio:
16.7% (2,765)
State:
11.3% (64,350)
Number of households with income $100k - 125k:
San Antonio:
6.2% (1,020)
Texas:
11.4% (64,714)
Number of households with income $125k - 150k:
San Antonio:
5.3% (883)
State:
9.3% (52,719)
Number of households with income $150k - 200k:
San Antonio:
9.3% (1,531)
State:
12.5% (70,953)
Number of households with income > $200k:
San Antonio:
11.7% (1,937)
State:
21.1% (120,260)
Aggregate household income in San Antonio in 2022: $1,657,769,500
Median family income in San Antonio in 2022:
San Antonio:
$70,492
State:
$123,328
Number of families with income < $10k:
San Antonio:
0.7% (71)
Texas:
3.1% (13,567)
Number of families with income $10k - 20k:
San Antonio:
3.9% (422)
State:
3.0% (13,043)
Number of families with income $20k - 30k:
San Antonio:
6.2% (678)
State:
3.4% (14,738)
Number of families with income $30k - 40k:
San Antonio:
11.5% (1,252)
State:
3.4% (15,033)
Number of families with income $40k - 50k:
San Antonio:
10.8% (1,167)
State:
4.9% (21,622)
Number of families with income $50k - 60k:
San Antonio:
8.5% (921)
Texas:
4.7% (20,568)
Number of families with income $60k - 75k:
San Antonio:
10.2% (1,106)
Texas:
6.1% (26,637)
Number of families with income $75k - 100k:
San Antonio:
11.6% (1,257)
State:
10.7% (46,626)
Number of families with income $100k - 125k:
San Antonio:
8.5% (923)
Texas:
11.3% (49,585)
Number of families with income $125k - 150k:
San Antonio:
6.0% (649)
State:
9.8% (43,043)
Number of families with income $150k - 200k:
San Antonio:
9.5% (1,028)
State:
14.7% (64,203)
Number of families with income > $200k:
San Antonio:
12.7% (1,376)
State:
24.8% (108,511)
Median non-family income in San Antonio in 2022:
San Antonio:
$77,261
State:
$64,320
Median per capita income in San Antonio in 2022:
San Antonio:
$36,840
Texas:
$48,626
Change in median per capita income between 2000 and 2022:
San Antonio, Texas:
+80.4%
Texas:
+132.0%
Income statistics for Hispanic or Latino residents
Median household income in San Antonio, TX in 2022:
San Antonio:
$53,282
State:
$60,504
Change in median household income between 2000 and 2022:
San Antonio, Texas:
+74.9%
Texas:
+102.5%
Number of households with income < $10k:
San Antonio:
6.4% (21,576)
State:
5.8% (213,953)
Number of households with income $10k - 20k:
San Antonio:
10.2% (34,151)
State:
8.0% (297,456)
Number of households with income $20k - 30k:
San Antonio:
10.3% (34,622)
Texas:
9.2% (340,166)
Number of households with income $30k - 40k:
San Antonio:
9.5% (31,764)
State:
9.5% (354,336)
Number of households with income $40k - 50k:
San Antonio:
10.3% (34,783)
State:
8.8% (327,013)
Number of households with income $50k - 60k:
San Antonio:
8.8% (29,673)
State:
8.3% (308,818)
Number of households with income $60k - 75k:
San Antonio:
11.2% (37,606)
State:
10.9% (405,109)
Number of households with income $75k - 100k:
San Antonio:
12.9% (43,378)
Texas:
13.8% (511,639)
Number of households with income $100k - 125k:
San Antonio:
7.5% (25,270)
State:
8.6% (319,728)
Number of households with income $125k - 150k:
San Antonio:
4.5% (15,278)
Texas:
5.7% (210,932)
Number of households with income $150k - 200k:
San Antonio:
5.1% (17,191)
State:
6.4% (236,055)
Number of households with income > $200k:
San Antonio:
3.2% (10,792)
State:
5.1% (189,259)
Aggregate household income in San Antonio in 2022: $23,115,145,100
Median family income in San Antonio in 2022:
San Antonio:
$60,634
Texas:
$65,080
Number of families with income < $10k:
San Antonio:
5.2% (11,323)
State:
5.3% (147,493)
Number of families with income $10k - 20k:
San Antonio:
7.3% (15,927)
State:
6.3% (174,531)
Number of families with income $20k - 30k:
San Antonio:
10.6% (23,216)
Texas:
8.6% (238,528)
Number of families with income $30k - 40k:
San Antonio:
7.4% (16,263)
Texas:
9.1% (251,999)
Number of families with income $40k - 50k:
San Antonio:
10.6% (23,085)
Texas:
8.6% (240,188)
Number of families with income $50k - 60k:
San Antonio:
8.3% (18,078)
State:
8.0% (223,566)
Number of families with income $60k - 75k:
San Antonio:
11.7% (25,581)
State:
10.9% (302,688)
Number of families with income $75k - 100k:
San Antonio:
13.6% (29,711)
State:
14.3% (398,554)
Number of families with income $100k - 125k:
San Antonio:
9.5% (20,748)
Texas:
9.5% (264,007)
Number of families with income $125k - 150k:
San Antonio:
5.1% (11,198)
Texas:
6.2% (171,274)
Number of families with income $150k - 200k:
San Antonio:
6.6% (14,454)
State:
7.3% (202,259)
Number of families with income > $200k:
San Antonio:
4.0% (8,845)
State:
5.9% (165,129)
Median non-family income in San Antonio in 2022:
San Antonio:
$35,897
State:
$39,934
Change in median non-family income between 2000 and 2022:
San Antonio, Texas:
+84.9%
Texas:
+109.1%
Median per capita income in San Antonio in 2022:
San Antonio:
$24,973
State:
$24,862
Change in median per capita income between 2000 and 2022:
San Antonio, Texas:
+105.7%
Texas:
+130.8%
Income statistics for American Indian and Alaska Native residents
Median household income in San Antonio, TX in 2022:
San Antonio:
$50,101
State:
$65,765
Change in median household income between 2000 and 2022:
San Antonio, Texas:
+66.1%
Texas:
+88.3%
Number of households with income < $10k:
San Antonio:
7.7% (540)
State:
4.1% (3,398)
Number of households with income $10k - 20k:
San Antonio:
9.0% (631)
Texas:
8.3% (6,949)
Number of households with income $20k - 30k:
San Antonio:
6.5% (457)
State:
9.3% (7,742)
Number of households with income $30k - 40k:
San Antonio:
14.6% (1,026)
State:
9.1% (7,627)
Number of households with income $40k - 50k:
San Antonio:
12.2% (856)
State:
7.1% (5,922)
Number of households with income $50k - 60k:
San Antonio:
7.2% (505)
Texas:
8.1% (6,761)
Number of households with income $60k - 75k:
San Antonio:
10.0% (703)
State:
12.7% (10,588)
Number of households with income $75k - 100k:
San Antonio:
10.2% (717)
State:
13.0% (10,903)
Number of households with income $100k - 125k:
San Antonio:
12.6% (889)
Texas:
9.9% (8,256)
Number of households with income $125k - 150k:
San Antonio:
4.0% (279)
Texas:
5.2% (4,355)
Number of households with income $150k - 200k:
San Antonio:
6.1% (427)
State:
6.7% (5,623)
Number of households with income > $200k:
San Antonio:
0.0% (0)
Texas:
6.6% (5,522)
Aggregate household income in San Antonio in 2022: $444,217,600
Median family income in San Antonio in 2022:
San Antonio:
$58,500
State:
$72,369
Number of families with income < $10k:
San Antonio:
2.9% (133)
State:
2.7% (1,671)
Number of families with income $10k - 20k:
San Antonio:
7.4% (334)
Texas:
8.0% (4,891)
Number of families with income $20k - 30k:
San Antonio:
15.9% (719)
State:
7.3% (4,502)
Number of families with income $30k - 40k:
San Antonio:
7.5% (337)
Texas:
7.5% (4,592)
Number of families with income $40k - 50k:
San Antonio:
5.4% (246)
State:
7.9% (4,855)
Number of families with income $50k - 60k:
San Antonio:
12.9% (583)
Texas:
7.1% (4,347)
Number of families with income $60k - 75k:
San Antonio:
12.7% (573)
State:
12.1% (7,429)
Number of families with income $75k - 100k:
San Antonio:
13.4% (604)
State:
14.4% (8,852)
Number of families with income $100k - 125k:
San Antonio:
9.6% (432)
State:
11.4% (6,997)
Number of families with income $125k - 150k:
San Antonio:
4.6% (208)
Texas:
7.5% (4,609)
Number of families with income $150k - 200k:
San Antonio:
4.7% (213)
State:
6.9% (4,246)
Number of families with income > $200k:
San Antonio:
3.0% (133)
State:
7.0% (4,287)
Median non-family income in San Antonio in 2022:
San Antonio:
$38,732
Texas:
$40,351
Change in median non-family income between 2000 and 2022:
San Antonio, Texas:
+66.5%
State:
+71.9%
Median per capita income in San Antonio in 2022:
San Antonio:
$24,734
State:
$28,166
Change in median per capita income between 2000 and 2022:
San Antonio, Texas:
+77.4%
State:
+77.2%
Income statistics for Multirace residents
Median household income in San Antonio, TX in 2022:
San Antonio:
$55,257
State:
$62,748
Change in median household income between 2000 and 2022:
San Antonio, Texas:
+77.1%
State:
+92.3%
Number of households with income < $10k:
San Antonio:
6.2% (11,574)
State:
5.5% (122,324)
Number of households with income $10k - 20k:
San Antonio:
11.0% (20,487)
State:
8.2% (182,232)
Number of households with income $20k - 30k:
San Antonio:
10.5% (19,416)
Texas:
8.5% (189,456)
Number of households with income $30k - 40k:
San Antonio:
8.7% (16,095)
State:
8.9% (197,499)
Number of households with income $40k - 50k:
San Antonio:
9.0% (16,763)
State:
8.7% (191,735)
Number of households with income $50k - 60k:
San Antonio:
8.4% (15,615)
State:
8.0% (177,535)
Number of households with income $60k - 75k:
San Antonio:
11.0% (20,366)
Texas:
10.5% (232,479)
Number of households with income $75k - 100k:
San Antonio:
13.6% (25,196)
State:
13.1% (290,448)
Number of households with income $100k - 125k:
San Antonio:
7.3% (13,466)
Texas:
8.6% (191,595)
Number of households with income $125k - 150k:
San Antonio:
5.0% (9,260)
State:
6.0% (133,361)
Number of households with income $150k - 200k:
San Antonio:
5.5% (10,244)
State:
7.2% (159,195)
Number of households with income > $200k:
San Antonio:
3.8% (7,144)
State:
6.7% (148,064)
Aggregate household income in San Antonio in 2022: $13,340,254,100
Median family income in San Antonio in 2022:
San Antonio:
$64,154
State:
$69,780
Number of families with income < $10k:
San Antonio:
4.8% (5,730)
State:
4.4% (70,825)
Number of families with income $10k - 20k:
San Antonio:
7.2% (8,556)
Texas:
5.9% (95,279)
Number of families with income $20k - 30k:
San Antonio:
10.8% (12,845)
State:
7.8% (126,627)
Number of families with income $30k - 40k:
San Antonio:
6.6% (7,807)
State:
8.5% (137,626)
Number of families with income $40k - 50k:
San Antonio:
9.3% (11,012)
State:
8.4% (135,809)
Number of families with income $50k - 60k:
San Antonio:
7.7% (9,149)
State:
7.9% (127,739)
Number of families with income $60k - 75k:
San Antonio:
10.8% (12,859)
State:
10.5% (169,549)
Number of families with income $75k - 100k:
San Antonio:
15.0% (17,787)
State:
14.0% (226,284)
Number of families with income $100k - 125k:
San Antonio:
9.7% (11,532)
State:
9.5% (153,597)
Number of families with income $125k - 150k:
San Antonio:
5.5% (6,497)
State:
6.7% (107,900)
Number of families with income $150k - 200k:
San Antonio:
7.9% (9,321)
State:
8.5% (137,607)
Number of families with income > $200k:
San Antonio:
4.7% (5,623)
State:
7.9% (127,299)
Median non-family income in San Antonio in 2022:
San Antonio:
$35,178
Texas:
$40,634
Change in median non-family income between 2000 and 2022:
San Antonio, Texas:
+64.1%
State:
+77.2%
Median per capita income in San Antonio in 2022:
San Antonio:
$26,529
State:
$26,785
Change in median per capita income between 2000 and 2022:
San Antonio, Texas:
+110.3%
State:
+110.9%
Income statistics for other residents
Median household income in San Antonio, TX in 2022:
San Antonio:
$53,695
State:
$57,114
Number of households with income < $10k:
San Antonio:
6.8% (4,172)
Texas:
5.9% (54,162)
Number of households with income $10k - 20k:
San Antonio:
7.8% (4,783)
State:
6.8% (62,891)
Number of households with income $20k - 30k:
San Antonio:
12.1% (7,439)
Texas:
10.6% (97,294)
Number of households with income $30k - 40k:
San Antonio:
9.8% (6,024)
State:
10.8% (99,670)
Number of households with income $40k - 50k:
San Antonio:
10.5% (6,457)
State:
9.3% (85,548)
Number of households with income $50k - 60k:
San Antonio:
9.1% (5,583)
State:
9.0% (82,757)
Number of households with income $60k - 75k:
San Antonio:
13.0% (7,964)
State:
10.9% (100,326)
Number of households with income $75k - 100k:
San Antonio:
11.3% (6,938)
Texas:
14.0% (128,767)
Number of households with income $100k - 125k:
San Antonio:
7.7% (4,740)
State:
8.2% (75,218)
Number of households with income $125k - 150k:
San Antonio:
4.2% (2,576)
State:
4.8% (44,223)
Number of households with income $150k - 200k:
San Antonio:
3.3% (2,001)
Texas:
5.6% (51,376)
Number of households with income > $200k:
San Antonio:
4.2% (2,551)
State:
4.0% (36,393)
Aggregate household income in San Antonio in 2022: $4,174,551,900
Median family income in San Antonio in 2022:
San Antonio:
$60,061
State:
$60,064
Number of families with income < $10k:
San Antonio:
4.4% (1,762)
State:
6.8% (47,502)
Number of families with income $10k - 20k:
San Antonio:
5.9% (2,357)
Texas:
6.0% (41,763)
Number of families with income $20k - 30k:
San Antonio:
11.9% (4,763)
State:
9.9% (68,761)
Number of families with income $30k - 40k:
San Antonio:
9.0% (3,616)
Texas:
9.7% (67,685)
Number of families with income $40k - 50k:
San Antonio:
11.1% (4,439)
State:
9.0% (62,441)
Number of families with income $50k - 60k:
San Antonio:
7.7% (3,093)
State:
8.5% (59,321)
Number of families with income $60k - 75k:
San Antonio:
14.7% (5,907)
State:
11.2% (77,588)
Number of families with income $75k - 100k:
San Antonio:
12.7% (5,080)
State:
14.5% (101,032)
Number of families with income $100k - 125k:
San Antonio:
9.6% (3,855)
State:
8.8% (61,439)
Number of families with income $125k - 150k:
San Antonio:
5.0% (2,019)
State:
5.1% (35,727)
Number of families with income $150k - 200k:
San Antonio:
3.8% (1,539)
State:
5.9% (41,211)
Number of families with income > $200k:
San Antonio:
4.2% (1,689)
Texas:
4.5% (31,243)
Median non-family income in San Antonio in 2022:
San Antonio:
$36,896
State:
$38,690
Change in median non-family income between 2000 and 2022:
San Antonio, Texas:
+87.1%
State:
+90.2%
Median per capita income in San Antonio in 2022:
San Antonio:
$24,816
State:
$23,899
Change in median per capita income between 2000 and 2022:
San Antonio, Texas:
+132.7%
State:
+135.2%
Discuss San Antonio, Texas (TX) on our hugely popular Texas forum.