Oak Forest, IL (Illinois) Houses and Residents
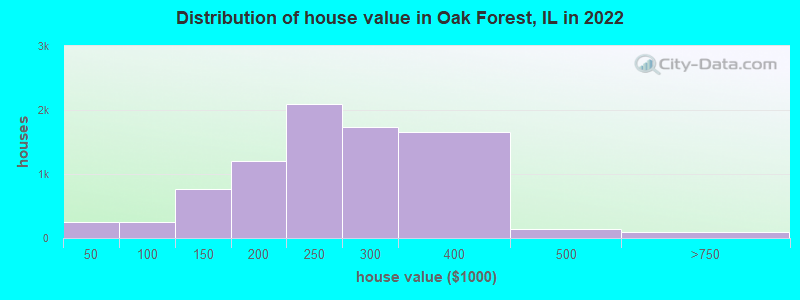
Estimated median house or condo value in 2022: $238,493 (it was $145,900 in 2000 )
Oak Forest:
$238,493Illinois:
$251,600
Lower value quartile - upper value quartile: $183,640 - $290,079Total population: 28,174 (Urban population: 27,955, Rural population: 0)
Houses: 10,537 (10,208 occupied: 8,296 owner occupied, 2,085 renter occupied )
% of renters here:
20%State:
33%
Housing density: 1,865 houses/condos per square mile
Median price asked for vacant for-sale houses and condos in 2022: $159,306.
Median contract rent in 2022: $1,132 (lower quartile is $898, upper quartile is $1,388)
Median rent asked for vacant for-rent units in 2022: $923
Median gross rent in Oak Forest, IL in 2022: $1,256
Housing units in Oak Forest with a mortgage: 5,560 (444 second mortgage, 0 home equity loan, 358 both second mortgage and home equity loan )Houses without a mortgage: 113
Median household income for houses/condos with a mortgage: $101,772
Median household income for apartments without a mortgage: $81,958
Median monthly housing costs: $1,435
Data:
Median house or condo value ($)
Median house or condo value ($ change since 2000)
Median house or condo value ($) - White
Median house or condo value ($) - Black or African American
Median house or condo value ($) - Asian
Median house or condo value ($) - Hispanic or Latino
Median house or condo value ($) - American Indian and Alaska Native
Median house or condo value ($) - Multirace
Median house or condo value ($) - Other Race
Median price asked for mobile homes ($)
Household density (households per square mile)
Mean house or condo value by units in structure - 1, detached ($)
Mean house or condo value by units in structure - 1, attached ($)
Mean house or condo value by units in structure - 2 ($)
Mean house or condo value by units in structure by units in structure - 3 or 4 ($)
Mean house or condo value by units in structure - 5 or more ($)
Mean house or condo value by units in structure - Boat, RV, van, etc. ($)
Mean house or condo value by units in structure - Mobile home ($)
Median contract rent ($)
Median contract rent - Lower quartile ($)
Median contract rent - Upper quartile ($)
Median gross rent ($)
Urban houses (%)
Rural houses (%)
Houses occupied (%)
Houses occupied (% change since 2000)
Houses owner occupied (%)
Houses owner occupied (% change since 2000)
Houses renter occupied (%)
Houses renter occupied (% change since 2000)
Vacant housing units - For rent (%)
Vacant housing units - For rent (% change since 2000)
Vacant housing units - For sale only (%)
Vacant housing units - For sale only (% change since 2000)
Vacant housing units - Rented or sold, not occupied (%)
Vacant housing units - Rented or sold, not occupied (% change since 2000)
Vacant housing units - For seasonal, recreational, or occasional use (%)
Vacant housing units - For seasonal, recreational, or occasional use (% change since 2000)
Vacant housing units - For migrant workers (%)
Vacant housing units - For migrant workers (% change since 2000)
Vacant housing units - Other vacant (%)
Vacant housing units - Other vacant (% change since 2000)
Median monthly housing costs ($)
Median household income for houses/condos with a mortgage ($)
Median household income for houses/condos without a mortgage ($)
Median household income ($)
Median household income ($) - White
Median household income ($) - Black or African American
Median household income ($) - Asian
Median household income ($) - Hispanic or Latino
Median household income ($) - American Indian and Alaska Native
Median household income ($) - Multirace
Median household income ($) - Other Race
Mortgage status - with mortgage (%)
Mortgage status - with second mortgage (%)
Mortgage status - with home equity loan (%)
Mortgage status - with both second mortgage and home equity loan (%)
Mortgage status - without a mortgage (%)
Median year house/condo built
Median year apartment built
Household type by relationship - Male householder living alone (%)
Household type by relationship - Male householder not living alone (%)
Household type by relationship - Female householder living alone (%)
Household type by relationship - Female householder not living alone (%)
Household type by relationship - Opposite-Sex spouse (%)
Household type by relationship - Same-Sex spouse (%)
Household type by relationship - Opposite-Sex unmarried partner (%)
Household type by relationship - Same-Sex unmarried partner (%)
Household type by relationship - In group quarters (%)
Size of family households - 2-person household (%)
Size of family households - 3-person household (%)
Size of family households - 4-person household (%)
Size of family households - 5-person household (%)
Size of family households - 6-person household (%)
Size of family households - 7-or-more-person household (%)
Size of nonfamily households - 1-person household (%)
Size of nonfamily households - 2-person household (%)
Size of nonfamily households - 3-person household (%)
Size of nonfamily households - 4-person household (%)
Size of nonfamily households - 5-person household (%)
Size of nonfamily households - 6-person household (%)
Size of nonfamily households - 7-or-moreperson household (%)
Year house built - Built 2010 or later (%)
Year house built - Built 2000 to 2009 (%)
Year house built - Built 1990 to 1999 (%)
Year house built - Built 1980 to 1989 (%)
Year house built - Built 1970 to 1979 (%)
Year house built - Built 1960 to 1969 (%)
Year house built - Built 1950 to 1959 (%)
Year house built - Built 1940 to 1949 (%)
Year house built - Built 1939 or earlier (%)
Median number of rooms in houses and condos
Median number of rooms in apartments
Median number of bedrooms in owner occupied houses
Mean number of bedrooms in owner occupied houses
Median number of bedrooms in renter occupied houses
Mean number of bedrooms in renter occupied houses
Median number of vehichles in owner occupied houses
Mean number of vehichles in owner occupied houses
Median number of vehichles in renter occupied houses
Mean number of vehichles in renter occupied houses
Rooms in owner-occupied houses - 1 room (%)
Rooms in owner-occupied houses - 2 rooms (%)
Rooms in owner-occupied houses - 3 rooms (%)
Rooms in owner-occupied houses - 4 rooms (%)
Rooms in owner-occupied houses - 5 rooms (%)
Rooms in owner-occupied houses - 6 rooms (%)
Rooms in owner-occupied houses - 7 rooms (%)
Rooms in owner-occupied houses - 8 rooms (%)
Rooms in owner-occupied houses - 9+ rooms (%)
Rooms in renter-occupied houses - 1 room (%)
Rooms in renter-occupied houses - 2 rooms (%)
Rooms in renter-occupied houses - 3 rooms (%)
Rooms in renter-occupied houses - 4 rooms (%)
Rooms in renter-occupied houses - 5 rooms (%)
Rooms in renter-occupied houses - 6 rooms (%)
Rooms in renter-occupied houses - 7 rooms (%)
Rooms in renter-occupied houses - 8 rooms (%)
Rooms in renter-occupied houses - 9+ rooms (%)
Bedrooms in owner-occupied houses - no bedrooms (%)
Bedrooms in owner-occupied houses - 1 bedroom (%)
Bedrooms in owner-occupied houses - 2 bedrooms (%)
Bedrooms in owner-occupied houses - 3 bedrooms (%)
Bedrooms in owner-occupied houses - 4 bedrooms (%)
Bedrooms in owner-occupied houses - 5+ bedrooms (%)
Bedrooms in renter-occupied houses - no bedrooms (%)
Bedrooms in renter-occupied houses - 1 bedroom (%)
Bedrooms in renter-occupied houses - 2 bedrooms (%)
Bedrooms in renter-occupied houses - 3 bedrooms (%)
Bedrooms in renter-occupied houses - 4 bedrooms (%)
Bedrooms in renter-occupied houses - 5+ bedrooms (%)
Vehicles available in owner-occupied houses - no vehicle available (%)
Vehicles available in owner-occupied houses - 1 vehicle available(%)
Vehicles available in owner-occupied houses - 2 Vehicles available (%)
Vehicles available in owner-occupied houses - 3 Vehicles available (%)
Vehicles available in owner-occupied houses - 4 Vehicles available (%)
Vehicles available in owner-occupied houses - 5+ Vehicles available (%)
Vehicles available in renter-occupied houses - no vehicle available (%)
Vehicles available in renter-occupied houses - 1 vehicle available (%)
Vehicles available in renter-occupied houses - 2 Vehicles available (%)
Vehicles available in renter-occupied houses - 3 Vehicles available (%)
Vehicles available in renter-occupied houses - 4 Vehicles available (%)
Vehicles available in renter-occupied houses - 5+ Vehicles available (%)
Housing units in structures - 1, detached (%)
Housing units in structures - 1, attached (%)
Housing units in structures - 2 (%)
Housing units in structures - 3 or 4 (%)
Housing units in structures - 5 to 9 (%)
Housing units in structures - 10 to 19 (%)
Housing units in structures - 20 to 49 (%)
Housing units in structures - 50 or more (%)
Housing units in structures - Mobile home (%)
Housing units in structures - Boat, RV, van, etc. (%)
Housing units in structures - Owners - 1, detached (%)
Housing units in structures - Owners - 1, attached (%)
Housing units in structures - Owners - 2 (%)
Housing units in structures - Owners - 3 or 4 (%)
Housing units in structures - Owners - 5 to 9 (%)
Housing units in structures - Owners - 10 to 19 (%)
Housing units in structures - Owners - 20 to 49 (%)
Housing units in structures - Owners - 50 or more (%)
Housing units in structures - Owners - Mobile home (%)
Housing units in structures - Owners - Boat, RV, van, etc. (%)
Housing units in structures - Renters - 1, detached (%)
Housing units in structures - Renters - 1, attached (%)
Housing units in structures - Renters - 2 (%)
Housing units in structures - Renters - 3 or 4 (%)
Housing units in structures - Renters - 5 to 9 (%)
Housing units in structures - Renters - 10 to 19 (%)
Housing units in structures - Renters - 20 to 49 (%)
Housing units in structures - Renters - 50 or more (%)
Housing units in structures - Renters - Mobile home (%)
Housing units in structures - Renters - Boat, RV, van, etc. (%)
House/condo owner moved in on average (years ago)
Renter moved in on average (years ago)
Year householder moved into unit - Moved in 1999 to March 2000 (%)
Year householder moved into unit - Moved in 1999 to March 2000 (%) - White
Year householder moved into unit - Moved in 1999 to March 2000 (%) - Black or African American
Year householder moved into unit - Moved in 1999 to March 2000 (%) - Asian
Year householder moved into unit - Moved in 1999 to March 2000 (%) - Hispanic or Latino
Year householder moved into unit - Moved in 1999 to March 2000 (%) - American Indian and Alaska Native
Year householder moved into unit - Moved in 1999 to March 2000 (%) - Multirace
Year householder moved into unit - Moved in 1999 to March 2000 (%) - Other Race
Year householder moved into unit - Moved in 1995 to 1998 (%)
Year householder moved into unit - Moved in 1995 to 1998 (%) - White
Year householder moved into unit - Moved in 1995 to 1998 (%) - Black or African American
Year householder moved into unit - Moved in 1995 to 1998 (%) - Asian
Year householder moved into unit - Moved in 1995 to 1998 (%) - Hispanic or Latino
Year householder moved into unit - Moved in 1995 to 1998 (%) - American Indian and Alaska Native
Year householder moved into unit - Moved in 1995 to 1998 (%) - Multirace
Year householder moved into unit - Moved in 1995 to 1998 (%) - Other Race
Year householder moved into unit - Moved in 1990 to 1994 (%)
Year householder moved into unit - Moved in 1990 to 1994 (%) - White
Year householder moved into unit - Moved in 1990 to 1994 (%) - Black or African American
Year householder moved into unit - Moved in 1990 to 1994 (%) - Asian
Year householder moved into unit - Moved in 1990 to 1994 (%) - Hispanic or Latino
Year householder moved into unit - Moved in 1990 to 1994 (%) - American Indian and Alaska Native
Year householder moved into unit - Moved in 1990 to 1994 (%) - Multirace
Year householder moved into unit - Moved in 1990 to 1994 (%) - Other Race
Year householder moved into unit - Moved in 1980 to 1989 (%)
Year householder moved into unit - Moved in 1980 to 1989 (%) - White
Year householder moved into unit - Moved in 1980 to 1989 (%) - Black or African American
Year householder moved into unit - Moved in 1980 to 1989 (%) - Asian
Year householder moved into unit - Moved in 1980 to 1989 (%) - Hispanic or Latino
Year householder moved into unit - Moved in 1980 to 1989 (%) - American Indian and Alaska Native
Year householder moved into unit - Moved in 1980 to 1989 (%) - Multirace
Year householder moved into unit - Moved in 1980 to 1989 (%) - Other Race
Year householder moved into unit - Moved in 1970 to 1979 (%)
Year householder moved into unit - Moved in 1970 to 1979 (%) - White
Year householder moved into unit - Moved in 1970 to 1979 (%) - Black or African American
Year householder moved into unit - Moved in 1970 to 1979 (%) - Asian
Year householder moved into unit - Moved in 1970 to 1979 (%) - Hispanic or Latino
Year householder moved into unit - Moved in 1970 to 1979 (%) - American Indian and Alaska Native
Year householder moved into unit - Moved in 1970 to 1979 (%) - Multirace
Year householder moved into unit - Moved in 1970 to 1979 (%) - Other Race
Year householder moved into unit - Moved in 1969 or earlier (%)
Year householder moved into unit - Moved in 1969 or earlier (%) - White
Year householder moved into unit - Moved in 1969 or earlier (%) - Black or African American
Year householder moved into unit - Moved in 1969 or earlier (%) - Asian
Year householder moved into unit - Moved in 1969 or earlier (%) - Hispanic or Latino
Year householder moved into unit - Moved in 1969 or earlier (%) - American Indian and Alaska Native
Year householder moved into unit - Moved in 1969 or earlier (%) - Multirace
Year householder moved into unit - Moved in 1969 or earlier (%) - Other Race
Housing units lacking complete plumbing facilities (%)
Housing units lacking complete kitchen facilities (%)
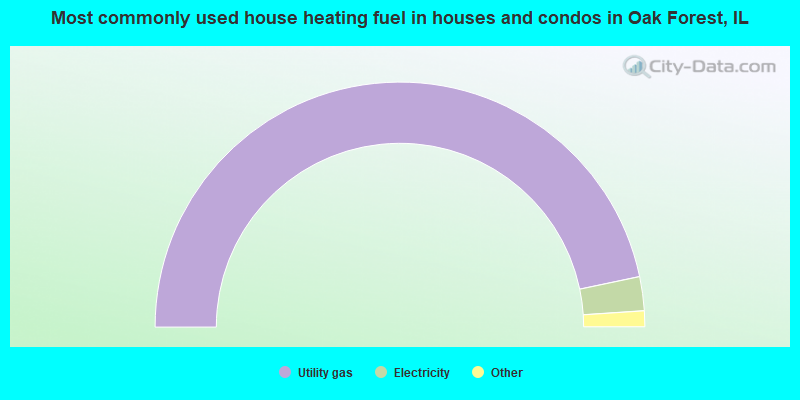
House heating fuel used in houses and condos - Utility gas (%)
House heating fuel used in houses and condos - Bottled, tank, or LP gas (%)
House heating fuel used in houses and condos - Electricity (%)
House heating fuel used in houses and condos - Fuel oil, kerosene, etc. (%)
House heating fuel used in houses and condos - Coal or coke (%)
House heating fuel used in houses and condos - Wood (%)
House heating fuel used in houses and condos - Solar energy (%)
House heating fuel used in houses and condos - Other fuel (%)
House heating fuel used in houses and condos - No fuel used (%)
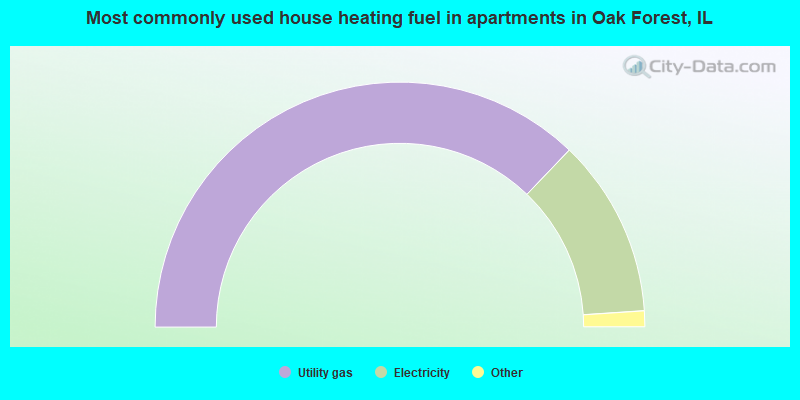
House heating fuel used in apartments - Utility gas (%)
House heating fuel used in apartments - Bottled, tank, or LP gas (%)
House heating fuel used in apartments - Electricity (%)
House heating fuel used in apartments - Fuel oil, kerosene, etc. (%)
House heating fuel used in apartments - Coal or coke (%)
House heating fuel used in apartments - Wood (%)
House heating fuel used in apartments - Solar energy (%)
House heating fuel used in apartments - Other fuel (%)
House heating fuel used in apartments - No fuel used (%)
Median year house/condo built: 1974Median year apartment built: 1981Household type by relationship:
Households: 26,594
Male householders: 5,174 (1,032 living alone ), Female householders: 4,764 (1,255 living alone )5,817 spouses (5,770 opposite-sex spouses ), 543 unmarried partners , (543 opposite-sex unmarried partners ), 8,113 children (7,371 natural , 165 adopted , 576 stepchildren ), 525 grandchildren , 249 brothers or sisters , 264 parents , 13 foster children , 611 other relatives , 468 non-relatives In group quarters: 47
Size of family households: 2,998 2-persons , 1,865 3-persons , 1,313 4-persons , 690 5-persons , 229 6-persons , 162 7-or-more-persons .
Size of nonfamily households: 2,457 1-person , 574 2-persons , 17 3-persons .
3,697 married couples with children. single-parent households (521 men , 783 women ).
81.8% of residents of Oak Forest speak English at home. of residents speak Spanish at home (61% speak English very well , 25% speak English well , 12% speak English not well , 2% don't speak English at all ).of residents speak other Indo-European language at home (62% speak English very well , 19% speak English well , 13% speak English not well , 5% don't speak English at all ).of residents speak Asian or Pacific Island language at home (49% speak English very well , 43% speak English well , 8% speak English not well ).of residents speak other language at home (67% speak English very well , 33% speak English well ).
Foreign born population: 2,830 (10.6%)of them are naturalized citizens )
Median number of rooms in houses and condos:
Median number of rooms in apartments
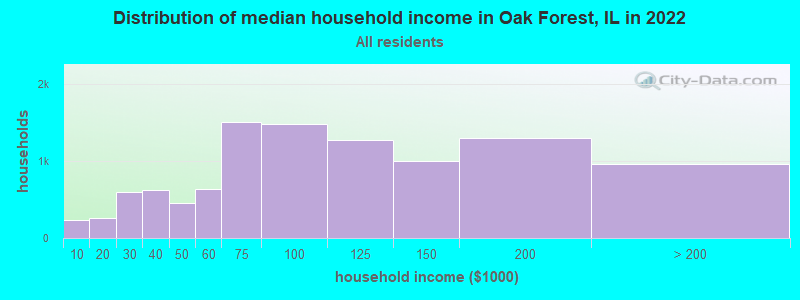
Oak Forest, IL household income distribution 238 Less than $10,000266 $10,000 to $19,999593 $20,000 to $29,999624 $30,000 to $39,999453 $40,000 to $49,999640 $50,000 to $59,9991,510 $60,000 to $74,9991,483 $75,000 to $99,9991,273 $100,000 to $124,999999 $125,000 to $149,9991,302 $150,000 to $199,999962 $200,000 or more
Home value of owner - occupied houses in 2022 in Oak Forest, IL 44 Less than $10,00061 $10,000 to $14,99928 $20,000 to $24,99954 $25,000 to $29,99948 $30,000 to $34,9995 $40,000 to $49,9998 $50,000 to $59,99919 $60,000 to $69,99944 $70,000 to $79,999131 $80,000 to $89,99943 $90,000 to $99,999356 $100,000 to $124,999401 $125,000 to $149,999660 $150,000 to $174,999548 $175,000 to $199,9992,093 $200,000 to $249,9991,738 $250,000 to $299,9991,657 $300,000 to $399,999142 $400,000 to $499,99975 $500,000 to $749,99911 $750,000 to $999,999Rent paid by renters in 2022 in Oak Forest, IL 20 $150 to $19921 $200 to $24912 $450 to $49912 $600 to $649105 $650 to $69948 $700 to $749300 $800 to $899115 $900 to $999636 $1,000 to $1,249338 $1,250 to $1,499218 $1,500 to $1,999100 $2,000 to $2,499189 No cash rent
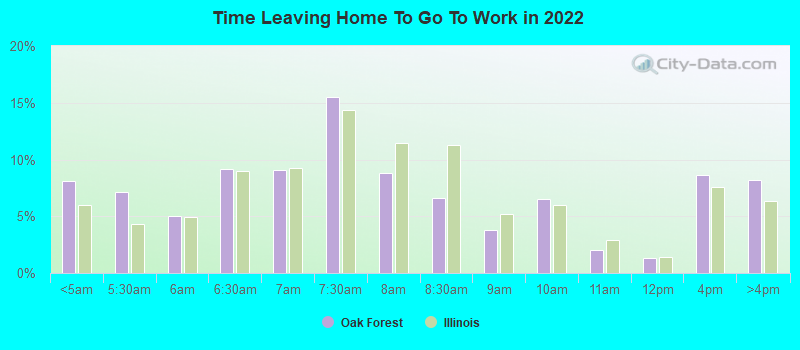
Percentage of workers working in this county: 83.6%Number of people working at home: 1,929 (13.6% of all workers )
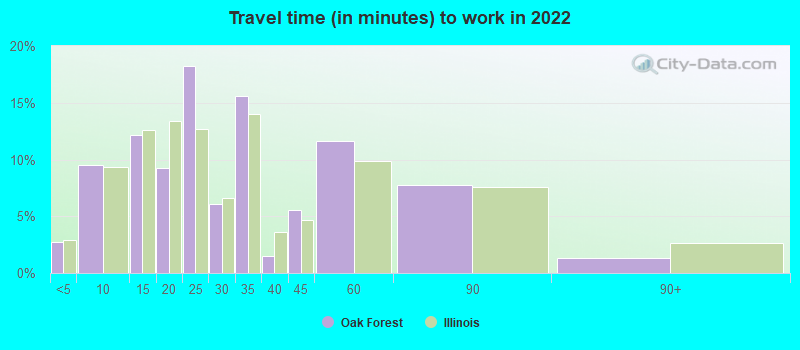
Travel time to work (commute)
Less than 5 minutes: 2035 to 9 minutes: 91510 to 14 minutes: 79515 to 19 minutes: 1,53520 to 24 minutes: 2,03625 to 29 minutes: 61630 to 34 minutes: 1,75535 to 39 minutes: 41140 to 44 minutes: 58045 to 59 minutes: 1,13960 to 89 minutes: 1,66190 or more minutes: 370
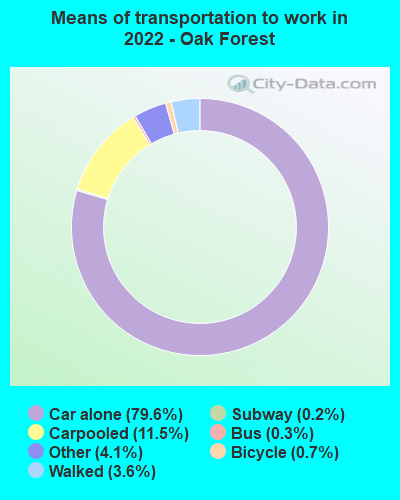
Means of transportation to work:
Drove a car alone: 4,030 (60.7%)Carpooled: 623 (9.4%)Bus : 15 (0.2%)Long-distance train or commuter rail : 5 (0.1%)Taxi: 210 (3.2%)Bicycle: 36 (0.5%)Walked: 187 (2.8%)Worked at home: 1,929 (29.0%)
Unemployment by race in 2022
Unemployment rate for White non-Hispanic residents 2.7% Males1.8% FemalesUnemployment rate for Black residents 1.4% Males12.7% FemalesUnemployment rate for Asian residents 15.8% Males5.1% FemalesUnemployment rate for other race residents 2.1% Males15.9% FemalesUnemployment rate for two or more race residents 2.1% Males6.1% FemalesUnemployment rate for Hispanic or Latino residents 2.5% Males9.1% Females
Year of entry for the foreign-born population in Oak Forest, Illinois
1,382 2010 or later 261 2000 to 2009 709 1990 to 1999 403 1980 to 1989 186 1970 to 1979 411 Before 1970
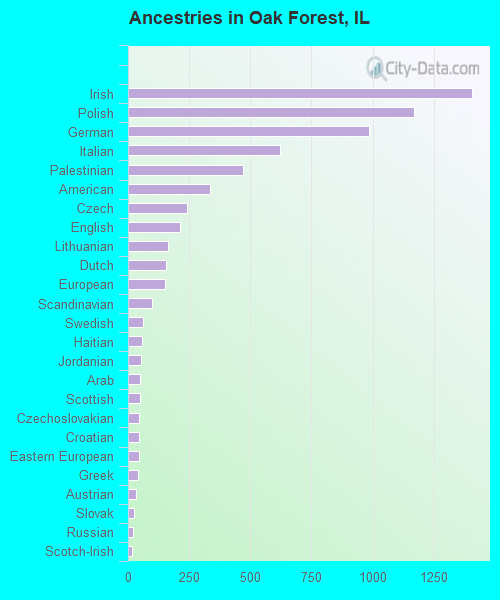
First ancestries reported:
Irish: 1,406 (13.0%)
Polish: 1,170 (10.8%)
German: 985 (9.1%)
Italian: 622 (5.7%)
Palestinian: 470 (4.3%)
American: 334 (3.1%)
Czech: 240 (2.2%)
English: 211 (1.9%)
Lithuanian: 162 (1.5%)
Dutch: 154 (1.4%)
European: 151 (1.4%)
Scandinavian: 99 (0.9%)
Swedish: 61 (0.6%)
Haitian: 56 (0.5%)
Jordanian: 55 (0.5%)
Arab: 49 (0.5%)
Scottish: 48 (0.4%)
Czechoslovakian: 47 (0.4%)
Croatian: 46 (0.4%)
Eastern European: 43 (0.4%)
Greek: 39 (0.4%)
Austrian: 34 (0.3%)
Slovak: 25 (0.2%)
Russian: 20 (0.2%)
Scotch-Irish: 18 (0.2%)
Danish: 17 (0.2%)
African: 17 (0.2%)
Finnish: 14 (0.1%)
Norwegian: 14 (0.1%)
Swiss: 10 (0.09%)
Hungarian: 5 (0.05%)
British: 2 (0.02%) Most common places of birth for foreign-born residents (%): Mexico Oak Forest:
29.8% (843)Illinois:
34.7% (626,958)
India Oak Forest:
27.4% (776)Illinois:
9.2% (166,409)
Philippines Oak Forest:
10.6% (299)Illinois:
5.2% (93,003)
Poland Oak Forest:
5.8% (165)Illinois:
6.9% (124,474)
Jordan Oak Forest:
4.8% (137)Illinois:
0.5% (8,827)
Nigeria Oak Forest:
3.4% (97)Illinois:
1.2% (21,186)
Italy Oak Forest:
1.7% (48)Illinois:
0.9% (15,679)
Pakistan Oak Forest:
1.6% (46)Illinois:
1.6% (29,519)
Place of birth for U.S.-born residents:
This state: 21,006Other state: 2,290Northeast: 348Midwest: 1,192South: 468West: 301 90.4% of Oak Forest residents lived in the same house 1 years ago.
Out of people who lived in different houses, 43.9% lived in this county.
Out of people who lived in different counties, 23.1% lived in Illinois.
Oak Forest:
90.4%State average:
88.3%
Education attainment for males 25 years and older:
No schooling: 125Nursery to 4th grade: 255th and 6th grade: 247th and 8th grade: 389th grade: 2110th grade: 8511th grade: 7712th grade, no diploma: 264High school graduate (or equivalency): 2,738Less than 1 year of college: 840Some college more than 1 year, no degree: 1,220Associate degree: 690Bachelor's degree: 2,173Master's degree: 519Professional school degree: 128Doctorate degree: 43
Education attainment for females 25 years and older:
No schooling: 155Nursery to 4th grade: 35th and 6th grade: 07th and 8th grade: 799th grade: 6710th grade: 7911th grade: 3212th grade, no diploma: 219High school graduate (or equivalency): 2,291Less than 1 year of college: 917Some college more than 1 year, no degree: 1,563Associate degree: 1,122Bachelor's degree: 2,042Master's degree: 1,025Professional school degree: 53Doctorate degree: 74
Housing units in structures:
One, detached: 7,609One, attached: 391Two: 373 or 4: 1645 to 9: 82310 to 19: 1,13220 to 49: 27250 or more: 106Housing units lacking complete plumbing facilities in 2022: 0.6%Housing units lacking complete kitchen facilities in 2022: 0.7%House/condo owner moved in on average 17 years ago
Renter moved in on average 3 years ago
Private vs. public school enrollment:
Students in private schools in grades 1 to 8 (elementary and middle school): 267 Students in private schools in grades 9 to 12 (high school): 47 Students in private undergraduate colleges: 350