Races in Oak Forest, Illinois (IL) Detailed Stats
Data:
Races - White alone (%)
Races - White alone (% change since 2000)
Races - Black alone (%)
Races - Black alone (% change since 2000)
Races - American Indian alone (%)
Races - American Indian alone (% change since 2000)
Races - Asian alone (%)
Races - Asian alone (% change since 2000)
Races - Hispanic (%)
Races - Hispanic (% change since 2000)
Races - Native Hawaiian and Other Pacific Islander alone (%)
Races - Native Hawaiian and Other Pacific Islander alone (% change since 2000)
Races - Two or more races(%)
Races - Two or more races(% change since 2000)
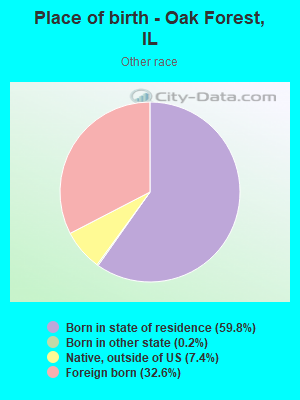
Races - Other race alone (%)
Races - Other race alone (% change since 2000)
Racial diversity
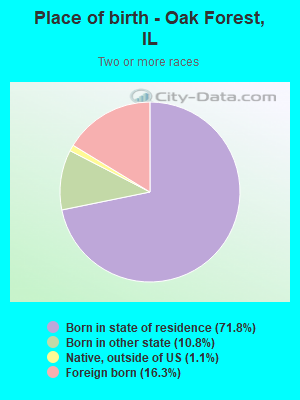
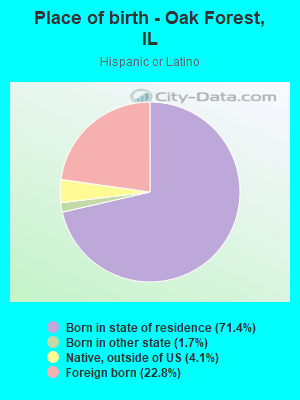
Place of birth - Born in state of residence (%)
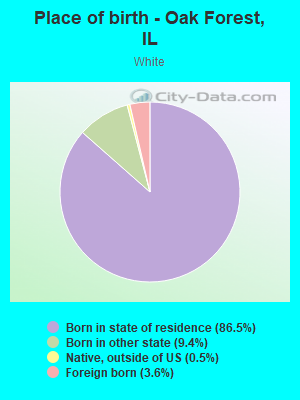
Place of birth - Born in state of residence (%) - White
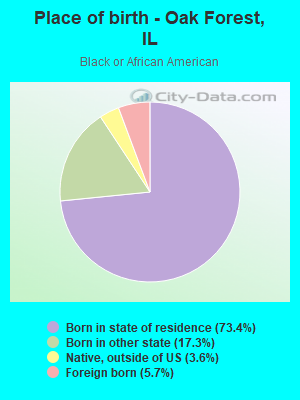
Place of birth - Born in state of residence (%) - Black or African American
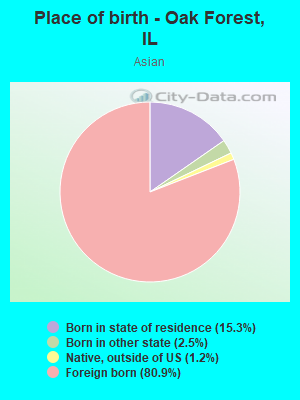
Place of birth - Born in state of residence (%) - Asian
Place of birth - Born in state of residence (%) - Hispanic or Latino
Place of birth - Born in state of residence (%) - American Indian and Alaska Native
Place of birth - Born in state of residence (%) - Multirace
Place of birth - Born in state of residence (%) - Other Race
Place of birth - Born in other state (%)
Place of birth - Born in other state (%) - White
Place of birth - Born in other state (%) - Black or African American
Place of birth - Born in other state (%) - Asian
Place of birth - Born in other state (%) - Hispanic or Latino
Place of birth - Born in other state (%) - American Indian and Alaska Native
Place of birth - Born in other state (%) - Multirace
Place of birth - Born in other state (%) - Other Race
Place of birth - Native, outside of US (%)
Place of birth - Native, outside of US (%) - White
Place of birth - Native, outside of US (%) - Black or African American
Place of birth - Native, outside of US (%) - Asian
Place of birth - Native, outside of US (%) - Hispanic or Latino
Place of birth - Native, outside of US (%) - American Indian and Alaska Native
Place of birth - Native, outside of US (%) - Multirace
Place of birth - Native, outside of US (%) - Other Race
Place of birth - Foreign born (%)
Place of birth - Foreign born (%) - White
Place of birth - Foreign born (%) - Black or African American
Place of birth - Foreign born (%) - Asian
Place of birth - Foreign born (%) - Hispanic or Latino
Place of birth - Foreign born (%) - American Indian and Alaska Native
Place of birth - Foreign born (%) - Multirace
Place of birth - Foreign born (%) - Other Race
Residents speaking English at home (%)
Residents speaking English at home - Born in the United States (%)
Residents speaking English at home - Native, born elsewhere (%)
Residents speaking English at home - Foreign born (%)
Residents speaking Spanish at home (%)
Residents speaking Spanish at home - Born in the United States (%)
Residents speaking Spanish at home - Native, born elsewhere (%)
Residents speaking Spanish at home - Foreign born (%)
Residents speaking other language at home (%)
Residents speaking other language at home - Born in the United States (%)
Residents speaking other language at home - Native, born elsewhere (%)
Residents speaking other language at home - Foreign born (%)
Marital status - Never married (%)
Marital status - Now married (%)
Marital status - Separated (%)
Marital status - Widowed (%)
Marital status - Divorced (%)
Ancestries Reported - Arab (%)
Ancestries Reported - Czech (%)
Ancestries Reported - Danish (%)
Ancestries Reported - Dutch (%)
Ancestries Reported - English (%)
Ancestries Reported - French (%)
Ancestries Reported - French Canadian (%)
Ancestries Reported - German (%)
Ancestries Reported - Greek (%)
Ancestries Reported - Hungarian (%)
Ancestries Reported - Irish (%)
Ancestries Reported - Italian (%)
Ancestries Reported - Lithuanian (%)
Ancestries Reported - Norwegian (%)
Ancestries Reported - Polish (%)
Ancestries Reported - Portuguese (%)
Ancestries Reported - Russian (%)
Ancestries Reported - Scotch-Irish (%)
Ancestries Reported - Scottish (%)
Ancestries Reported - Slovak (%)
Ancestries Reported - Subsaharan African (%)
Ancestries Reported - Swedish (%)
Ancestries Reported - Swiss (%)
Ancestries Reported - Ukrainian (%)
Ancestries Reported - United States (%)
Ancestries Reported - Welsh (%)
Ancestries Reported - West Indian (%)
Ancestries Reported - Other (%)
Geographical mobility - Same house 1 year ago (%)
Geographical mobility - Same house 1 year ago (%) - White
Geographical mobility - Same house 1 year ago (%) - Black or African American
Geographical mobility - Same house 1 year ago (%) - Asian
Geographical mobility - Same house 1 year ago (%) - Hispanic or Latino
Geographical mobility - Same house 1 year ago (%) - American Indian and Alaska Native
Geographical mobility - Same house 1 year ago (%) - Multirace
Geographical mobility - Same house 1 year ago (%) - Other Race
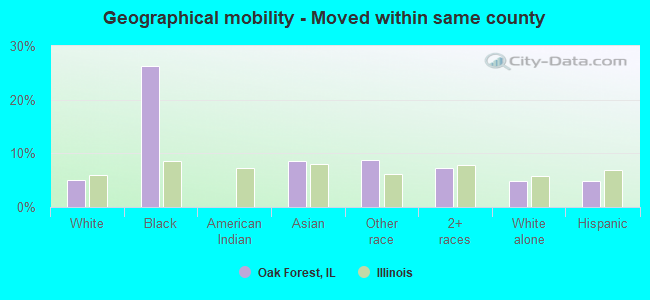
Geographical mobility - Moved within same county (%)
Geographical mobility - Moved within same county (%) - White
Geographical mobility - Moved within same county (%) - Black or African American
Geographical mobility - Moved within same county (%) - Asian
Geographical mobility - Moved within same county (%) - Hispanic or Latino
Geographical mobility - Moved within same county (%) - American Indian and Alaska Native
Geographical mobility - Moved within same county (%) - Multirace
Geographical mobility - Moved within same county (%) - Other Race
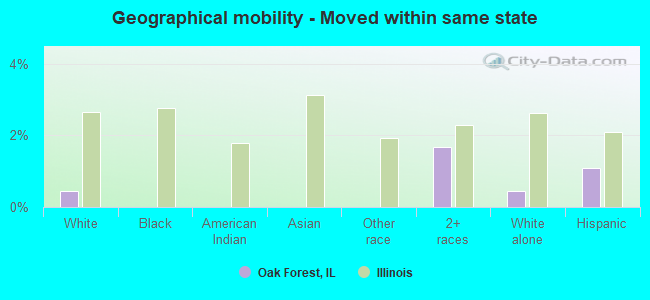
Geographical mobility - Moved from different county within same state (%)
Geographical mobility - Moved from different county within same state (%) - White
Geographical mobility - Moved from different county within same state (%) - Black or African American
Geographical mobility - Moved from different county within same state (%) - Asian
Geographical mobility - Moved from different county within same state (%) - Hispanic or Latino
Geographical mobility - Moved from different county within same state (%) - American Indian and Alaska Native
Geographical mobility - Moved from different county within same state (%) - Multirace
Geographical mobility - Moved from different county within same state (%) - Other Race
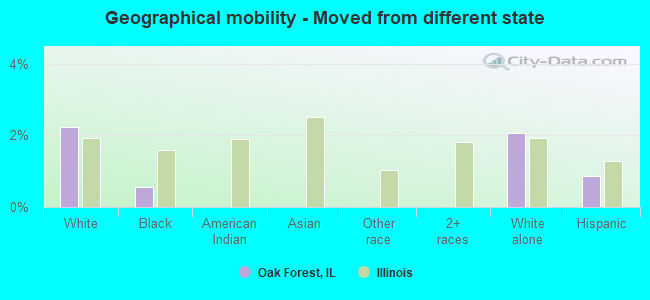
Geographical mobility - Moved from different state (%)
Geographical mobility - Moved from different state (%) - White
Geographical mobility - Moved from different state (%) - Black or African American
Geographical mobility - Moved from different state (%) - Asian
Geographical mobility - Moved from different state (%) - Hispanic or Latino
Geographical mobility - Moved from different state (%) - American Indian and Alaska Native
Geographical mobility - Moved from different state (%) - Multirace
Geographical mobility - Moved from different state (%) - Other Race
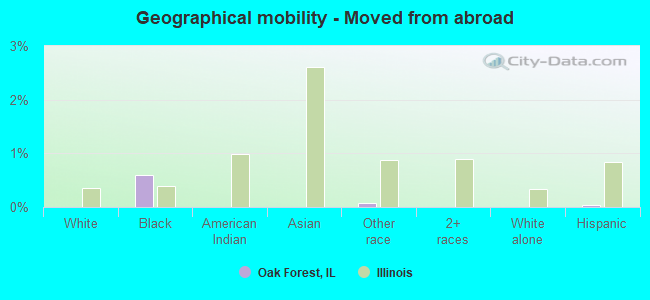
Geographical mobility - Moved from abroad (%)
Geographical mobility - Moved from abroad (%) - White
Geographical mobility - Moved from abroad (%) - Black or African American
Geographical mobility - Moved from abroad (%) - Asian
Geographical mobility - Moved from abroad (%) - Hispanic or Latino
Geographical mobility - Moved from abroad (%) - American Indian and Alaska Native
Geographical mobility - Moved from abroad (%) - Multirace
Geographical mobility - Moved from abroad (%) - Other Race
Place of birth for the foreign-born population - Ireland (%)
Place of birth for the foreign-born population - Denmark (%)
Place of birth for the foreign-born population - Norway (%)
Place of birth for the foreign-born population - Sweden (%)
Place of birth for the foreign-born population - United Kingdom (%)
Place of birth for the foreign-born population - England (%)
Place of birth for the foreign-born population - Scotland (%)
Place of birth for the foreign-born population - Other Northern Europe (%)
Place of birth for the foreign-born population - Austria (%)
Place of birth for the foreign-born population - Belgium (%)
Place of birth for the foreign-born population - France (%)
Place of birth for the foreign-born population - Germany (%)
Place of birth for the foreign-born population - Netherlands (%)
Place of birth for the foreign-born population - Switzerland (%)
Place of birth for the foreign-born population - Other Western Europe (%)
Place of birth for the foreign-born population - Greece (%)
Place of birth for the foreign-born population - Italy (%)
Place of birth for the foreign-born population - Portugal (%)
Place of birth for the foreign-born population - Spain (%)
Place of birth for the foreign-born population - Other Southern Europe (%)
Place of birth for the foreign-born population - Albania (%)
Place of birth for the foreign-born population - Belarus (%)
Place of birth for the foreign-born population - Bosnia and Herzegovina (%)
Place of birth for the foreign-born population - Bulgaria (%)
Place of birth for the foreign-born population - Croatia (%)
Place of birth for the foreign-born population - Czechoslovakia (%)
Place of birth for the foreign-born population - Hungary (%)
Place of birth for the foreign-born population - Latvia (%)
Place of birth for the foreign-born population - Lithuania (%)
Place of birth for the foreign-born population - North Macedonia (Macedonia) (%)
Place of birth for the foreign-born population - Moldova (%)
Place of birth for the foreign-born population - Poland (%)
Place of birth for the foreign-born population - Romania (%)
Place of birth for the foreign-born population - Russia (%)
Place of birth for the foreign-born population - Serbia (%)
Place of birth for the foreign-born population - Ukraine (%)
Place of birth for the foreign-born population - Other Eastern Europe (%)
Place of birth for the foreign-born population - China (%)
Place of birth for the foreign-born population - Hong Kong (%)
Place of birth for the foreign-born population - Taiwan (%)
Place of birth for the foreign-born population - Japan (%)
Place of birth for the foreign-born population - Korea (%)
Place of birth for the foreign-born population - Other Eastern Asia (%)
Place of birth for the foreign-born population - Afghanistan (%)
Place of birth for the foreign-born population - Bangladesh (%)
Place of birth for the foreign-born population - India (%)
Place of birth for the foreign-born population - Iran (%)
Place of birth for the foreign-born population - Kazakhstan (%)
Place of birth for the foreign-born population - Nepal (%)
Place of birth for the foreign-born population - Pakistan (%)
Place of birth for the foreign-born population - Sri Lanka (%)
Place of birth for the foreign-born population - Uzbekistan (%)
Place of birth for the foreign-born population - Other South Central Asia (%)
Place of birth for the foreign-born population - Burma (%)
Place of birth for the foreign-born population - Cambodia (%)
Place of birth for the foreign-born population - Indonesia (%)
Place of birth for the foreign-born population - Laos (%)
Place of birth for the foreign-born population - Malaysia (%)
Place of birth for the foreign-born population - Philippines (%)
Place of birth for the foreign-born population - Singapore (%)
Place of birth for the foreign-born population - Thailand (%)
Place of birth for the foreign-born population - Vietnam (%)
Place of birth for the foreign-born population - Other South Eastern Asia (%)
Place of birth for the foreign-born population - Armenia (%)
Place of birth for the foreign-born population - Iraq (%)
Place of birth for the foreign-born population - Israel (%)
Place of birth for the foreign-born population - Jordan (%)
Place of birth for the foreign-born population - Kuwait (%)
Place of birth for the foreign-born population - Lebanon (%)
Place of birth for the foreign-born population - Saudi Arabia (%)
Place of birth for the foreign-born population - Syria (%)
Place of birth for the foreign-born population - Turkey (%)
Place of birth for the foreign-born population - Yemen (%)
Place of birth for the foreign-born population - Other Western Asia (%)
Place of birth for the foreign-born population - Eritrea (%)
Place of birth for the foreign-born population - Ethiopia (%)
Place of birth for the foreign-born population - Kenya (%)
Place of birth for the foreign-born population - Somalia (%)
Place of birth for the foreign-born population - Uganda (%)
Place of birth for the foreign-born population - Zimbabwe (%)
Place of birth for the foreign-born population - Other Eastern Africa (%)
Place of birth for the foreign-born population - Cameroon (%)
Place of birth for the foreign-born population - Congo (%)
Place of birth for the foreign-born population - Democratic Republic of Congo (Zaire) (%)
Place of birth for the foreign-born population - Other Middle Africa (%)
Place of birth for the foreign-born population - Egypt (%)
Place of birth for the foreign-born population - Morocco (%)
Place of birth for the foreign-born population - Sudan (%)
Place of birth for the foreign-born population - Other Northern Africa (%)
Place of birth for the foreign-born population - South Africa (%)
Place of birth for the foreign-born population - Other Southern Africa (%)
Place of birth for the foreign-born population - Cabo Verde (%)
Place of birth for the foreign-born population - Ghana (%)
Place of birth for the foreign-born population - Liberia (%)
Place of birth for the foreign-born population - Nigeria (%)
Place of birth for the foreign-born population - Senegal (%)
Place of birth for the foreign-born population - Sierra Leone (%)
Place of birth for the foreign-born population - Other Western Africa (%)
Place of birth for the foreign-born population - Australia (%)
Place of birth for the foreign-born population - New Zealand (%)
Place of birth for the foreign-born population - Fiji (%)
Place of birth for the foreign-born population - Micronesia (%)
Place of birth for the foreign-born population - Bahamas (%)
Place of birth for the foreign-born population - Barbados (%)
Place of birth for the foreign-born population - Cuba (%)
Place of birth for the foreign-born population - Dominica (%)
Place of birth for the foreign-born population - Dominican Republic (%)
Place of birth for the foreign-born population - Grenada (%)
Place of birth for the foreign-born population - Haiti (%)
Place of birth for the foreign-born population - Jamaica (%)
Place of birth for the foreign-born population - St. Vincent and the Grenadines (%)
Place of birth for the foreign-born population - Trinidad and Tobago (%)
Place of birth for the foreign-born population - West Indies (%)
Place of birth for the foreign-born population - Other Caribbean (%)
Place of birth for the foreign-born population - Belize (%)
Place of birth for the foreign-born population - Costa Rica (%)
Place of birth for the foreign-born population - El Salvador (%)
Place of birth for the foreign-born population - Guatemala (%)
Place of birth for the foreign-born population - Honduras (%)
Place of birth for the foreign-born population - Mexico (%)
Place of birth for the foreign-born population - Nicaragua (%)
Place of birth for the foreign-born population - Panama (%)
Place of birth for the foreign-born population - Other Central America (%)
Place of birth for the foreign-born population - Argentina (%)
Place of birth for the foreign-born population - Bolivia (%)
Place of birth for the foreign-born population - Brazil (%)
Place of birth for the foreign-born population - Chile (%)
Place of birth for the foreign-born population - Colombia (%)
Place of birth for the foreign-born population - Ecuador (%)
Place of birth for the foreign-born population - Guyana (%)
Place of birth for the foreign-born population - Peru (%)
Place of birth for the foreign-born population - Uruguay (%)
Place of birth for the foreign-born population - Venezuela (%)
Place of birth for the foreign-born population - Other South America (%)
Place of birth for the foreign-born population - Canada (%)
Place of birth for the foreign-born population - Other Northern America (%)
Place of birth for the foreign-born population - Other (%)
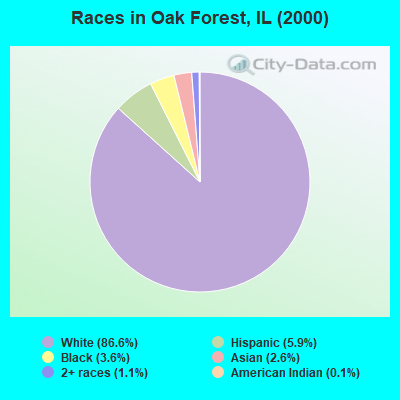
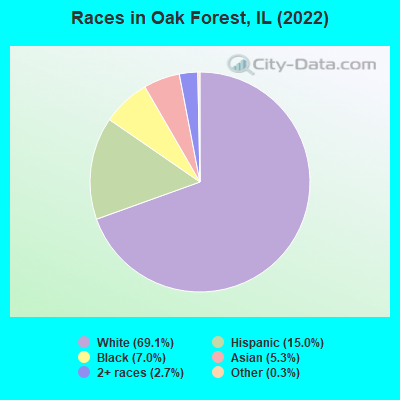
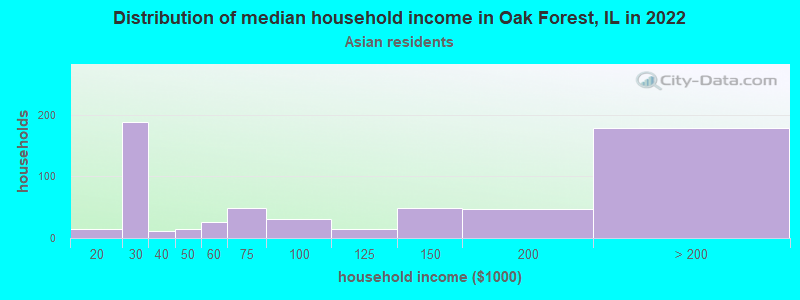
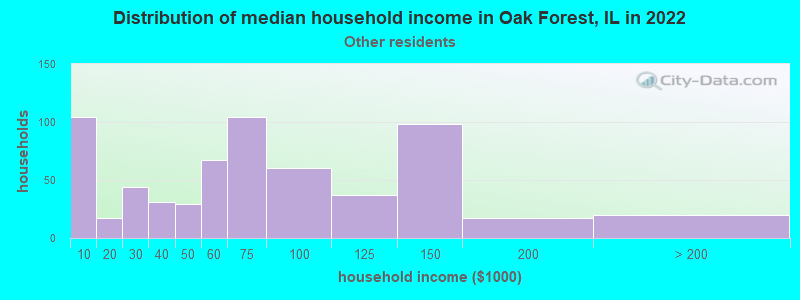
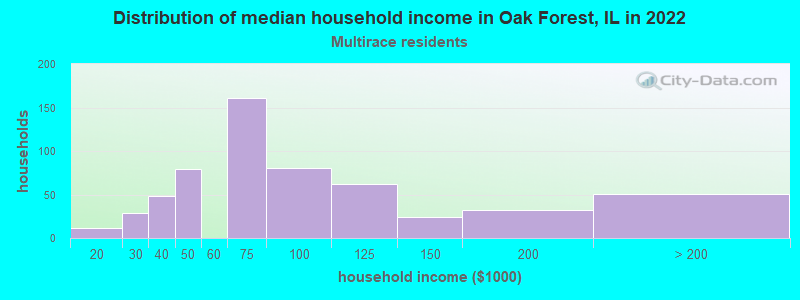
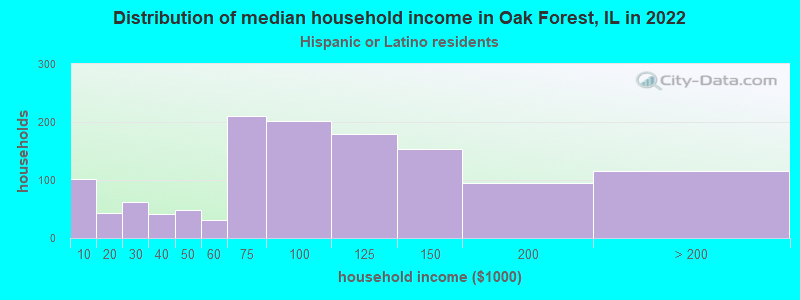
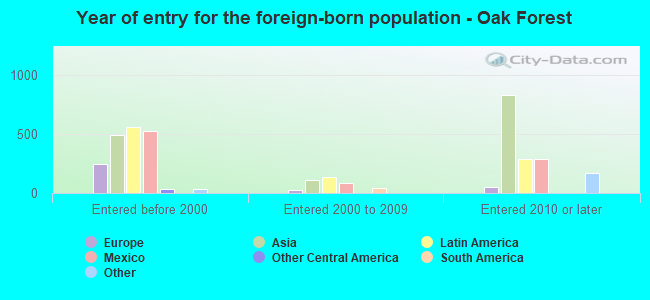
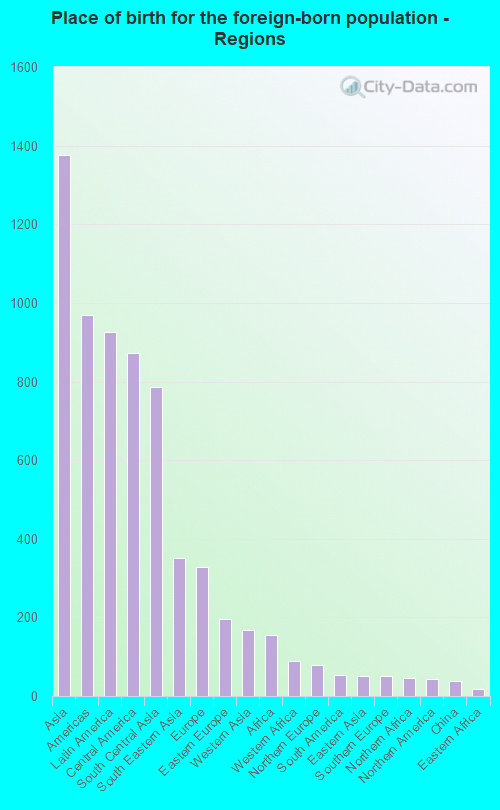
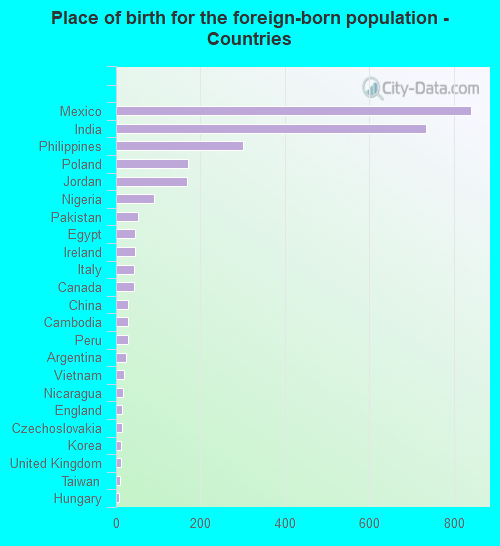
According to 2022 data, the most numerous races in Oak Forest, IL are White alone (18,376 residents), Hispanic (3,980 residents), and Black alone (1,865 residents). 81.8% of Oak Forest residents speak English at home. 10.6% of Oak Forest, IL residents are foreign-born (5.1% born in Asia, 3.4% born in Latin America, 1.2% born in Europe), which is 31.6% less than the foreign-born rate of 14.0% across the entire state of Illinois.
Race distribution in Oak Forest
2000 2022
8,424,140 67.8% White alone 1,856,152 14.9% Black alone 1,530,262 12.3% Hispanic 419,916 3.4% Asian alone 153,996 1.2% Two or more races 13,479 0.1% Other race alone 18,232 0.1% American Indian alone 3,116 0.03% Native Hawaiian and Other
7,356,301 58.5% White alone 2,299,726 18.3% Hispanic 1,660,423 13.2% Black alone 747,296 5.9% Asian alone 458,599 3.6% Two or more races 45,386 0.4% Other race alone 10,405 0.08% American Indian alone 3,896 0.03% Native Hawaiian and Other
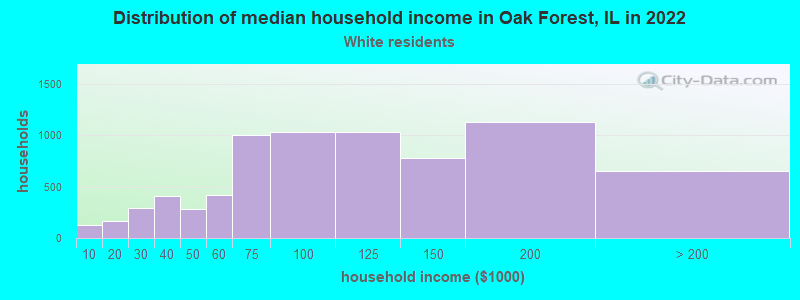
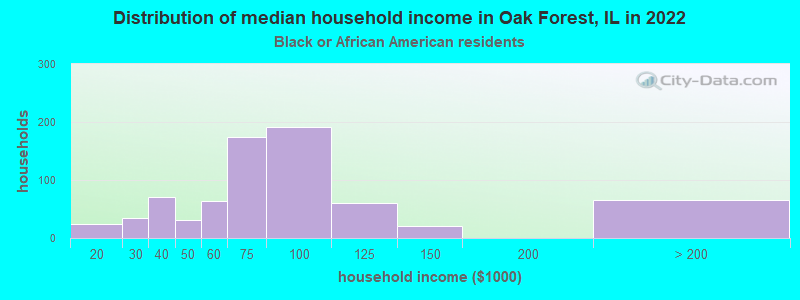
Income and house value in Oak Forest Median household income in 2022 $95,002 White non-Hispanic householders$65,958 Black householders$66,016 Some other race householders$67,798 Two or more races householders$91,718 Hispanic or Latino race householdersMedian 2022 house value $241,598 White Non-Hispanic householders$353,571 Black or African American householders $276,906 Asian householders$267,752 Some other race householders$261,050 Two or more races householders$269,060 Hispanic or Latino householders
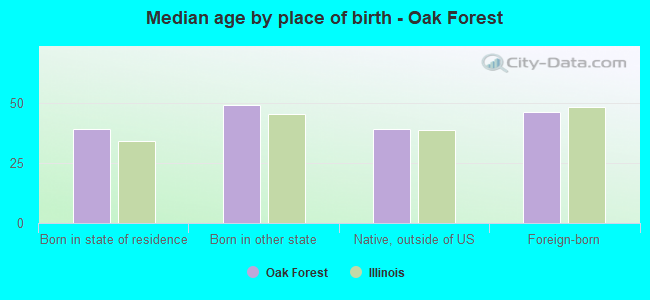
Median age by race in Oak Forest
45.4 Median age for White residents42.9 48.0 34.0 Median age for Black or African American residents34.3 33.7 -680,473,372.1 Median age for American Indian / Alaska Native residents-736,736,736.0 -641,399,416.3 49.2 Median age for Asian residents38.0 51.5 -687,999,999.3 Median age for Native Hawaiian / Pacific Islander residents-918,721,460.3 -610,229,276.3 34.0 Median age for Other race residents33.1 34.2 30.8 Median age for Two or more races residents34.3 28.7 46.3 Median age for White alone residents42.9 47.5 28.4 Median age for Hispanic or Latino residents30.8 25.0
Owner/renter occupied households by race in Oak Forest
House owners and renters - White residents 6,418 87.7% Owner occupied899 12.3% Renter occupiedHouse owners and renters - Black or African American residents 354 45.4% Owner occupied426 54.6% Renter occupiedHouse owners and renters - American Indian / Alaska Native residents 27 100.0% Renter occupiedHouse owners and renters - Asian residents 263 44.3% Owner occupied331 55.7% Renter occupiedHouse owners and renters - Other race residents 385 60.2% Owner occupied254 39.8% Renter occupiedHouse owners and renters - Two or more races residents 485 81.1% Owner occupied113 18.9% Renter occupiedHouse owners and renters - White alone residents 6,412 87.0% Owner occupied958 13.0% Renter occupiedHouse owners and renters - Hispanic or Latino residents 1,076 84.0% Owner occupied205 16.0% Renter occupied
Language usage in Oak Forest
English speakers - Total 81.8% of residents of Oak Forest speak English at home.
8.5% of residents speak Spanish at home 1,312 60.2% Speak English very well868 39.8% Speak English less than very well9.2% of residents speak other language at home 1,452 61.9% Speak English very well892 38.1% Speak English less than very well
English speakers - Born in the United States 96.1% of residents of Oak Forest speak English at home.
1.8% of residents speak Spanish at home 40 100.0% Speak English very well1.7% of residents speak other language at home 19 51.4% Speak English very well18 48.6% Speak English less than very well
English speakers - Native, born elsewhere 46.3% of residents of Oak Forest speak English at home.
44.9% of residents speak Spanish at home 153 100.0% Speak English very well10.9% of residents speak other language at home 37 100.0% Speak English very well
English speakers - Foreign-born 13.2% of residents of Oak Forest speak English at home.
29.8% of residents speak Spanish at home 251 29.8% Speak English very well591 70.2% Speak English less than very well56.7% of residents speak other language at home 952 59.4% Speak English very well652 40.6% Speak English less than very well
White (Caucasian) - Speak only English Native:
99.6% (16,845)Foreign-born:
20.2% (129)
White (Caucasian) - Speak another language Native:
3.5% (597)Foreign-born:
80.3% (516)
Black or African American - Speak only English Native:
98.4% (1,708)Foreign-born:
27.5% (30)
Black or African American - Speak another language Native:
1.6% (27)Foreign-born:
70.1% (76)
Asian - Speak only English Native:
50.6% (138)Foreign-born:
7.0% (80)
Asian - Speak another language Native:
49.4% (135)Foreign-born:
93.6% (1,067)
Other race - Speak only English Native:
37.6% (358)Foreign-born:
19.5% (107)
Other race - Speak another language Native:
63.5% (604)Foreign-born:
78.6% (434)
Two or more races - Speak only English Native:
61.3% (1,139)Foreign-born:
3.0% (12)
Two or more races - Speak another language Native:
37.9% (705)Foreign-born:
97.0% (372)
White alone - Speak only English Native:
95.9% (16,405)Foreign-born:
23.9% (139)
White alone - Speak another language Native:
3.7% (628)Foreign-born:
75.1% (435)
Hispanic or Latino - Speak only English Native:
55.4% (1,564)Foreign-born:
6.3% (57)
Hispanic or Latino - Speak another language Native:
46.0% (1,299)Foreign-born:
93.5% (843)
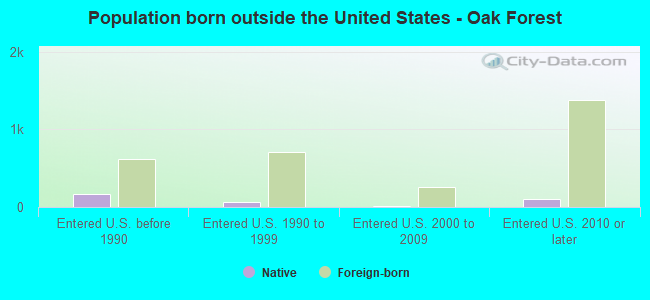
Foreign-born residents in Oak Forest 2,830 residents are foreign born (5.1% Asia , 3.4% Latin America , 1.2% Europe ).
This city:
10.6%Illinois:
14.1%
Marital status for residents in Oak Forest Marital status - White (Caucasian) population 15 years and over
Males 30.7% Never married61.0% Now married0.0% Separated2.3% Widowed6.0% DivorcedFemales 26.4% Never married56.0% Now married0.2% Separated7.3% Widowed10.1% DivorcedWomen who gave birth in the past 12 months Now married:
100.0% (115)Unmarried:
0.0% (0)
Women who did not give birth in the past 12 months Now married:
46.9% (1,758)Unmarried:
53.1% (1,992)
Marital status - Black or African American population 15 years and over
Males 61.3% Never married17.0% Now married4.6% Separated2.2% Widowed14.8% DivorcedFemales 35.3% Never married31.5% Now married3.7% Separated2.3% Widowed27.2% DivorcedWomen who did not give birth in the past 12 months Now married:
36.3% (251)Unmarried:
63.7% (440)
Marital status - Asian population 15 years and over
Males 37.6% Never married62.4% Now married0.0% Separated0.0% Widowed0.0% DivorcedFemales 16.4% Never married68.5% Now married0.0% Separated2.5% Widowed12.6% DivorcedWomen who did not give birth in the past 12 months Now married:
58.2% (223)Unmarried:
41.8% (161)
Marital status - Other race population 15 years and over
Males 22.5% Never married65.8% Now married1.7% Separated3.5% Widowed6.5% DivorcedFemales 45.4% Never married32.9% Now married11.9% Separated0.6% Widowed9.3% DivorcedWomen who gave birth in the past 12 months Now married:
100.0% (55)Unmarried:
0.0% (0)
Women who did not give birth in the past 12 months Now married:
22.9% (128)Unmarried:
77.1% (430)
Marital status - Two or more races population 15 years and over
Males 39.7% Never married55.0% Now married0.0% Separated0.0% Widowed5.3% DivorcedFemales 40.8% Never married52.5% Now married0.0% Separated0.0% Widowed6.7% DivorcedWomen who did not give birth in the past 12 months Now married:
52.6% (402)Unmarried:
47.4% (362)
Marital status - White alone, not Hispanic / Latino population 15 years and over
Males 29.7% Never married62.2% Now married0.0% Separated2.5% Widowed5.6% DivorcedFemales 25.1% Never married57.1% Now married0.0% Separated7.6% Widowed10.1% DivorcedWomen who gave birth in the past 12 months Now married:
100.0% (122)Unmarried:
0.0% (0)
Women who did not give birth in the past 12 months Now married:
48.7% (1,848)Unmarried:
51.3% (1,950)
Marital status - Hispanic or Latino population 15 years and over
Males 34.9% Never married55.8% Now married0.6% Separated1.3% Widowed7.4% DivorcedFemales 47.9% Never married36.7% Now married5.9% Separated1.3% Widowed8.2% DivorcedWomen who gave birth in the past 12 months Now married:
100.0% (57)Unmarried:
0.0% (0)
Women who did not give birth in the past 12 months Now married:
30.4% (393)Unmarried:
69.6% (901)
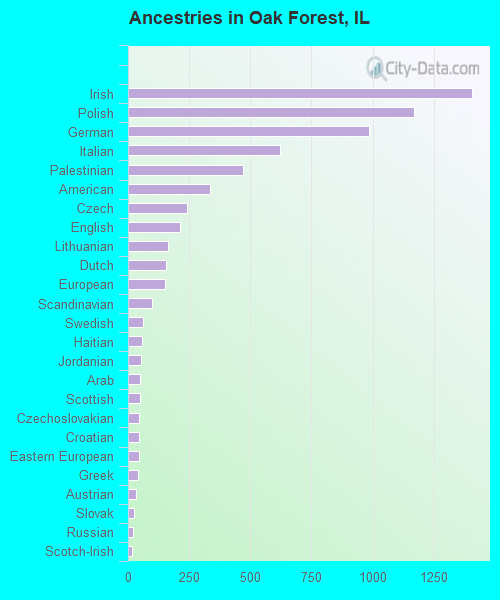
Ancestries in Oak Forest
1,406 13.0% Irish1,170 10.8% Polish985 9.1% German622 5.7% Italian470 4.3% Palestinian334 3.1% American240 2.2% Czech211 1.9% English162 1.5% Lithuanian154 1.4% Dutch151 1.4% European99 0.9% Scandinavian61 0.6% Swedish56 0.5% Haitian55 0.5% Jordanian49 0.5% Arab48 0.4% Scottish47 0.4% Czechoslovakian46 0.4% Croatian43 0.4% Eastern European39 0.4% Greek34 0.3% Austrian25 0.2% Slovak20 0.2% Russian18 0.2% Scotch-Irish17 0.2% Danish17 0.2% African14 0.1% Finnish14 0.1% Norwegian10 0.09% Swiss5 0.05% Hungarian2 0.02% British
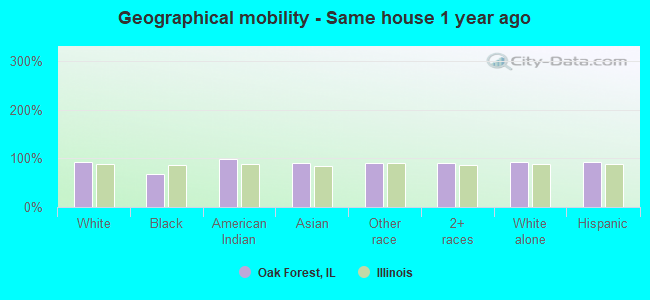
Geographical mobility in Oak Forest Same house 1 year ago 16,282 91.8% White (Caucasian)1,304 68.4% Black or African American23 98.7% American Indian / Alaska Native1,282 90.8% Asian1,462 90.4% Other race2,136 89.6% Two or more races16,893 92.3% White alone, not Hispanic / Latino3,643 92.9% Hispanic or LatinoMoved within same county 902 5.1% White / Caucasian499 26.2% Black or African American121 8.6% Asian141 8.7% Other race174 7.3% Two or more races892 4.9% White alone, not Hispanic / Latino193 4.9% Hispanic or LatinoMoved within same state 79 0.4% White / Caucasian40 1.7% Two or more races83 0.5% White alone, not Hispanic / Latino42 1.1% Hispanic or LatinoMoved from different state 394 2.2% White / Caucasian11 0.6% Black or African American377 2.1% White alone, not Hispanic / Latino34 0.9% Hispanic or LatinoMoved from abroad 12 0.6% Black or African American1 0.1% Other race2 0.0% Hispanic or Latino
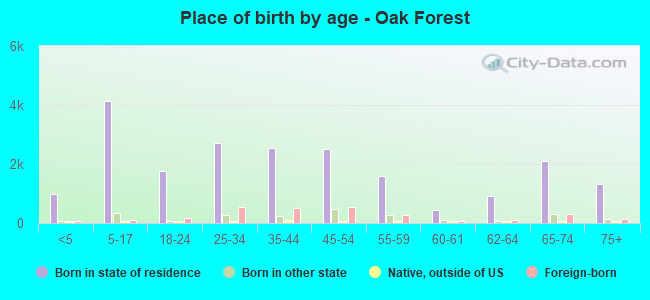
Children Nativity (place of birth) in Oak Forest
Children under 6 years - Living with two parents Both parents native 690 100.0% NativeBoth parents foreign-born 59 77.4% Native17 22.6% Foreign-bornOne native, one foreign-born parent 30 100.0% NativeChildren under 6 years - Living with one parent Native parent 295 100.0% NativeChildren 6 to 17 years - Living with two parents Both parents native 2,382 100.0% NativeBoth parents foreign-born 337 81.9% Native74 18.1% Foreign-bornOne native, one foreign-born parent 143 100.0% NativeChildren 6 to 17 years - Living with one parent Native parent 1,441 100.0% NativeForeign-born parent 94 50.1% Native94 49.9% Foreign-born
Grandparents responsible for own grandchildren in Oak Forest
Grandparents (30 to 59 years) White / Caucasian 19 14.4% Responsible for grandchildren115 85.6% Not responsible for grandchildrenBlack or African American 19 46.3% Responsible for grandchildren22 53.7% Not responsible for grandchildrenWhite alone, not Hispanic / Latino 26 22.3% Responsible for grandchildren89 77.7% Not responsible for grandchildrenHispanic or Latino 17 100.0% Not responsible for grandchildrenGrandparents (60 years and over) White / Caucasian 68 29.7% Responsible for grandchildren160 70.3% Not responsible for grandchildrenWhite alone, not Hispanic / Latino 83 29.0% Responsible for grandchildren202 71.0% Not responsible for grandchildrenHispanic or Latino 30 100.0% Not responsible for grandchildren