Lubbock, TX (Texas) Houses and Residents
| Lubbock: | $210,300 |
| Texas: | $275,400 |
Mean price in 2022:
Detached houses: $257,983
Here: $257,983 State: $369,058 Townhouses or other attached units: $237,375
Here: $237,375 State: $327,631 In 2-unit structures: $362,500
Here: $362,500 State: $374,947 In 3-to-4-unit structures: $222,368
Here: $222,368 State: $209,652 In 5-or-more-unit structures: $246,086
Here: $246,086 State: $413,944 Mobile homes: $47,509
Here: $47,509 State: $124,413 Occupied boats, RVs, vans, etc.: $35,423
Here: $35,423 State: $73,921
Total population: 243,839 (Urban population: 195,321, Rural population: 4,235 (72 farm, 4,163 nonfarm))
Houses: 119,947 (110,156 occupied: 55,142 owner occupied, 55,014 renter occupied)
| % of renters here: | 50% |
| State: | 38% |
Housing density: 1,045 houses/condos per square mile
Median price asked for vacant for-sale houses and condos in 2022: $336,037.
Median contract rent in 2022: $882 (lower quartile is $695, upper quartile is $1,178)
Median rent asked for vacant for-rent units in 2022: $870
Median gross rent in Lubbock, TX in 2022: $1,106
Housing units in Lubbock with a mortgage: 32,842 (1,417 second mortgage, 0 home equity loan, 707 both second mortgage and home equity loan)
Houses without a mortgage: 287
Median household income for houses/condos with a mortgage: $95,388
Median household income for apartments without a mortgage: $61,451
Median monthly housing costs: $1,148
Compare current foreclosures in Lubbock, TX:
| Photo | Address | Area | Beds / Baths | Price | Details |
|---|---|---|---|---|---|

|
#1
Street
Lubbock, TX 79413
|
2,736 sq. feet
|
4 baths 6 beds |
show details | |

|
#2
86th St
Lubbock, TX 79423
|
1,892 sq. feet
|
2 baths 3 beds |
show details | |

|
#3
Kirby Ave
Lubbock, TX 79424
|
- sq. feet
|
2 baths 3 beds |
show details | |

|
#4
Fm 41
Lubbock, TX 79423
|
2,363 sq. feet
|
3 baths 4 beds |
show details | |

|
#5
24th St
Lubbock, TX 79407
|
1,347 sq. feet
|
2 baths 3 beds |
show details | |

|
#6
Aberdeen Ave
Lubbock, TX 79416
|
3,670 sq. feet
|
2 baths 3 beds |
show details | |

|
#7
41st St
Lubbock, TX 79414
|
1,856 sq. feet
|
2 baths 3 beds |
show details | |

|
#8
54th St
Lubbock, TX 79407
|
2,377 sq. feet
|
3 baths 4 beds |
show details | |

|
#9
109th St
Lubbock, TX 79424
|
2,016 sq. feet
|
2 baths 4 beds |
show details | |

|
#10
95th St
Lubbock, TX 79423
|
1,280 sq. feet
|
2 baths 6 beds |
show details |
| Photo | Address | Area | Beds / Baths | Price | Details |
|---|---|---|---|---|---|

|
#11
59th St
Lubbock, TX 79412
|
2,069 sq. feet
|
2 baths 3 beds |
show details | |

|
#12
111th St
Lubbock, TX 79423
|
1,551 sq. feet
|
2 baths 3 beds |
show details | |

|
#13
Slide Rd Unit 40
Lubbock, TX 79407
|
2,168 sq. feet
|
2 baths 2 beds |
show details | |

|
#14
E Amherst St
Lubbock, TX 79403
|
1,302 sq. feet
|
1 baths 3 beds |
show details | |

|
#15
28th St
Lubbock, TX 79411
|
1,174 sq. feet
|
1 baths 2 beds |
show details | |

|
#16
28th St
Lubbock, TX 79411
|
1,035 sq. feet
|
1 baths 2 beds |
show details | |

|
#17
30th St
Lubbock, TX 79410
|
1,128 sq. feet
|
1 baths 3 beds |
show details | |

|
#18
Albany Ave Apt A
Lubbock, TX 79424
|
1,774 sq. feet
|
2 baths - beds |
show details | |

|
#19
47th St
Lubbock, TX 79412
|
- sq. feet
|
1 baths 3 beds |
show details | |

|
#20
Huron Ave
Lubbock, TX 79424
|
- sq. feet
|
2 baths 3 beds |
show details |
| Photo | Address | Area | Beds / Baths | Price | Details |
|---|---|---|---|---|---|

|
#21
E 3rd St
Lubbock, TX 79403
|
- sq. feet
|
1 baths 3 beds |
show details | |

|
#22
42nd St
Lubbock, TX 79413
|
- sq. feet
|
2 baths 3 beds |
show details | |

|
#23
Amherst St
Lubbock, TX 79415
|
- sq. feet
|
2 baths 3 beds |
show details | |

|
#24
41st St
Lubbock, TX 79413
|
- sq. feet
|
3 baths 3 beds |
show details | |

|
#25
N Durham Ave
Lubbock, TX 79416
|
- sq. feet
|
2 baths 3 beds |
show details | |

|
#26
86th St
Lubbock, TX 79424
|
- sq. feet
|
3 baths 3 beds |
show details | |

|
#27
Belton Dr
Lubbock, TX 79423
|
- sq. feet
|
2 baths 3 beds |
show details | |

|
#28
York Pl
Lubbock, TX 79424
|
- sq. feet
|
3 baths 3 beds |
show details | |

|
#29
29th St
Lubbock, TX 79411
|
- sq. feet
|
2 baths 2 beds |
show details | |

|
#30
71st St
Lubbock, TX 79424
|
- sq. feet
|
2 baths 3 beds |
show details |
| Photo | Address | Area | Beds / Baths | Price | Details |
|---|---|---|---|---|---|

|
#31
62nd St
Lubbock, TX 79414
|
- sq. feet
|
2 baths 3 beds |
show details | |

|
#32
67th St
Lubbock, TX 79412
|
- sq. feet
|
2 baths 4 beds |
show details | |

|
#33
Brentwood Ave
Lubbock, TX 79424
|
- sq. feet
|
2 baths 3 beds |
show details | |

|
#34
80th St
Lubbock, TX 79424
|
- sq. feet
|
2 baths 3 beds |
show details | |

|
#35
108th Dr
Lubbock, TX 79423
|
- sq. feet
|
2 baths 3 beds |
show details | |

|
#36
99th St
Lubbock, TX 79424
|
- sq. feet
|
2 baths 3 beds |
show details | |

|
#37
Grinnell St
Lubbock, TX 79415
|
- sq. feet
|
3 baths 4 beds |
show details | |

|
#38
87th St
Lubbock, TX 79423
|
- sq. feet
|
2 baths 4 beds |
show details | |

|
#39
96th St
Lubbock, TX 79424
|
- sq. feet
|
2 baths 3 beds |
show details | |

|
#40
105th St
Lubbock, TX 79423
|
- sq. feet
|
2 baths 3 beds |
show details |
| Photo | Address | Area | Beds / Baths | Price | Details |
|---|---|---|---|---|---|

|
#41
14th St
Lubbock, TX 79416
|
- sq. feet
|
2 baths 3 beds |
show details | |

|
#42
Utica Ave
Lubbock, TX 79424
|
- sq. feet
|
2 baths 3 beds |
show details | |

|
#43
N Iola Ave
Lubbock, TX 79416
|
- sq. feet
|
2 baths 3 beds |
show details | |

|
#44
Belton Dr
Lubbock, TX 79423
|
- sq. feet
|
2 baths 3 beds |
show details | |

|
#45
63rd St
Lubbock, TX 79413
|
- sq. feet
|
2 baths 3 beds |
show details | |

|
#46
46th St
Lubbock, TX 79413
|
- sq. feet
|
2 baths 2 beds |
show details | |

|
#47
Harvard St
Lubbock, TX 79416
|
- sq. feet
|
2 baths 2 beds |
show details | |

|
#48
91st St
Lubbock, TX 79424
|
- sq. feet
|
2 baths 3 beds |
show details | |

|
#49
Homestead Ave
Lubbock, TX 79424
|
- sq. feet
|
2 baths 3 beds |
show details | |

|
Check over 1 million property listings on Foreclosure.com!
|
browse all offers | |||

Latest news about housing in Lubbock, TX collected exclusively by city-data.com from local newspapers, TV, and radio stations

 | Apartments in lubbock (4 replies) |
| Good highlights of economic growth in Lubbock (140 replies) |
| Heirs To Lubbock County Estates Have $408,925 in Unclaimed Inheritence Money (2 replies) |
| Apartments in Lubbock that allow 3 pets? (0 replies) |
| What cuisines are most strongly represented in Lubbock's restaurants? (3 replies) |
| Anyone else just not like Lubbock ? (10 replies) |

Median year apartment built: 1988
Household type by relationship:
Households: 263,937- Male householders: 54,017 (17,346 living alone), Female householders: 56,139 (17,693 living alone)
42,899 spouses (42,679 opposite-sex spouses), 7,694 unmarried partners, (7,058 opposite-sex unmarried partners), 65,593 children (60,119 natural, 2,256 adopted, 3,218 stepchildren), 3,622 grandchildren, 4,257 brothers or sisters, 2,493 parents, 168 foster children, 2,952 other relatives, 12,612 non-relatives
- In group quarters: 11,491
Size of family households: 27,625 2-persons, 14,432 3-persons, 11,557 4-persons, 6,501 5-persons, 1,633 6-persons, 1,000 7-or-more-persons.
Size of nonfamily households: 35,039 1-person, 8,731 2-persons, 2,145 3-persons, 1,445 4-persons, 48 5-persons.
33,462 married couples with children.
19,456 single-parent households (4,146 men, 15,310 women).
78.7% of residents of Lubbock speak English at home.
17.5% of residents speak Spanish at home (78% speak English very well, 14% speak English well, 5% speak English not well, 3% don't speak English at all).
1.1% of residents speak other Indo-European language at home (70% speak English very well, 25% speak English well, 4% speak English not well).
1.8% of residents speak Asian or Pacific Island language at home (69% speak English very well, 25% speak English well, 5% speak English not well, 1% don't speak English at all).
0.9% of residents speak other language at home (74% speak English very well, 17% speak English well, 9% speak English not well).
Foreign born population: 17,872 (6.8%)
(38.5% of them are naturalized citizens)
| Here: | 6.1 |
| State: | 6.3 |
| Here: | 4.3 |
| State: | 4.0 |

- Bedrooms in owner-occupied houses and condos in Lubbock, Texas
- 60no bedroom
- 3181 bedroom
- 5,9542 bedrooms
- 32,6553 bedrooms
- 13,6364 bedrooms
- 2,5195+ bedrooms

- Bedrooms in renter-occupied apartments in Lubbock, Texas
- 2,467no bedroom
- 12,2601 bedroom
- 18,1902 bedrooms
- 19,3503 bedrooms
- 2,7474 bedrooms
- 05+ bedrooms

- Cars and other vehicles available in Lubbock in owner-occupied houses/condos
- 924no vehicle
- 13,7691 vehicle
- 26,2352 vehicles
- 10,4363 vehicles
- 2,8044 vehicles
- 9745+ vehicles

- Cars and other vehicles available in Lubbock in renter-occupied apartments
- 4,852no vehicle
- 28,5281 vehicle
- 15,5712 vehicles
- 3,8173 vehicles
- 2,1354 vehicles
- 1115+ vehicles

- Rooms in owner-occupied houses in Lubbock, Texas
- 601 room
- 742 rooms
- 5683 rooms
- 4,9084 rooms
- 13,3285 rooms
- 15,0976 rooms
- 8,5167 rooms
- 5,0158 rooms
- 7,5769+ rooms

- Rooms in renter-occupied apartments in Lubbock, Texas
- 2,1921 room
- 3,0392 rooms
- 10,1793 rooms
- 15,1444 rooms
- 11,5595 rooms
- 7,9036 rooms
- 2,7277 rooms
- 8768 rooms
- 1,3959+ rooms


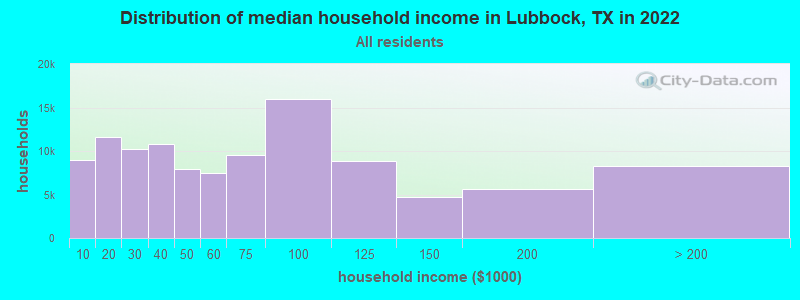
Lubbock, TX household income distribution

- 9,016Less than $10,000
- 11,587$10,000 to $19,999
- 10,192$20,000 to $29,999
- 10,821$30,000 to $39,999
- 7,977$40,000 to $49,999
- 7,464$50,000 to $59,999
- 9,570$60,000 to $74,999
- 16,022$75,000 to $99,999
- 8,859$100,000 to $124,999
- 4,736$125,000 to $149,999
- 5,615$150,000 to $199,999
- 8,297$200,000 or more
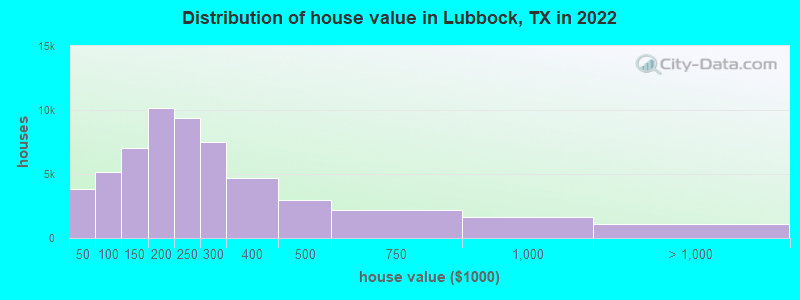
Home value of owner - occupied houses in 2022 in Lubbock, TX
-
- 309Less than $10,000
- 474$10,000 to $14,999
- 546$15,000 to $19,999
- 442$20,000 to $24,999
- 853$25,000 to $29,999
- 334$30,000 to $34,999
- 303$35,000 to $39,999
- 590$40,000 to $49,999
- 684$50,000 to $59,999
- 859$60,000 to $69,999
- 759$70,000 to $79,999
- 1,312$80,000 to $89,999
- 977$90,000 to $99,999
- 3,588$100,000 to $124,999
- 3,414$125,000 to $149,999
- 5,036$150,000 to $174,999
- 5,157$175,000 to $199,999
- 9,414$200,000 to $249,999
- 7,496$250,000 to $299,999
- 4,689$300,000 to $399,999
- 2,951$400,000 to $499,999
- 2,195$500,000 to $749,999
- 1,639$750,000 to $999,999
- 697$1,000,000 to $1,499,999
- 32$1,500,000 to $1,999,999
- 392$2,000,000 or more
Rent paid by renters in 2022 in Lubbock, TX
-
- 289Less than $100
- 194$100 to $149
- 53$200 to $249
- 320$250 to $299
- 27$300 to $349
- 450$350 to $399
- 1,605$400 to $449
- 853$450 to $499
- 2,546$500 to $549
- 1,657$550 to $599
- 1,605$600 to $649
- 4,061$650 to $699
- 2,519$700 to $749
- 3,189$750 to $799
- 8,754$800 to $899
- 4,898$900 to $999
- 9,555$1,000 to $1,249
- 4,815$1,250 to $1,499
- 3,515$1,500 to $1,999
- 1,265$2,000 to $2,499
- 622$2,500 to $2,999
- 311$3,500 or more
- 1,911No cash rent


Percentage of workers working in this county: 95.1%
Number of people working at home: 8,380 (6.3% of all workers)
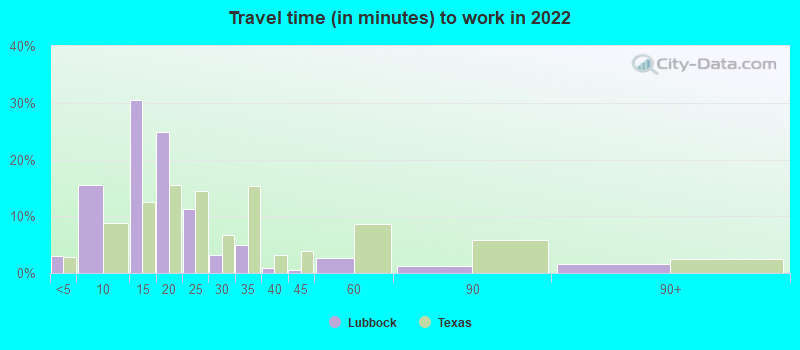
Travel time to work (commute)
- Less than 5 minutes: 4,201
- 5 to 9 minutes: 21,363
- 10 to 14 minutes: 43,154
- 15 to 19 minutes: 31,912
- 20 to 24 minutes: 10,912
- 25 to 29 minutes: 2,378
- 30 to 34 minutes: 3,297
- 35 to 39 minutes: 216
- 40 to 44 minutes: 496
- 45 to 59 minutes: 2,666
- 60 to 89 minutes: 1,784
- 90 or more minutes: 2,496
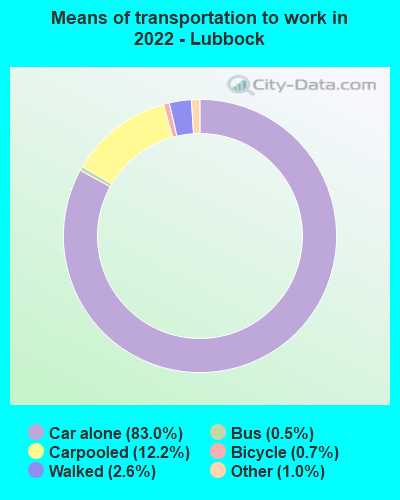
Means of transportation to work:
- Drove a car alone: 115,912 (78.3%)
- Carpooled: 17,005 (11.5%)
- Bus: 710 (0.5%)
- Subway or elevated rail: 42 (0.0%)
- Taxi: 1,430 (1.0%)
- Bicycle: 940 (0.6%)
- Walked: 3,571 (2.4%)
- Worked at home: 8,380 (5.7%)

- Unemployment by race in 2022
- Unemployment rate for White non-Hispanic residents
- 3.7%Males
- 2.7%Females
- Unemployment rate for Black residents
- 6.5%Males
- 11.3%Females
- Unemployment rate for American Indian and Alaska Native residents
- 0.7%Males
- 21.2%Females
- Unemployment rate for Asian residents
- 1.5%Males
- 4.9%Females
- Unemployment rate for other race residents
- 3.8%Males
- 7.9%Females
- Unemployment rate for two or more race residents
- 3.9%Males
- 15.3%Females
- Unemployment rate for Hispanic or Latino residents
- 4.3%Males
- 9.0%Females

- Year of entry for the foreign-born population in Lubbock, Texas
- 9,4342010 or later
- 3,0642000 to 2009
- 2,0601990 to 1999
- 1,5651980 to 1989
- 1,3401970 to 1979
- 1,300Before 1970

First ancestries reported:
- English: 12,060 (10.0%)
- American: 9,444 (7.8%)
- German: 8,268 (6.9%)
- Irish: 5,307 (4.4%)
- European: 2,223 (1.8%)
- Scottish: 1,704 (1.4%)
- Italian: 1,444 (1.2%)
- Scotch-Irish: 1,127 (0.9%)
- Ethiopian: 717 (0.6%)
- Norwegian: 644 (0.5%)
- French: 544 (0.5%)
- Swedish: 399 (0.3%)
- Nigerian: 399 (0.3%)
- Czech: 361 (0.3%)
- Scandinavian: 360 (0.3%)
- African: 346 (0.3%)
- British: 335 (0.3%)
- Welsh: 313 (0.3%)
- Dutch: 313 (0.3%)
- Polish: 261 (0.2%)
- Lebanese: 252 (0.2%)
- Northern European: 206 (0.2%)
- Danish: 196 (0.2%)
- Brazilian: 176 (0.1%)
- Eastern European: 147 (0.1%)
- Egyptian: 141 (0.1%)
- Turkish: 135 (0.1%)
- Iranian: 129 (0.1%)
- Kenyan: 129 (0.1%)
- French Canadian: 115 (0.10%)
- Swiss: 108 (0.09%)
- Czechoslovakian: 91 (0.08%)
- Canadian: 75 (0.06%)
- Greek: 68 (0.06%)
- Arab: 65 (0.05%)
- Jamaican: 58 (0.05%)
- Russian: 57 (0.05%)
- Hungarian: 54 (0.04%)
- Haitian: 53 (0.04%)
- Dutch West Indian: 47 (0.04%)
- Finnish: 45 (0.04%)
- Austrian: 42 (0.03%)
- Trinidadian and Tobagonian: 40 (0.03%)
- South African: 38 (0.03%)
- Somali: 36 (0.03%)
- Ugandan: 35 (0.03%)
- U.S. Virgin Islander: 34 (0.03%)
- Slovak: 30 (0.02%)
- Ghanaian: 29 (0.02%)
- Lithuanian: 25 (0.02%)
- Jordanian: 25 (0.02%)
- Sierra Leonean: 20 (0.02%)
- Portuguese: 20 (0.02%)
- Latvian: 19 (0.02%)
- Belgian: 19 (0.02%)
- Australian: 18 (0.01%)
- Alsatian: 14 (0.01%)
- Cajun: 14 (0.01%)
- Bahamian: 14 (0.01%)
- Celtic: 11 (0.01%)
- Bulgarian: 11 (0.01%)
- Pennsylvania German: 10 (0.01%)
- Ukrainian: 10 (0.01%)
- Basque: 10 (0.01%)
Most common places of birth for foreign-born residents (%):
| Lubbock: | 29.7% (5,172) |
| Texas: | 48.4% (2,411,723) |
| Lubbock: | 7.8% (1,357) |
| Texas: | 2.3% (115,558) |
| Lubbock: | 5.4% (938) |
| Texas: | 6.1% (306,347) |
| Lubbock: | 5.2% (902) |
| Texas: | 2.1% (103,148) |
| Lubbock: | 3.8% (668) |
| Texas: | 4.5% (224,455) |
| Lubbock: | 3.2% (559) |
| Texas: | 1.1% (55,371) |
| Lubbock: | 2.9% (514) |
| Texas: | 1.5% (72,413) |
| Lubbock: | 2.8% (494) |
| Texas: | 3.0% (147,182) |
| Lubbock: | 2.6% (453) |
| Texas: | 3.7% (184,770) |
| Lubbock: | 2.3% (407) |
| Texas: | 1.2% (60,172) |
| Lubbock: | 2.3% (400) |
| Texas: | 0.3% (15,833) |
| Lubbock: | 2.1% (361) |
| Texas: | 1.9% (96,110) |
| Lubbock: | 1.8% (308) |
| Texas: | 0.5% (24,705) |
| Lubbock: | 1.7% (302) |
| Texas: | 0.4% (21,746) |
Place of birth for U.S.-born residents:
- This state: 189,922
- Other state: 53,829
- Northeast: 3,463
- Midwest: 9,671
- South: 13,720
- West: 26,975
76.1% of Lubbock residents lived in the same house 1 years ago.
Out of people who lived in different houses, 37.4% lived in this county.
Out of people who lived in different counties, 67.9% lived in Texas.
| Lubbock: | 76.1% |
| State average: | 85.7% |
Education attainment for males 25 years and older:
- No schooling: 1,714
- Nursery to 4th grade: 456
- 5th and 6th grade: 363
- 7th and 8th grade: 1,072
- 9th grade: 1,083
- 10th grade: 855
- 11th grade: 1,202
- 12th grade, no diploma: 982
- High school graduate (or equivalency): 18,774
- Less than 1 year of college: 6,578
- Some college more than 1 year, no degree: 9,837
- Associate degree: 5,345
- Bachelor's degree: 15,189
- Master's degree: 7,586
- Professional school degree: 1,304
- Doctorate degree: 2,757

Education attainment for females 25 years and older:
- No schooling: 854
- Nursery to 4th grade: 454
- 5th and 6th grade: 368
- 7th and 8th grade: 1,900
- 9th grade: 1,182
- 10th grade: 967
- 11th grade: 1,360
- 12th grade, no diploma: 1,684
- High school graduate (or equivalency): 19,761
- Less than 1 year of college: 6,311
- Some college more than 1 year, no degree: 10,168
- Associate degree: 6,549
- Bachelor's degree: 18,056
- Master's degree: 8,565
- Professional school degree: 980
- Doctorate degree: 1,667


Housing units in structures:
- One, detached: 75,675
- One, attached: 4,000
- Two: 5,615
- 3 or 4: 6,309
- 5 to 9: 7,520
- 10 to 19: 7,511
- 20 to 49: 3,882
- 50 or more: 7,182
- Mobile homes: 2,219
- Boats, RVs, vans, etc.: 34
Median worth of mobile homes: $28,800
Housing units lacking complete kitchen facilities in 2022: 2.0%
House/condo owner moved in on average 9 years ago
Renter moved in on average 0 years ago

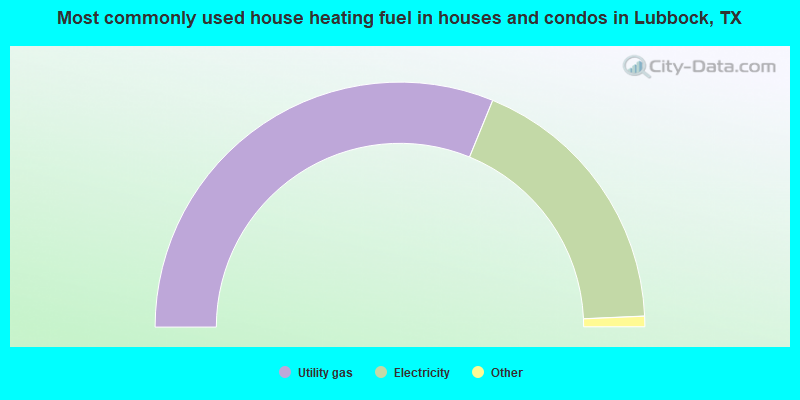
- 61.6%Utility gas
- 36.6%Electricity
- 1.0%Bottled, tank, or LP gas
- 0.2%No fuel used
- 0.2%Solar energy
- 0.2%Fuel oil, kerosene, etc.
- 0.1%Wood
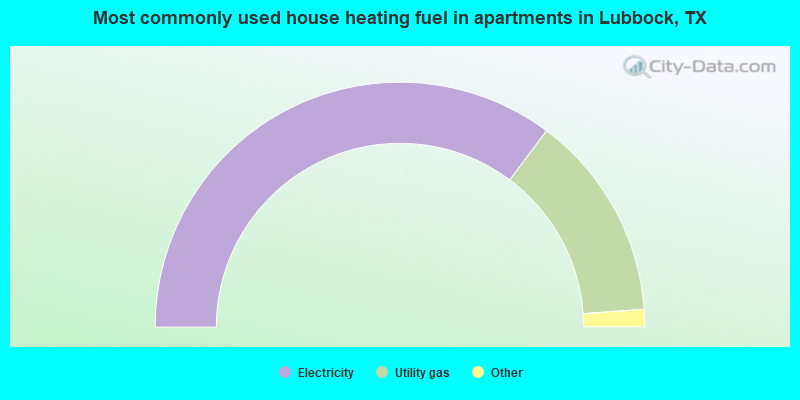
- 70.5%Electricity
- 27.3%Utility gas
- 1.3%Bottled, tank, or LP gas
- 0.7%No fuel used
- 0.2%Other fuel
Private vs. public school enrollment:
| Here: | 11.5% |
| Texas: | 8.8% |
| Here: | 6.5% |
| Texas: | 8.0% |
| Here: | 9.1% |
| Texas: | 16.2% |


