The median household income in Lubbock, TX in 2022 was $56,910, which was 27.0% less than the median annual income of $72,284 across the entire state of Texas. Compared to the median income of $31,844 in 2000 this represents an increase of 44.0%. The per capita income in 2022 was $34,545, which means an increase of 49.3% compared to 2000 when it was $17,511.
Whole page based on the data from 2000 / 2022 when the population of Lubbock, Texas was 199,564 / 263,937
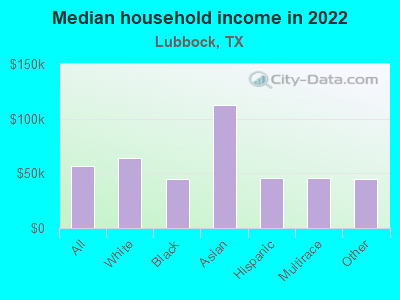
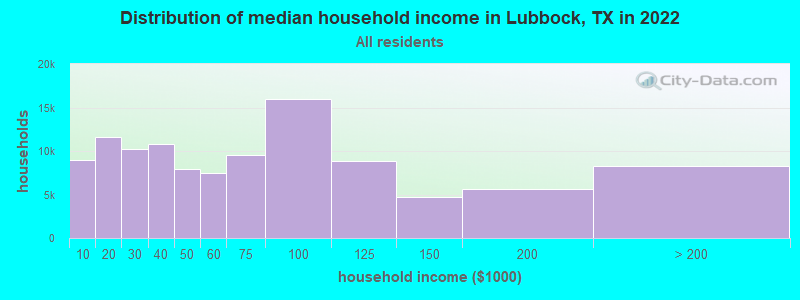
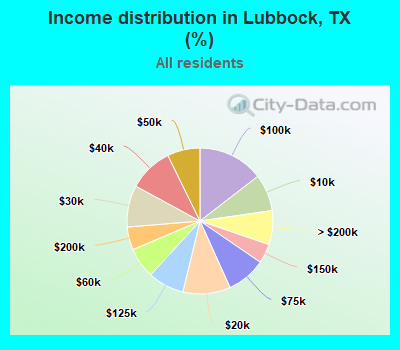
Income statistics for all residents
Median household income in Lubbock, TX in 2022:
Lubbock:
$56,910
Texas:
$72,284
Change in median household income between 2000 and 2022:
Lubbock, Texas:
+78.7%
Texas:
+81.0%
Number of households with income < $10k:
Lubbock:
8.2% (9,016)
Texas:
5.5% (611,011)
Number of households with income $10k - 20k:
Lubbock:
10.5% (11,587)
State:
6.7% (743,157)
Number of households with income $20k - 30k:
Lubbock:
9.3% (10,192)
Texas:
7.2% (803,381)
Number of households with income $30k - 40k:
Lubbock:
9.8% (10,821)
State:
7.8% (866,080)
Number of households with income $40k - 50k:
Lubbock:
7.2% (7,977)
State:
7.3% (810,440)
Number of households with income $50k - 60k:
Lubbock:
6.8% (7,464)
Texas:
7.2% (799,783)
Number of households with income $60k - 75k:
Lubbock:
8.7% (9,570)
State:
9.9% (1,095,384)
Number of households with income $75k - 100k:
Lubbock:
14.5% (16,022)
Texas:
12.8% (1,419,057)
Number of households with income $100k - 125k:
Lubbock:
8.0% (8,859)
State:
9.5% (1,054,577)
Number of households with income $125k - 150k:
Lubbock:
4.3% (4,736)
State:
6.7% (741,518)
Number of households with income $150k - 200k:
Lubbock:
5.1% (5,615)
Texas:
8.7% (961,776)
Number of households with income > $200k:
Lubbock:
7.5% (8,297)
Texas:
10.7% (1,181,544)
Aggregate household income in Lubbock in 2022: $9,104,133,000
Median family income in Lubbock in 2022:
Lubbock:
$80,322
State:
$86,267
Number of families with income < $10k:
Lubbock:
4.5% (2,835)
State:
4.0% (297,884)
Number of families with income $10k - 20k:
Lubbock:
6.1% (3,805)
State:
4.3% (324,514)
Number of families with income $20k - 30k:
Lubbock:
7.3% (4,610)
Texas:
5.8% (430,949)
Number of families with income $30k - 40k:
Lubbock:
7.9% (4,933)
State:
6.6% (493,535)
Number of families with income $40k - 50k:
Lubbock:
5.7% (3,605)
Texas:
6.7% (499,663)
Number of families with income $50k - 60k:
Lubbock:
7.7% (4,825)
State:
6.6% (492,203)
Number of families with income $60k - 75k:
Lubbock:
7.7% (4,838)
State:
9.5% (710,229)
Number of families with income $75k - 100k:
Lubbock:
17.1% (10,712)
Texas:
13.6% (1,015,480)
Number of families with income $100k - 125k:
Lubbock:
10.3% (6,468)
State:
10.7% (797,961)
Number of families with income $125k - 150k:
Lubbock:
6.1% (3,851)
State:
8.1% (602,985)
Number of families with income $150k - 200k:
Lubbock:
7.6% (4,789)
Texas:
10.7% (804,459)
Number of families with income > $200k:
Lubbock:
11.9% (7,477)
State:
13.5% (1,013,514)
Median non-family income in Lubbock in 2022:
Lubbock:
$35,830
State:
$45,999
Change in median non-family income between 2000 and 2022:
Lubbock, Texas:
+100.7%
Texas:
+79.5%
Median per capita income in Lubbock in 2022:
Lubbock:
$34,545
Texas:
$38,123
Change in median per capita income between 2000 and 2022:
Lubbock, Texas:
+97.3%
Texas:
+94.3%
Income statistics for White residents
Median household income in Lubbock, TX in 2022:
Lubbock:
$63,723
State:
$82,032
Change in median household income between 2000 and 2022:
Lubbock, Texas:
+82.4%
Texas:
+91.0%
Number of households with income < $10k:
Lubbock:
7.1% (4,857)
State:
4.7% (273,716)
Number of households with income $10k - 20k:
Lubbock:
6.7% (4,519)
State:
5.5% (322,702)
Number of households with income $20k - 30k:
Lubbock:
7.8% (5,313)
State:
6.2% (363,947)
Number of households with income $30k - 40k:
Lubbock:
12.1% (8,199)
State:
6.8% (399,275)
Number of households with income $40k - 50k:
Lubbock:
7.3% (4,964)
Texas:
6.5% (383,417)
Number of households with income $50k - 60k:
Lubbock:
6.5% (4,387)
State:
6.6% (388,535)
Number of households with income $60k - 75k:
Lubbock:
8.8% (5,962)
Texas:
9.7% (566,295)
Number of households with income $75k - 100k:
Lubbock:
14.6% (9,950)
State:
13.0% (760,276)
Number of households with income $100k - 125k:
Lubbock:
9.2% (6,263)
State:
10.2% (597,596)
Number of households with income $125k - 150k:
Lubbock:
5.7% (3,849)
State:
7.4% (436,830)
Number of households with income $150k - 200k:
Lubbock:
5.7% (3,868)
State:
9.9% (583,067)
Number of households with income > $200k:
Lubbock:
8.5% (5,803)
Texas:
13.5% (792,647)
Aggregate household income in Lubbock in 2022: $6,045,465,900
Median family income in Lubbock in 2022:
Lubbock:
$90,729
State:
$101,788
Number of families with income < $10k:
Lubbock:
3.5% (1,331)
State:
2.8% (108,142)
Number of families with income $10k - 20k:
Lubbock:
4.3% (1,630)
Texas:
2.9% (113,421)
Number of families with income $20k - 30k:
Lubbock:
3.7% (1,385)
State:
4.1% (157,688)
Number of families with income $30k - 40k:
Lubbock:
8.8% (3,331)
Texas:
5.2% (198,847)
Number of families with income $40k - 50k:
Lubbock:
5.1% (1,908)
Texas:
5.6% (216,490)
Number of families with income $50k - 60k:
Lubbock:
6.7% (2,527)
Texas:
5.7% (220,689)
Number of families with income $60k - 75k:
Lubbock:
7.8% (2,941)
State:
9.0% (346,106)
Number of families with income $75k - 100k:
Lubbock:
17.4% (6,560)
Texas:
13.7% (527,363)
Number of families with income $100k - 125k:
Lubbock:
11.7% (4,398)
Texas:
11.6% (448,411)
Number of families with income $125k - 150k:
Lubbock:
8.1% (3,048)
State:
9.2% (355,798)
Number of families with income $150k - 200k:
Lubbock:
8.9% (3,350)
State:
12.5% (480,185)
Number of families with income > $200k:
Lubbock:
14.0% (5,291)
Texas:
17.6% (677,490)
Median non-family income in Lubbock in 2022:
Lubbock:
$38,791
State:
$50,587
Change in median non-family income between 2000 and 2022:
Lubbock, Texas:
+105.7%
Texas:
+87.7%
Median per capita income in Lubbock in 2022:
Lubbock:
$41,136
Texas:
$47,740
Change in median per capita income between 2000 and 2022:
Lubbock, Texas:
+103.9%
Texas:
+114.3%
Income statistics for Black or African American residents
Median household income in Lubbock, TX in 2022:
Lubbock:
$45,000
Texas:
$55,759
Change in median household income between 2000 and 2022:
Lubbock, Texas:
+120.2%
State:
+90.3%
Number of households with income < $10k:
Lubbock:
6.9% (421)
State:
8.9% (126,378)
Number of households with income $10k - 20k:
Lubbock:
18.2% (1,107)
State:
9.9% (140,369)
Number of households with income $20k - 30k:
Lubbock:
15.9% (965)
State:
8.5% (120,639)
Number of households with income $30k - 40k:
Lubbock:
4.7% (285)
State:
9.7% (137,517)
Number of households with income $40k - 50k:
Lubbock:
9.7% (589)
State:
8.0% (112,973)
Number of households with income $50k - 60k:
Lubbock:
11.2% (677)
State:
8.3% (117,156)
Number of households with income $60k - 75k:
Lubbock:
11.6% (706)
State:
10.4% (147,462)
Number of households with income $75k - 100k:
Lubbock:
11.4% (689)
Texas:
11.5% (162,718)
Number of households with income $100k - 125k:
Lubbock:
5.0% (306)
State:
8.2% (115,829)
Number of households with income $125k - 150k:
Lubbock:
0.5% (30)
State:
4.9% (69,556)
Number of households with income $150k - 200k:
Lubbock:
3.9% (237)
State:
6.4% (90,701)
Number of households with income > $200k:
Lubbock:
0.9% (54)
State:
5.5% (77,988)
Aggregate household income in Lubbock in 2022: $313,168,500
Median family income in Lubbock in 2022:
Lubbock:
$51,808
Texas:
$69,134
Number of families with income < $10k:
Lubbock:
10.0% (388)
State:
6.8% (55,625)
Number of families with income $10k - 20k:
Lubbock:
10.0% (390)
State:
6.8% (55,300)
Number of families with income $20k - 30k:
Lubbock:
14.0% (545)
State:
7.1% (57,877)
Number of families with income $30k - 40k:
Lubbock:
9.7% (376)
State:
8.5% (68,776)
Number of families with income $40k - 50k:
Lubbock:
7.0% (273)
State:
7.1% (57,907)
Number of families with income $50k - 60k:
Lubbock:
9.5% (367)
Texas:
7.3% (59,511)
Number of families with income $60k - 75k:
Lubbock:
10.3% (401)
State:
10.1% (81,994)
Number of families with income $75k - 100k:
Lubbock:
12.0% (466)
State:
12.7% (103,723)
Number of families with income $100k - 125k:
Lubbock:
7.6% (295)
State:
9.4% (76,609)
Number of families with income $125k - 150k:
Lubbock:
3.1% (119)
State:
6.8% (55,615)
Number of families with income $150k - 200k:
Lubbock:
3.0% (117)
State:
9.4% (76,146)
Number of families with income > $200k:
Lubbock:
3.7% (145)
State:
7.9% (64,439)
Median non-family income in Lubbock in 2022:
Lubbock:
$36,118
State:
$40,133
Median per capita income in Lubbock in 2022:
Lubbock:
$18,588
Texas:
$30,490
Change in median per capita income between 2000 and 2022:
Lubbock, Texas:
+85.3%
Texas:
+113.9%
Income statistics for Asian residents
Median household income in Lubbock, TX in 2022:
Lubbock:
$112,756
Texas:
$107,673
Number of households with income < $10k:
Lubbock:
6.1% (171)
State:
5.2% (29,885)
Number of households with income $10k - 20k:
Lubbock:
11.9% (332)
Texas:
4.7% (27,044)
Number of households with income $20k - 30k:
Lubbock:
4.7% (132)
State:
4.1% (23,363)
Number of households with income $30k - 40k:
Lubbock:
8.7% (244)
State:
4.1% (23,309)
Number of households with income $40k - 50k:
Lubbock:
3.3% (91)
Texas:
5.2% (29,826)
Number of households with income $50k - 60k:
Lubbock:
7.3% (204)
State:
4.7% (26,512)
Number of households with income $60k - 75k:
Lubbock:
5.7% (160)
State:
6.5% (36,905)
Number of households with income $75k - 100k:
Lubbock:
11.4% (318)
Texas:
11.3% (64,350)
Number of households with income $100k - 125k:
Lubbock:
9.9% (275)
State:
11.4% (64,714)
Number of households with income $125k - 150k:
Lubbock:
7.2% (200)
State:
9.3% (52,719)
Number of households with income $150k - 200k:
Lubbock:
6.4% (178)
Texas:
12.5% (70,953)
Number of households with income > $200k:
Lubbock:
17.4% (486)
State:
21.1% (120,260)
Aggregate household income in Lubbock in 2022: $318,049,600
Median family income in Lubbock in 2022:
Lubbock:
$114,300
Texas:
$123,328
Number of families with income < $10k:
Lubbock:
0.5% (7)
State:
3.1% (13,567)
Number of families with income $10k - 20k:
Lubbock:
11.6% (170)
State:
3.0% (13,043)
Number of families with income $20k - 30k:
Lubbock:
5.0% (74)
State:
3.4% (14,738)
Number of families with income $30k - 40k:
Lubbock:
4.7% (69)
State:
3.4% (15,033)
Number of families with income $40k - 50k:
Lubbock:
1.6% (24)
State:
4.9% (21,622)
Number of families with income $50k - 60k:
Lubbock:
7.4% (108)
State:
4.7% (20,568)
Number of families with income $60k - 75k:
Lubbock:
3.9% (57)
Texas:
6.1% (26,637)
Number of families with income $75k - 100k:
Lubbock:
16.2% (238)
State:
10.7% (46,626)
Number of families with income $100k - 125k:
Lubbock:
13.9% (204)
Texas:
11.3% (49,585)
Number of families with income $125k - 150k:
Lubbock:
3.7% (54)
State:
9.8% (43,043)
Number of families with income $150k - 200k:
Lubbock:
9.0% (132)
State:
14.7% (64,203)
Number of families with income > $200k:
Lubbock:
22.4% (328)
Texas:
24.8% (108,511)
Median non-family income in Lubbock in 2022:
Lubbock:
$49,235
State:
$64,320
Median per capita income in Lubbock in 2022:
Lubbock:
$46,004
Texas:
$48,626
Change in median per capita income between 2000 and 2022:
Lubbock, Texas:
+112.5%
State:
+132.0%
Income statistics for Hispanic or Latino residents
Median household income in Lubbock, TX in 2022:
Lubbock:
$45,586
State:
$60,504
Change in median household income between 2000 and 2022:
Lubbock, Texas:
+70.1%
State:
+102.5%
Number of households with income < $10k:
Lubbock:
7.8% (3,043)
State:
5.8% (213,953)
Number of households with income $10k - 20k:
Lubbock:
14.0% (5,450)
Texas:
8.0% (297,456)
Number of households with income $20k - 30k:
Lubbock:
12.7% (4,940)
State:
9.2% (340,166)
Number of households with income $30k - 40k:
Lubbock:
10.8% (4,218)
State:
9.5% (354,336)
Number of households with income $40k - 50k:
Lubbock:
7.2% (2,806)
State:
8.8% (327,013)
Number of households with income $50k - 60k:
Lubbock:
6.9% (2,703)
State:
8.3% (308,818)
Number of households with income $60k - 75k:
Lubbock:
8.6% (3,332)
State:
10.9% (405,109)
Number of households with income $75k - 100k:
Lubbock:
15.4% (6,014)
State:
13.8% (511,639)
Number of households with income $100k - 125k:
Lubbock:
6.1% (2,377)
Texas:
8.6% (319,728)
Number of households with income $125k - 150k:
Lubbock:
3.3% (1,285)
State:
5.7% (210,932)
Number of households with income $150k - 200k:
Lubbock:
3.2% (1,236)
Texas:
6.4% (236,055)
Number of households with income > $200k:
Lubbock:
4.0% (1,539)
State:
5.1% (189,259)
Aggregate household income in Lubbock in 2022: $2,393,623,500
Median family income in Lubbock in 2022:
Lubbock:
$56,513
Texas:
$65,080
Number of families with income < $10k:
Lubbock:
2.7% (637)
State:
5.3% (147,493)
Number of families with income $10k - 20k:
Lubbock:
9.3% (2,191)
Texas:
6.3% (174,531)
Number of families with income $20k - 30k:
Lubbock:
13.2% (3,103)
Texas:
8.6% (238,528)
Number of families with income $30k - 40k:
Lubbock:
11.3% (2,674)
State:
9.1% (251,999)
Number of families with income $40k - 50k:
Lubbock:
7.6% (1,789)
Texas:
8.6% (240,188)
Number of families with income $50k - 60k:
Lubbock:
8.5% (1,999)
Texas:
8.0% (223,566)
Number of families with income $60k - 75k:
Lubbock:
8.9% (2,098)
Texas:
10.9% (302,688)
Number of families with income $75k - 100k:
Lubbock:
16.3% (3,851)
State:
14.3% (398,554)
Number of families with income $100k - 125k:
Lubbock:
6.6% (1,560)
State:
9.5% (264,007)
Number of families with income $125k - 150k:
Lubbock:
5.0% (1,184)
State:
6.2% (171,274)
Number of families with income $150k - 200k:
Lubbock:
4.1% (973)
Texas:
7.3% (202,259)
Number of families with income > $200k:
Lubbock:
6.4% (1,507)
State:
5.9% (165,129)
Median non-family income in Lubbock in 2022:
Lubbock:
$30,357
Texas:
$39,934
Change in median non-family income between 2000 and 2022:
Lubbock, Texas:
+90.3%
Texas:
+109.1%
Median per capita income in Lubbock in 2022:
Lubbock:
$23,152
Texas:
$24,862
Change in median per capita income between 2000 and 2022:
Lubbock, Texas:
+128.1%
Texas:
+130.8%
Income statistics for American Indian and Alaska Native residents
Number of households with income < $10k:
Lubbock:
7.6% (69)
State:
4.1% (3,398)
Number of households with income $10k - 20k:
Lubbock:
14.6% (133)
State:
8.3% (6,949)
Number of households with income $20k - 30k:
Lubbock:
12.2% (111)
State:
9.3% (7,742)
Number of households with income $30k - 40k:
Lubbock:
16.0% (146)
State:
9.1% (7,627)
Number of households with income $40k - 50k:
Lubbock:
6.8% (62)
State:
7.1% (5,922)
Number of households with income $50k - 60k:
Lubbock:
0.3% (3)
Texas:
8.1% (6,761)
Number of households with income $60k - 75k:
Lubbock:
1.2% (11)
State:
12.7% (10,588)
Number of households with income $75k - 100k:
Lubbock:
24.9% (227)
State:
13.0% (10,903)
Number of households with income $100k - 125k:
Lubbock:
5.0% (46)
State:
9.9% (8,256)
Number of households with income $125k - 150k:
Lubbock:
2.0% (18)
State:
5.2% (4,355)
Number of households with income $150k - 200k:
Lubbock:
5.5% (50)
State:
6.7% (5,623)
Number of households with income > $200k:
Lubbock:
3.8% (35)
State:
6.6% (5,522)
Aggregate household income in Lubbock in 2022: $27,075,800
Median family income in Lubbock in 2022:
Lubbock:
$26,634
State:
$72,369
Number of families with income < $10k:
Lubbock:
6.8% (22)
State:
2.7% (1,671)
Number of families with income $20k - 30k:
Lubbock:
28.8% (92)
State:
7.3% (4,502)
Number of families with income $30k - 40k:
Lubbock:
6.6% (21)
State:
7.5% (4,592)
Number of families with income $50k - 60k:
Lubbock:
0.9% (3)
State:
7.1% (4,347)
Number of families with income $60k - 75k:
Lubbock:
4.4% (14)
State:
12.1% (7,429)
Number of families with income $75k - 100k:
Lubbock:
18.5% (59)
Texas:
14.4% (8,852)
Number of families with income $100k - 125k:
Lubbock:
9.2% (29)
State:
11.4% (6,997)
Number of families with income $125k - 150k:
Lubbock:
3.9% (12)
State:
7.5% (4,609)
Number of families with income $150k - 200k:
Lubbock:
13.5% (43)
State:
6.9% (4,246)
Number of families with income > $200k:
Lubbock:
7.4% (24)
Texas:
7.0% (4,287)
Median per capita income in Lubbock in 2022:
Lubbock:
$24,639
State:
$28,166
Change in median per capita income between 2000 and 2022:
Lubbock, Texas:
+98.5%
State:
+77.2%
Income statistics for Multirace residents
Median household income in Lubbock, TX in 2022:
Lubbock:
$45,746
State:
$62,748
Change in median household income between 2000 and 2022:
Lubbock, Texas:
+86.8%
State:
+92.3%
Number of households with income < $10k:
Lubbock:
12.3% (2,931)
State:
5.5% (122,324)
Number of households with income $10k - 20k:
Lubbock:
17.3% (4,113)
State:
8.2% (182,232)
Number of households with income $20k - 30k:
Lubbock:
9.9% (2,350)
State:
8.5% (189,456)
Number of households with income $30k - 40k:
Lubbock:
4.9% (1,161)
State:
8.9% (197,499)
Number of households with income $40k - 50k:
Lubbock:
8.4% (2,003)
Texas:
8.7% (191,735)
Number of households with income $50k - 60k:
Lubbock:
6.7% (1,601)
Texas:
8.0% (177,535)
Number of households with income $60k - 75k:
Lubbock:
9.0% (2,129)
State:
10.5% (232,479)
Number of households with income $75k - 100k:
Lubbock:
12.4% (2,958)
Texas:
13.1% (290,448)
Number of households with income $100k - 125k:
Lubbock:
5.1% (1,221)
State:
8.6% (191,595)
Number of households with income $125k - 150k:
Lubbock:
3.2% (766)
State:
6.0% (133,361)
Number of households with income $150k - 200k:
Lubbock:
3.5% (831)
State:
7.2% (159,195)
Number of households with income > $200k:
Lubbock:
7.2% (1,709)
State:
6.7% (148,064)
Aggregate household income in Lubbock in 2022: $1,876,576,700
Median family income in Lubbock in 2022:
Lubbock:
$61,746
Texas:
$69,780
Number of families with income < $10k:
Lubbock:
8.5% (1,200)
State:
4.4% (70,825)
Number of families with income $10k - 20k:
Lubbock:
8.3% (1,172)
State:
5.9% (95,279)
Number of families with income $20k - 30k:
Lubbock:
13.2% (1,862)
State:
7.8% (126,627)
Number of families with income $30k - 40k:
Lubbock:
3.7% (525)
State:
8.5% (137,626)
Number of families with income $40k - 50k:
Lubbock:
7.8% (1,101)
Texas:
8.4% (135,809)
Number of families with income $50k - 60k:
Lubbock:
6.8% (961)
State:
7.9% (127,739)
Number of families with income $60k - 75k:
Lubbock:
6.8% (959)
State:
10.5% (169,549)
Number of families with income $75k - 100k:
Lubbock:
16.9% (2,388)
Texas:
14.0% (226,284)
Number of families with income $100k - 125k:
Lubbock:
5.9% (829)
State:
9.5% (153,597)
Number of families with income $125k - 150k:
Lubbock:
4.8% (682)
Texas:
6.7% (107,900)
Number of families with income $150k - 200k:
Lubbock:
5.5% (772)
State:
8.5% (137,607)
Number of families with income > $200k:
Lubbock:
11.9% (1,677)
State:
7.9% (127,299)
Median non-family income in Lubbock in 2022:
Lubbock:
$20,742
Texas:
$40,634
Change in median non-family income between 2000 and 2022:
Lubbock, Texas:
+55.3%
State:
+77.2%
Median per capita income in Lubbock in 2022:
Lubbock:
$24,089
Texas:
$26,785
Change in median per capita income between 2000 and 2022:
Lubbock, Texas:
+141.2%
State:
+110.9%
Income statistics for other residents
Median household income in Lubbock, TX in 2022:
Lubbock:
$44,783
State:
$57,114
Number of households with income < $10k:
Lubbock:
5.5% (496)
State:
5.9% (54,162)
Number of households with income $10k - 20k:
Lubbock:
18.4% (1,655)
State:
6.8% (62,891)
Number of households with income $20k - 30k:
Lubbock:
12.3% (1,112)
State:
10.6% (97,294)
Number of households with income $30k - 40k:
Lubbock:
11.3% (1,020)
State:
10.8% (99,670)
Number of households with income $40k - 50k:
Lubbock:
3.8% (345)
Texas:
9.3% (85,548)
Number of households with income $50k - 60k:
Lubbock:
7.4% (667)
Texas:
9.0% (82,757)
Number of households with income $60k - 75k:
Lubbock:
7.1% (636)
State:
10.9% (100,326)
Number of households with income $75k - 100k:
Lubbock:
22.9% (2,063)
State:
14.0% (128,767)
Number of households with income $100k - 125k:
Lubbock:
5.2% (473)
Texas:
8.2% (75,218)
Number of households with income $125k - 150k:
Lubbock:
0.4% (34)
Texas:
4.8% (44,223)
Number of households with income $150k - 200k:
Lubbock:
2.9% (259)
Texas:
5.6% (51,376)
Number of households with income > $200k:
Lubbock:
2.9% (259)
State:
4.0% (36,393)
Aggregate household income in Lubbock in 2022: $522,353,200
Median family income in Lubbock in 2022:
Lubbock:
$57,140
Texas:
$60,064
Number of families with income < $10k:
Lubbock:
9.8% (608)
Texas:
6.8% (47,502)
Number of families with income $10k - 20k:
Lubbock:
10.5% (649)
State:
6.0% (41,763)
Number of families with income $20k - 30k:
Lubbock:
8.5% (527)
State:
9.9% (68,761)
Number of families with income $30k - 40k:
Lubbock:
12.2% (758)
State:
9.7% (67,685)
Number of families with income $40k - 50k:
Lubbock:
4.8% (299)
Texas:
9.0% (62,441)
Number of families with income $50k - 60k:
Lubbock:
11.1% (691)
State:
8.5% (59,321)
Number of families with income $60k - 75k:
Lubbock:
9.8% (605)
State:
11.2% (77,588)
Number of families with income $75k - 100k:
Lubbock:
15.1% (935)
State:
14.5% (101,032)
Number of families with income $100k - 125k:
Lubbock:
9.7% (602)
State:
8.8% (61,439)
Number of families with income $125k - 150k:
Lubbock:
2.8% (175)
State:
5.1% (35,727)
Number of families with income $150k - 200k:
Lubbock:
3.2% (198)
State:
5.9% (41,211)
Number of families with income > $200k:
Lubbock:
2.5% (157)
State:
4.5% (31,243)
Median non-family income in Lubbock in 2022:
Lubbock:
$25,478
State:
$38,690
Change in median non-family income between 2000 and 2022:
Lubbock, Texas:
+59.1%
Texas:
+90.2%
Median per capita income in Lubbock in 2022:
Lubbock:
$24,815
Texas:
$23,899
Discuss Lubbock, Texas (TX) on our hugely popular Texas forum.