Haverhill, MA (Massachusetts) Houses and Residents
Estimated median house or condo value in 2022: $455,800 (it was $153,000 in 2000 )
Haverhill:
$455,800Massachusetts:
$534,700
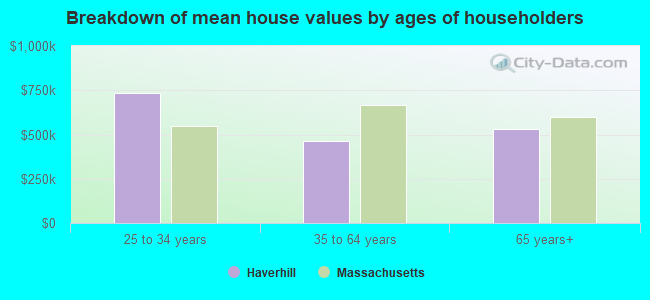
Lower value quartile - upper value quartile: $344,200 - $610,600Mean price in 2022: Detached houses: $502,054 Here:
$502,054State:
$651,570
Townhouses or other attached units: $560,519 Here:
$560,519State:
$617,749
In 2-unit structures: $716,811 Here:
$716,811State:
$594,808
In 3-to-4-unit structures: $324,505 Here:
$324,505State:
$601,912
In 5-or-more-unit structures: $254,951 Here:
$254,951State:
$555,768
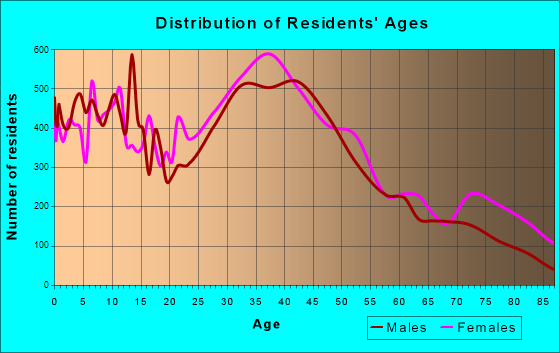
Total population: 62,488 (Urban population: 57,260, Rural population: 1,709 (31 farm, 1,678 nonfarm ))
Houses: 27,232 (25,538 occupied: 16,221 owner occupied, 9,317 renter occupied )
% of renters here:
36%State:
38%
Housing density: 817 houses/condos per square mile
Median price asked for vacant for-sale houses and condos in 2022: $243,201.
Median contract rent in 2022: $1,408 (lower quartile is $1,126, upper quartile is $1,713)
Median rent asked for vacant for-rent units in 2022: $1,635
Median gross rent in Haverhill, MA in 2022: $1,655
Housing units in Haverhill with a mortgage: 12,884 (1,555 second mortgage, 0 home equity loan, 1,457 both second mortgage and home equity loan )Houses without a mortgage: 221
Median household income for houses/condos with a mortgage: $125,901
Median household income for apartments without a mortgage: $63,849
Median monthly housing costs: $1,759
Data:
Median house or condo value ($)
Median house or condo value ($ change since 2000)
Median house or condo value ($) - White
Median house or condo value ($) - Black or African American
Median house or condo value ($) - Asian
Median house or condo value ($) - Hispanic or Latino
Median house or condo value ($) - American Indian and Alaska Native
Median house or condo value ($) - Multirace
Median house or condo value ($) - Other Race
Median price asked for mobile homes ($)
Household density (households per square mile)
Mean house or condo value by units in structure - 1, detached ($)
Mean house or condo value by units in structure - 1, attached ($)
Mean house or condo value by units in structure - 2 ($)
Mean house or condo value by units in structure by units in structure - 3 or 4 ($)
Mean house or condo value by units in structure - 5 or more ($)
Mean house or condo value by units in structure - Boat, RV, van, etc. ($)
Mean house or condo value by units in structure - Mobile home ($)
Median contract rent ($)
Median contract rent - Lower quartile ($)
Median contract rent - Upper quartile ($)
Median gross rent ($)
Urban houses (%)
Rural houses (%)
Houses occupied (%)
Houses occupied (% change since 2000)
Houses owner occupied (%)
Houses owner occupied (% change since 2000)
Houses renter occupied (%)
Houses renter occupied (% change since 2000)
Vacant housing units - For rent (%)
Vacant housing units - For rent (% change since 2000)
Vacant housing units - For sale only (%)
Vacant housing units - For sale only (% change since 2000)
Vacant housing units - Rented or sold, not occupied (%)
Vacant housing units - Rented or sold, not occupied (% change since 2000)
Vacant housing units - For seasonal, recreational, or occasional use (%)
Vacant housing units - For seasonal, recreational, or occasional use (% change since 2000)
Vacant housing units - For migrant workers (%)
Vacant housing units - For migrant workers (% change since 2000)
Vacant housing units - Other vacant (%)
Vacant housing units - Other vacant (% change since 2000)
Median monthly housing costs ($)
Median household income for houses/condos with a mortgage ($)
Median household income for houses/condos without a mortgage ($)
Median household income ($)
Median household income ($) - White
Median household income ($) - Black or African American
Median household income ($) - Asian
Median household income ($) - Hispanic or Latino
Median household income ($) - American Indian and Alaska Native
Median household income ($) - Multirace
Median household income ($) - Other Race
Mortgage status - with mortgage (%)
Mortgage status - with second mortgage (%)
Mortgage status - with home equity loan (%)
Mortgage status - with both second mortgage and home equity loan (%)
Mortgage status - without a mortgage (%)
Median year house/condo built
Median year apartment built
Household type by relationship - Male householder living alone (%)
Household type by relationship - Male householder not living alone (%)
Household type by relationship - Female householder living alone (%)
Household type by relationship - Female householder not living alone (%)
Household type by relationship - Opposite-Sex spouse (%)
Household type by relationship - Same-Sex spouse (%)
Household type by relationship - Opposite-Sex unmarried partner (%)
Household type by relationship - Same-Sex unmarried partner (%)
Household type by relationship - In group quarters (%)
Size of family households - 2-person household (%)
Size of family households - 3-person household (%)
Size of family households - 4-person household (%)
Size of family households - 5-person household (%)
Size of family households - 6-person household (%)
Size of family households - 7-or-more-person household (%)
Size of nonfamily households - 1-person household (%)
Size of nonfamily households - 2-person household (%)
Size of nonfamily households - 3-person household (%)
Size of nonfamily households - 4-person household (%)
Size of nonfamily households - 5-person household (%)
Size of nonfamily households - 6-person household (%)
Size of nonfamily households - 7-or-moreperson household (%)
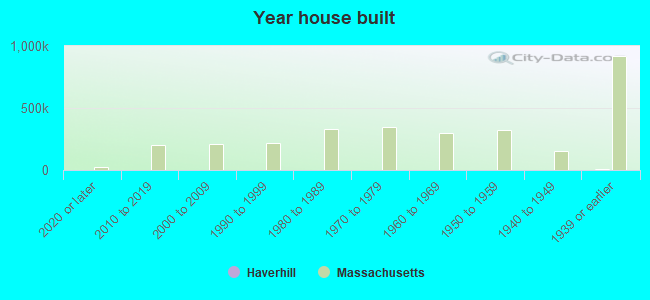
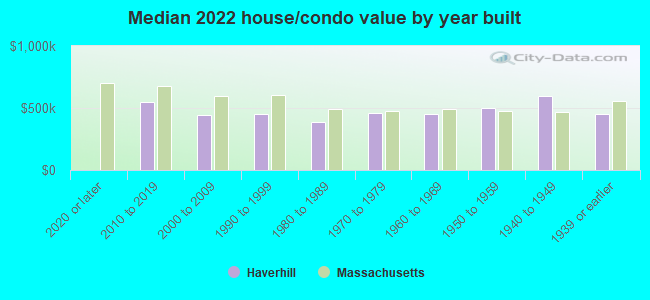
Year house built - Built 2010 or later (%)
Year house built - Built 2000 to 2009 (%)
Year house built - Built 1990 to 1999 (%)
Year house built - Built 1980 to 1989 (%)
Year house built - Built 1970 to 1979 (%)
Year house built - Built 1960 to 1969 (%)
Year house built - Built 1950 to 1959 (%)
Year house built - Built 1940 to 1949 (%)
Year house built - Built 1939 or earlier (%)
Median number of rooms in houses and condos
Median number of rooms in apartments
Median number of bedrooms in owner occupied houses
Mean number of bedrooms in owner occupied houses
Median number of bedrooms in renter occupied houses
Mean number of bedrooms in renter occupied houses
Median number of vehichles in owner occupied houses
Mean number of vehichles in owner occupied houses
Median number of vehichles in renter occupied houses
Mean number of vehichles in renter occupied houses
Rooms in owner-occupied houses - 1 room (%)
Rooms in owner-occupied houses - 2 rooms (%)
Rooms in owner-occupied houses - 3 rooms (%)
Rooms in owner-occupied houses - 4 rooms (%)
Rooms in owner-occupied houses - 5 rooms (%)
Rooms in owner-occupied houses - 6 rooms (%)
Rooms in owner-occupied houses - 7 rooms (%)
Rooms in owner-occupied houses - 8 rooms (%)
Rooms in owner-occupied houses - 9+ rooms (%)
Rooms in renter-occupied houses - 1 room (%)
Rooms in renter-occupied houses - 2 rooms (%)
Rooms in renter-occupied houses - 3 rooms (%)
Rooms in renter-occupied houses - 4 rooms (%)
Rooms in renter-occupied houses - 5 rooms (%)
Rooms in renter-occupied houses - 6 rooms (%)
Rooms in renter-occupied houses - 7 rooms (%)
Rooms in renter-occupied houses - 8 rooms (%)
Rooms in renter-occupied houses - 9+ rooms (%)
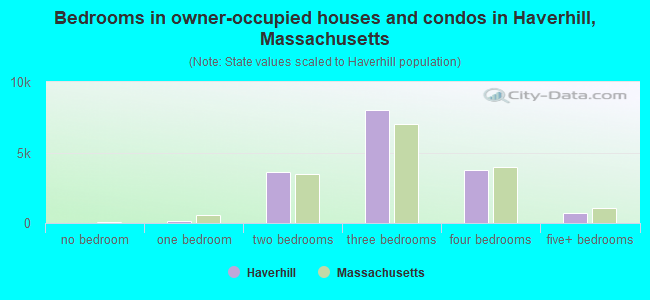
Bedrooms in owner-occupied houses - no bedrooms (%)
Bedrooms in owner-occupied houses - 1 bedroom (%)
Bedrooms in owner-occupied houses - 2 bedrooms (%)
Bedrooms in owner-occupied houses - 3 bedrooms (%)
Bedrooms in owner-occupied houses - 4 bedrooms (%)
Bedrooms in owner-occupied houses - 5+ bedrooms (%)
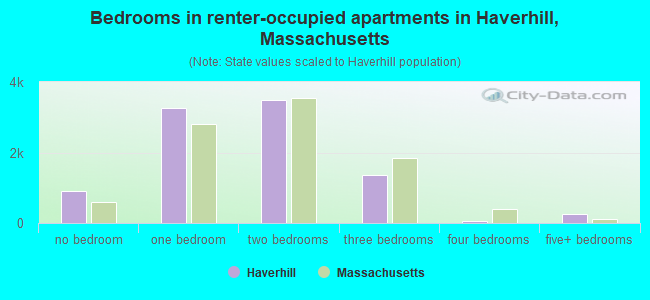
Bedrooms in renter-occupied houses - no bedrooms (%)
Bedrooms in renter-occupied houses - 1 bedroom (%)
Bedrooms in renter-occupied houses - 2 bedrooms (%)
Bedrooms in renter-occupied houses - 3 bedrooms (%)
Bedrooms in renter-occupied houses - 4 bedrooms (%)
Bedrooms in renter-occupied houses - 5+ bedrooms (%)
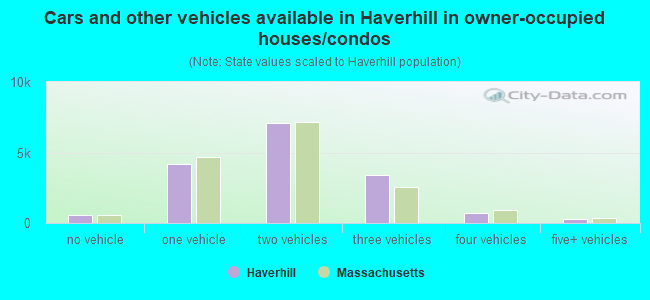
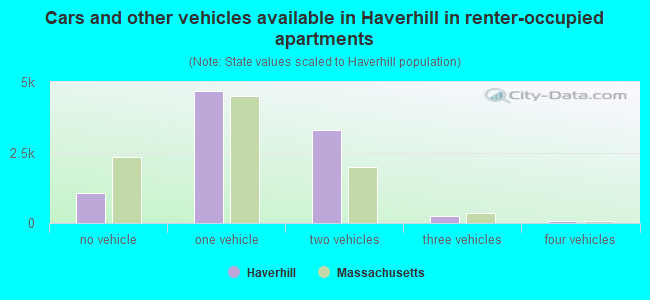
Vehicles available in owner-occupied houses - no vehicle available (%)
Vehicles available in owner-occupied houses - 1 vehicle available(%)
Vehicles available in owner-occupied houses - 2 Vehicles available (%)
Vehicles available in owner-occupied houses - 3 Vehicles available (%)
Vehicles available in owner-occupied houses - 4 Vehicles available (%)
Vehicles available in owner-occupied houses - 5+ Vehicles available (%)
Vehicles available in renter-occupied houses - no vehicle available (%)
Vehicles available in renter-occupied houses - 1 vehicle available (%)
Vehicles available in renter-occupied houses - 2 Vehicles available (%)
Vehicles available in renter-occupied houses - 3 Vehicles available (%)
Vehicles available in renter-occupied houses - 4 Vehicles available (%)
Vehicles available in renter-occupied houses - 5+ Vehicles available (%)
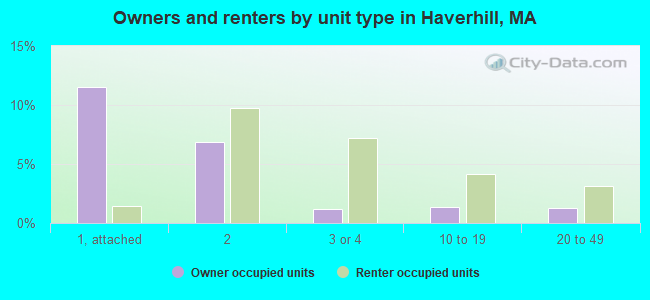
Housing units in structures - 1, detached (%)
Housing units in structures - 1, attached (%)
Housing units in structures - 2 (%)
Housing units in structures - 3 or 4 (%)
Housing units in structures - 5 to 9 (%)
Housing units in structures - 10 to 19 (%)
Housing units in structures - 20 to 49 (%)
Housing units in structures - 50 or more (%)
Housing units in structures - Mobile home (%)
Housing units in structures - Boat, RV, van, etc. (%)
Housing units in structures - Owners - 1, detached (%)
Housing units in structures - Owners - 1, attached (%)
Housing units in structures - Owners - 2 (%)
Housing units in structures - Owners - 3 or 4 (%)
Housing units in structures - Owners - 5 to 9 (%)
Housing units in structures - Owners - 10 to 19 (%)
Housing units in structures - Owners - 20 to 49 (%)
Housing units in structures - Owners - 50 or more (%)
Housing units in structures - Owners - Mobile home (%)
Housing units in structures - Owners - Boat, RV, van, etc. (%)
Housing units in structures - Renters - 1, detached (%)
Housing units in structures - Renters - 1, attached (%)
Housing units in structures - Renters - 2 (%)
Housing units in structures - Renters - 3 or 4 (%)
Housing units in structures - Renters - 5 to 9 (%)
Housing units in structures - Renters - 10 to 19 (%)
Housing units in structures - Renters - 20 to 49 (%)
Housing units in structures - Renters - 50 or more (%)
Housing units in structures - Renters - Mobile home (%)
Housing units in structures - Renters - Boat, RV, van, etc. (%)
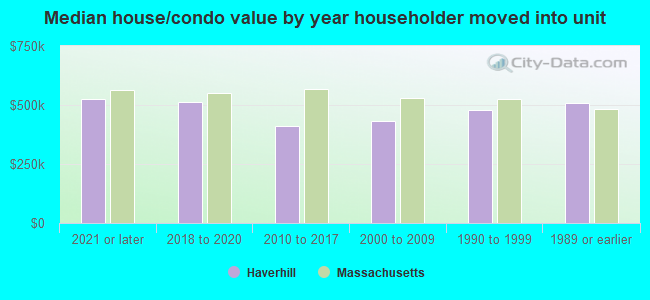
House/condo owner moved in on average (years ago)
Renter moved in on average (years ago)
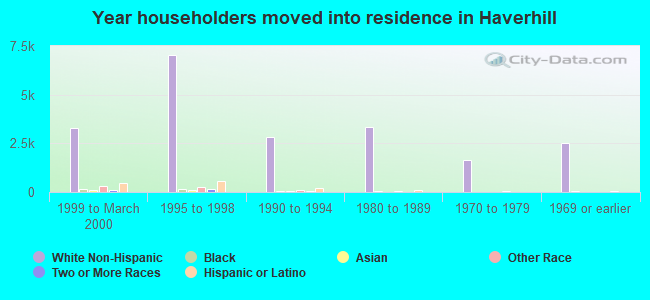
Year householder moved into unit - Moved in 1999 to March 2000 (%)
Year householder moved into unit - Moved in 1999 to March 2000 (%) - White
Year householder moved into unit - Moved in 1999 to March 2000 (%) - Black or African American
Year householder moved into unit - Moved in 1999 to March 2000 (%) - Asian
Year householder moved into unit - Moved in 1999 to March 2000 (%) - Hispanic or Latino
Year householder moved into unit - Moved in 1999 to March 2000 (%) - American Indian and Alaska Native
Year householder moved into unit - Moved in 1999 to March 2000 (%) - Multirace
Year householder moved into unit - Moved in 1999 to March 2000 (%) - Other Race
Year householder moved into unit - Moved in 1995 to 1998 (%)
Year householder moved into unit - Moved in 1995 to 1998 (%) - White
Year householder moved into unit - Moved in 1995 to 1998 (%) - Black or African American
Year householder moved into unit - Moved in 1995 to 1998 (%) - Asian
Year householder moved into unit - Moved in 1995 to 1998 (%) - Hispanic or Latino
Year householder moved into unit - Moved in 1995 to 1998 (%) - American Indian and Alaska Native
Year householder moved into unit - Moved in 1995 to 1998 (%) - Multirace
Year householder moved into unit - Moved in 1995 to 1998 (%) - Other Race
Year householder moved into unit - Moved in 1990 to 1994 (%)
Year householder moved into unit - Moved in 1990 to 1994 (%) - White
Year householder moved into unit - Moved in 1990 to 1994 (%) - Black or African American
Year householder moved into unit - Moved in 1990 to 1994 (%) - Asian
Year householder moved into unit - Moved in 1990 to 1994 (%) - Hispanic or Latino
Year householder moved into unit - Moved in 1990 to 1994 (%) - American Indian and Alaska Native
Year householder moved into unit - Moved in 1990 to 1994 (%) - Multirace
Year householder moved into unit - Moved in 1990 to 1994 (%) - Other Race
Year householder moved into unit - Moved in 1980 to 1989 (%)
Year householder moved into unit - Moved in 1980 to 1989 (%) - White
Year householder moved into unit - Moved in 1980 to 1989 (%) - Black or African American
Year householder moved into unit - Moved in 1980 to 1989 (%) - Asian
Year householder moved into unit - Moved in 1980 to 1989 (%) - Hispanic or Latino
Year householder moved into unit - Moved in 1980 to 1989 (%) - American Indian and Alaska Native
Year householder moved into unit - Moved in 1980 to 1989 (%) - Multirace
Year householder moved into unit - Moved in 1980 to 1989 (%) - Other Race
Year householder moved into unit - Moved in 1970 to 1979 (%)
Year householder moved into unit - Moved in 1970 to 1979 (%) - White
Year householder moved into unit - Moved in 1970 to 1979 (%) - Black or African American
Year householder moved into unit - Moved in 1970 to 1979 (%) - Asian
Year householder moved into unit - Moved in 1970 to 1979 (%) - Hispanic or Latino
Year householder moved into unit - Moved in 1970 to 1979 (%) - American Indian and Alaska Native
Year householder moved into unit - Moved in 1970 to 1979 (%) - Multirace
Year householder moved into unit - Moved in 1970 to 1979 (%) - Other Race
Year householder moved into unit - Moved in 1969 or earlier (%)
Year householder moved into unit - Moved in 1969 or earlier (%) - White
Year householder moved into unit - Moved in 1969 or earlier (%) - Black or African American
Year householder moved into unit - Moved in 1969 or earlier (%) - Asian
Year householder moved into unit - Moved in 1969 or earlier (%) - Hispanic or Latino
Year householder moved into unit - Moved in 1969 or earlier (%) - American Indian and Alaska Native
Year householder moved into unit - Moved in 1969 or earlier (%) - Multirace
Year householder moved into unit - Moved in 1969 or earlier (%) - Other Race
Housing units lacking complete plumbing facilities (%)
Housing units lacking complete kitchen facilities (%)
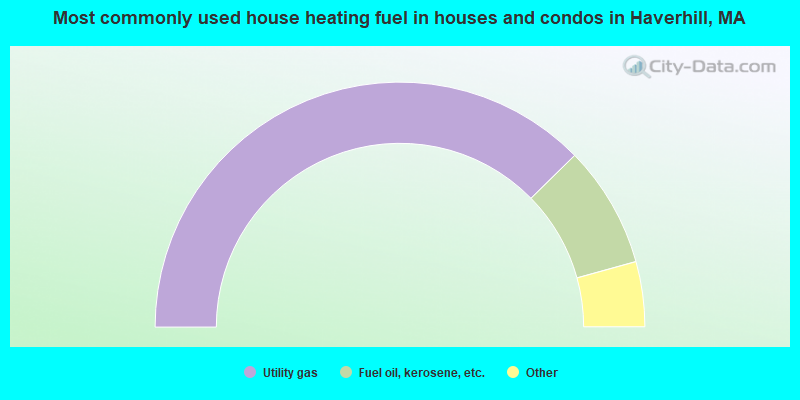
House heating fuel used in houses and condos - Utility gas (%)
House heating fuel used in houses and condos - Bottled, tank, or LP gas (%)
House heating fuel used in houses and condos - Electricity (%)
House heating fuel used in houses and condos - Fuel oil, kerosene, etc. (%)
House heating fuel used in houses and condos - Coal or coke (%)
House heating fuel used in houses and condos - Wood (%)
House heating fuel used in houses and condos - Solar energy (%)
House heating fuel used in houses and condos - Other fuel (%)
House heating fuel used in houses and condos - No fuel used (%)
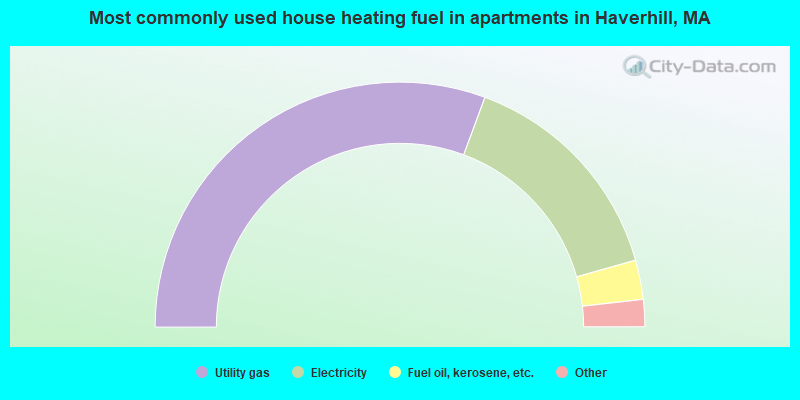
House heating fuel used in apartments - Utility gas (%)
House heating fuel used in apartments - Bottled, tank, or LP gas (%)
House heating fuel used in apartments - Electricity (%)
House heating fuel used in apartments - Fuel oil, kerosene, etc. (%)
House heating fuel used in apartments - Coal or coke (%)
House heating fuel used in apartments - Wood (%)
House heating fuel used in apartments - Solar energy (%)
House heating fuel used in apartments - Other fuel (%)
House heating fuel used in apartments - No fuel used (%)
Latest news about housing in Haverhill, MA collected exclusively by city-data.com from local newspapers, TV, and radio stations
Median year house/condo built: 1973Median year apartment built: 1953Household type by relationship:
Households: 67,151
Male householders: 10,907 (2,687 living alone ), Female householders: 14,631 (4,089 living alone )10,691 spouses (10,648 opposite-sex spouses ), 3,878 unmarried partners , (3,536 opposite-sex unmarried partners ), 19,463 children (18,878 natural , 82 adopted , 503 stepchildren ), 1,349 grandchildren , 676 brothers or sisters , 1,209 parents , 468 foster children , 574 other relatives , 2,320 non-relatives In group quarters: 985
Size of family households: 5,206 2-persons , 4,880 3-persons , 3,828 4-persons , 1,333 5-persons , 344 6-persons , 186 7-or-more-persons .
Size of nonfamily households: 6,776 1-person , 2,639 2-persons , 93 3-persons , 203 4-persons , 50 7-or-more-persons .
8,739 married couples with children. single-parent households (2,076 men , 1,516 women ).
74.4% of residents of Haverhill speak English at home. of residents speak Spanish at home (67% speak English very well , 12% speak English well , 13% speak English not well , 8% don't speak English at all ).of residents speak other Indo-European language at home (76% speak English very well , 15% speak English well , 7% speak English not well , 2% don't speak English at all ).of residents speak Asian or Pacific Island language at home (58% speak English very well , 38% speak English well , 5% speak English not well ).of residents speak other language at home (90% speak English very well , 10% speak English well ).
Foreign born population: 11,125 (16.6%)of them are naturalized citizens )
Median number of rooms in houses and condos:
Median number of rooms in apartments
Owner-occupied Renter-occupied
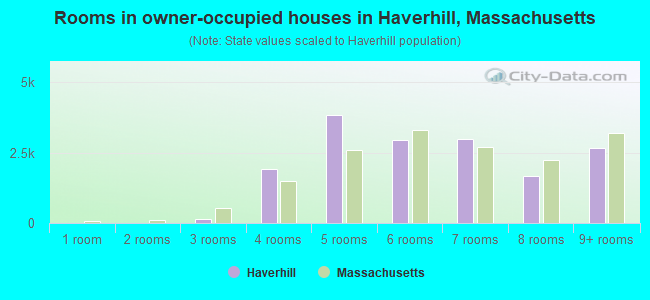
Rooms in owner-occupied houses in Haverhill, Massachusetts
0 1 room 0 2 rooms 156 3 rooms 1,932 4 rooms 3,836 5 rooms 2,949 6 rooms 3,000 7 rooms 1,667 8 rooms 2,681 9+ rooms
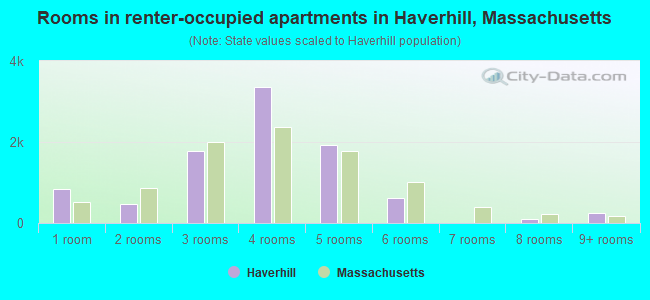
Rooms in renter-occupied apartments in Haverhill, Massachusetts
837 1 room 459 2 rooms 1,778 3 rooms 3,359 4 rooms 1,916 5 rooms 622 6 rooms 0 7 rooms 90 8 rooms 256 9+ rooms
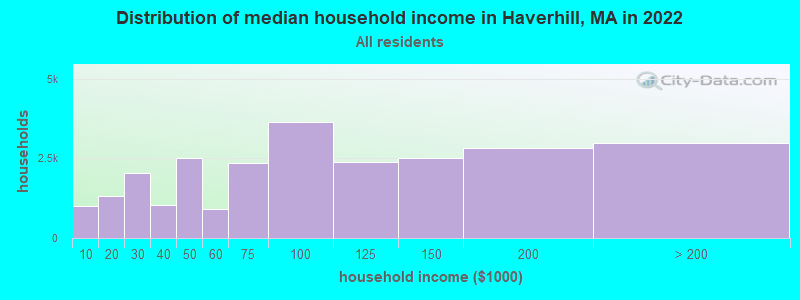
Haverhill, MA household income distribution 1,008 Less than $10,0001,331 $10,000 to $19,9992,033 $20,000 to $29,9991,037 $30,000 to $39,9992,517 $40,000 to $49,999917 $50,000 to $59,9992,344 $60,000 to $74,9993,638 $75,000 to $99,9992,397 $100,000 to $124,9992,515 $125,000 to $149,9992,810 $150,000 to $199,9992,991 $200,000 or more
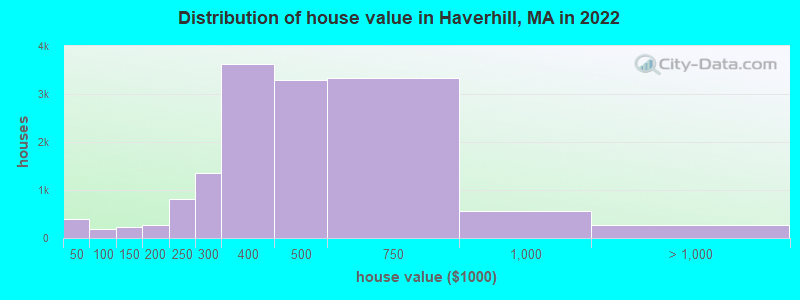
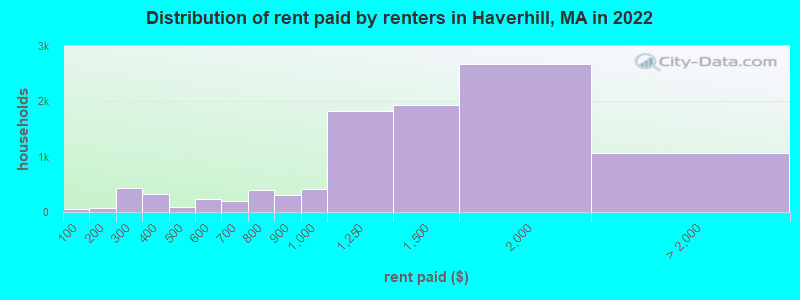
Home value of owner - occupied houses in 2022 in Haverhill, MA 149 Less than $10,00057 $10,000 to $14,99994 $25,000 to $29,99914 $30,000 to $34,99945 $35,000 to $39,99925 $40,000 to $49,99934 $50,000 to $59,99972 $70,000 to $79,99957 $80,000 to $89,999182 $100,000 to $124,99941 $125,000 to $149,999103 $150,000 to $174,999167 $175,000 to $199,999802 $200,000 to $249,9991,349 $250,000 to $299,9993,626 $300,000 to $399,9993,296 $400,000 to $499,9993,338 $500,000 to $749,999561 $750,000 to $999,999189 $1,000,000 to $1,499,99975 $2,000,000 or moreRent paid by renters in 2022 in Haverhill, MA 60 Less than $10076 $100 to $149120 $200 to $249321 $250 to $299155 $300 to $349169 $350 to $39956 $400 to $44929 $450 to $499113 $500 to $549120 $550 to $599100 $600 to $64991 $650 to $699284 $700 to $749112 $750 to $799306 $800 to $899422 $900 to $9991,824 $1,000 to $1,2491,926 $1,250 to $1,4992,673 $1,500 to $1,999551 $2,000 to $2,49988 $2,500 to $2,99970 $3,000 to $3,49957 $3,500 or more306 No cash rent
Percentage of workers working in this county: 71.6%Number of people working at home: 3,936 (11.2% of all workers )
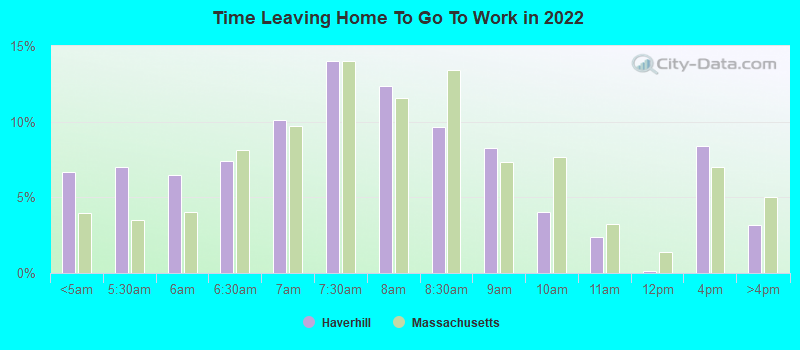
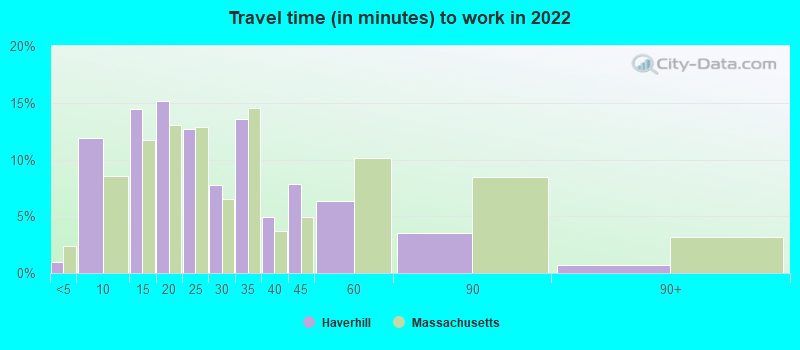
Travel time to work (commute)
Less than 5 minutes: 1075 to 9 minutes: 2,41610 to 14 minutes: 4,24215 to 19 minutes: 5,80620 to 24 minutes: 2,40225 to 29 minutes: 1,77230 to 34 minutes: 3,60535 to 39 minutes: 75440 to 44 minutes: 1,69645 to 59 minutes: 4,47460 to 89 minutes: 1,60090 or more minutes: 667
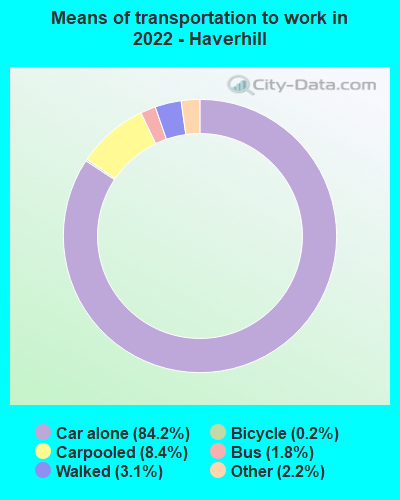
Means of transportation to work:
Drove a car alone: 15,950 (70.0%)Carpooled: 1,209 (5.3%)Bus : 287 (1.3%)Subway or elevated rail : 8 (0.0%)Taxi: 634 (2.8%)Bicycle: 59 (0.3%)Walked: 519 (2.3%)Worked at home: 3,936 (17.3%)
Unemployment by race in 2022
Unemployment rate for White non-Hispanic residents 1.0% Males1.0% FemalesUnemployment rate for Black residents 6.7% Males20.3% FemalesUnemployment rate for Asian residents 25.5% Males4.6% FemalesUnemployment rate for other race residents 7.2% Males4.3% FemalesUnemployment rate for two or more race residents 4.4% Males6.3% FemalesUnemployment rate for Hispanic or Latino residents 6.9% Males6.1% Females
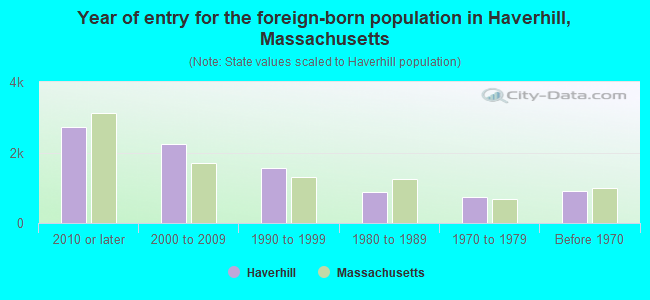
Year of entry for the foreign-born population in Haverhill, Massachusetts
2,725 2010 or later 2,238 2000 to 2009 1,565 1990 to 1999 884 1980 to 1989 750 1970 to 1979 902 Before 1970
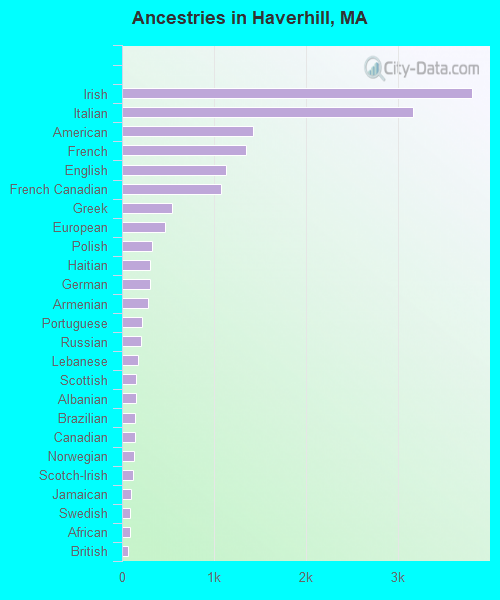
First ancestries reported:
Irish: 3,804 (12.7%)
Italian: 3,172 (10.6%)
American: 1,425 (4.8%)
French: 1,351 (4.5%)
English: 1,137 (3.8%)
French Canadian: 1,082 (3.6%)
Greek: 541 (1.8%)
European: 469 (1.6%)
Polish: 327 (1.1%)
Haitian: 304 (1.0%)
German: 303 (1.0%)
Armenian: 283 (0.9%)
Portuguese: 218 (0.7%)
Russian: 211 (0.7%)
Lebanese: 169 (0.6%)
Scottish: 155 (0.5%)
Albanian: 150 (0.5%)
Brazilian: 146 (0.5%)
Canadian: 145 (0.5%)
Norwegian: 132 (0.4%)
Scotch-Irish: 117 (0.4%)
Jamaican: 101 (0.3%)
Swedish: 89 (0.3%)
African: 86 (0.3%)
British: 65 (0.2%)
Hungarian: 57 (0.2%)
Ghanaian: 49 (0.2%)
Macedonian: 49 (0.2%)
British West Indian: 49 (0.2%)
Trinidadian and Tobagonian: 43 (0.1%)
Scandinavian: 40 (0.1%)
West Indian: 37 (0.1%)
Lithuanian: 34 (0.1%)
Slovak: 34 (0.1%)
Kenyan: 30 (0.1%)
Iranian: 25 (0.08%)
Croatian: 18 (0.06%)
Jordanian: 16 (0.05%)
Austrian: 15 (0.05%)
Basque: 15 (0.05%)
Welsh: 14 (0.05%)
Slavic: 13 (0.04%)
Ethiopian: 12 (0.04%)
Ukrainian: 12 (0.04%)
Danish: 10 (0.03%)
Israeli: 10 (0.03%)
Eastern European: 9 (0.03%)
Nigerian: 8 (0.03%)
Turkish: 8 (0.03%)
Czech: 7 (0.02%)
Celtic: 5 (0.02%)
Finnish: 5 (0.02%)
Palestinian: 4 (0.01%)
Liberian: 4 (0.01%)
Most common places of birth for foreign-born residents (%): Dominican Republic Haverhill:
43.0% (3,573)Massachusetts:
8.3% (101,767)
Colombia Haverhill:
7.5% (625)Massachusetts:
2.3% (27,810)
Guatemala Haverhill:
4.5% (370)Massachusetts:
2.7% (32,733)
Haiti Haverhill:
4.0% (336)Massachusetts:
4.9% (60,432)
Dominica Haverhill:
3.3% (276)Massachusetts:
0.2% (2,643)
Canada Haverhill:
3.1% (254)Massachusetts:
2.3% (28,158)
El Salvador Haverhill:
2.8% (233)Massachusetts:
3.7% (45,667)
Vietnam Haverhill:
2.5% (210)Massachusetts:
3.0% (37,197)
Brazil Haverhill:
2.2% (182)Massachusetts:
7.6% (92,959)
Honduras Haverhill:
2.0% (163)Massachusetts:
1.1% (13,563)
Greece Haverhill:
1.9% (156)Massachusetts:
0.8% (10,043)
Albania Haverhill:
1.6% (132)Massachusetts:
1.1% (13,076)
Jamaica Haverhill:
1.5% (125)Massachusetts:
1.7% (21,468)
Place of birth for U.S.-born residents:
This state: 43,887Other state: 9,535Northeast: 6,116Midwest: 905South: 1,610West: 904 89.5% of Haverhill residents lived in the same house 1 years ago.
Out of people who lived in different houses, 38.1% lived in this county.
Out of people who lived in different counties, 63.3% lived in Massachusetts.
Haverhill:
89.5%State average:
87.7%
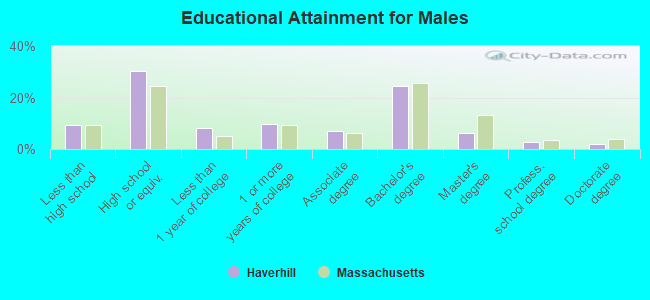
Education attainment for males 25 years and older:
No schooling: 684Nursery to 4th grade: 995th and 6th grade: 587th and 8th grade: 679th grade: 28710th grade: 22511th grade: 17912th grade, no diploma: 491High school graduate (or equivalency): 6,817Less than 1 year of college: 1,839Some college more than 1 year, no degree: 2,167Associate degree: 1,564Bachelor's degree: 5,528Master's degree: 1,411Professional school degree: 652Doctorate degree: 481
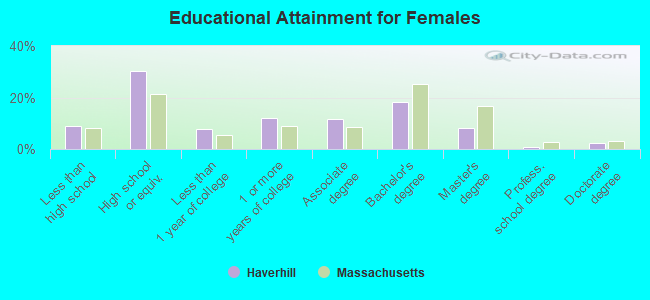
Education attainment for females 25 years and older:
No schooling: 960Nursery to 4th grade: 05th and 6th grade: 477th and 8th grade: 2869th grade: 23910th grade: 14711th grade: 10512th grade, no diploma: 361High school graduate (or equivalency): 7,229Less than 1 year of college: 1,829Some college more than 1 year, no degree: 2,857Associate degree: 2,759Bachelor's degree: 4,322Master's degree: 1,892Professional school degree: 156Doctorate degree: 547
Housing units in structures:
One, detached: 10,638One, attached: 3,312Two: 4,8673 or 4: 2,6735 to 9: 1,27010 to 19: 1,60620 to 49: 1,12750 or more: 1,739Housing units lacking complete plumbing facilities in 2022: 1.4%Housing units lacking complete kitchen facilities in 2022: 3.3%House/condo owner moved in on average 11 years ago
Renter moved in on average 2 years ago
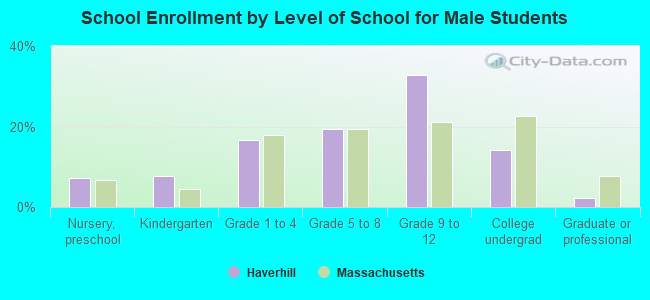
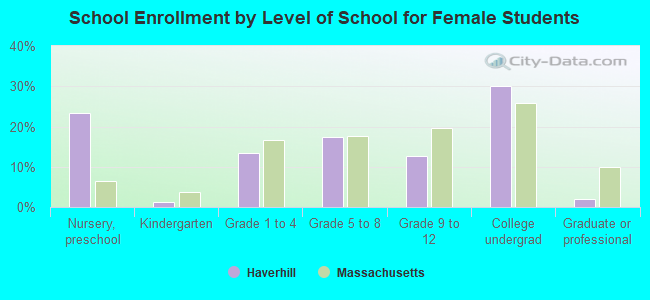
Private vs. public school enrollment:
Students in private schools in grades 1 to 8 (elementary and middle school): 910 Here:
16.9%Massachusetts:
10.3%
Students in private schools in grades 9 to 12 (high school): 444 Here:
12.5%Massachusetts:
12.3%
Students in private undergraduate colleges: 1,159 Here:
31.3%Massachusetts:
51.2%