Races in Haverhill, Massachusetts (MA) Detailed Stats
Data:
Races - White alone (%)
Races - White alone (% change since 2000)
Races - Black alone (%)
Races - Black alone (% change since 2000)
Races - American Indian alone (%)
Races - American Indian alone (% change since 2000)
Races - Asian alone (%)
Races - Asian alone (% change since 2000)
Races - Hispanic (%)
Races - Hispanic (% change since 2000)
Races - Native Hawaiian and Other Pacific Islander alone (%)
Races - Native Hawaiian and Other Pacific Islander alone (% change since 2000)
Races - Two or more races(%)
Races - Two or more races(% change since 2000)
Races - Other race alone (%)
Races - Other race alone (% change since 2000)
Racial diversity
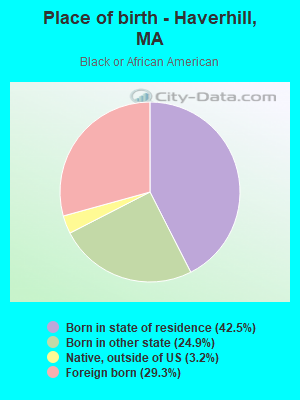
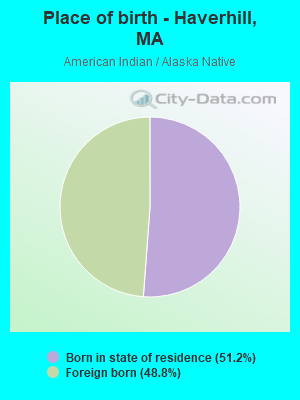
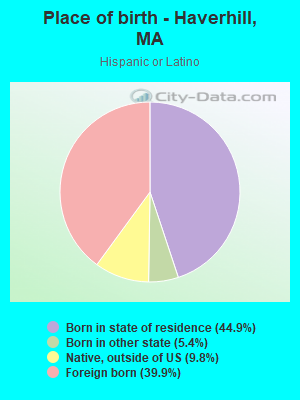
Place of birth - Born in state of residence (%)
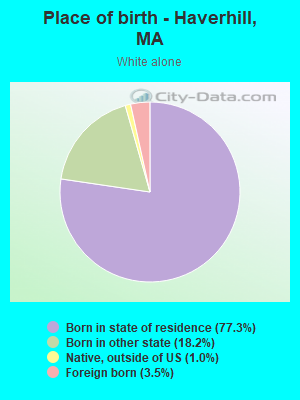
Place of birth - Born in state of residence (%) - White
Place of birth - Born in state of residence (%) - Black or African American
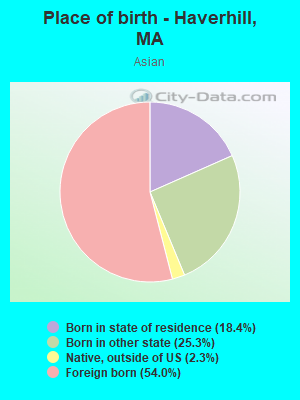
Place of birth - Born in state of residence (%) - Asian
Place of birth - Born in state of residence (%) - Hispanic or Latino
Place of birth - Born in state of residence (%) - American Indian and Alaska Native
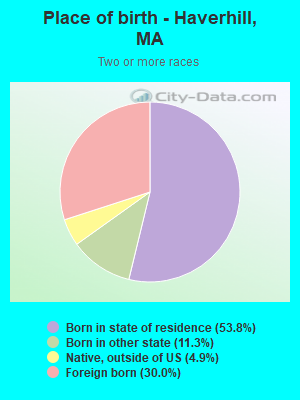
Place of birth - Born in state of residence (%) - Multirace
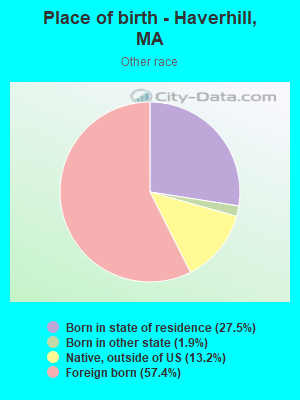
Place of birth - Born in state of residence (%) - Other Race
Place of birth - Born in other state (%)
Place of birth - Born in other state (%) - White
Place of birth - Born in other state (%) - Black or African American
Place of birth - Born in other state (%) - Asian
Place of birth - Born in other state (%) - Hispanic or Latino
Place of birth - Born in other state (%) - American Indian and Alaska Native
Place of birth - Born in other state (%) - Multirace
Place of birth - Born in other state (%) - Other Race
Place of birth - Native, outside of US (%)
Place of birth - Native, outside of US (%) - White
Place of birth - Native, outside of US (%) - Black or African American
Place of birth - Native, outside of US (%) - Asian
Place of birth - Native, outside of US (%) - Hispanic or Latino
Place of birth - Native, outside of US (%) - American Indian and Alaska Native
Place of birth - Native, outside of US (%) - Multirace
Place of birth - Native, outside of US (%) - Other Race
Place of birth - Foreign born (%)
Place of birth - Foreign born (%) - White
Place of birth - Foreign born (%) - Black or African American
Place of birth - Foreign born (%) - Asian
Place of birth - Foreign born (%) - Hispanic or Latino
Place of birth - Foreign born (%) - American Indian and Alaska Native
Place of birth - Foreign born (%) - Multirace
Place of birth - Foreign born (%) - Other Race
Residents speaking English at home (%)
Residents speaking English at home - Born in the United States (%)
Residents speaking English at home - Native, born elsewhere (%)
Residents speaking English at home - Foreign born (%)
Residents speaking Spanish at home (%)
Residents speaking Spanish at home - Born in the United States (%)
Residents speaking Spanish at home - Native, born elsewhere (%)
Residents speaking Spanish at home - Foreign born (%)
Residents speaking other language at home (%)
Residents speaking other language at home - Born in the United States (%)
Residents speaking other language at home - Native, born elsewhere (%)
Residents speaking other language at home - Foreign born (%)
Marital status - Never married (%)
Marital status - Now married (%)
Marital status - Separated (%)
Marital status - Widowed (%)
Marital status - Divorced (%)
Ancestries Reported - Arab (%)
Ancestries Reported - Czech (%)
Ancestries Reported - Danish (%)
Ancestries Reported - Dutch (%)
Ancestries Reported - English (%)
Ancestries Reported - French (%)
Ancestries Reported - French Canadian (%)
Ancestries Reported - German (%)
Ancestries Reported - Greek (%)
Ancestries Reported - Hungarian (%)
Ancestries Reported - Irish (%)
Ancestries Reported - Italian (%)
Ancestries Reported - Lithuanian (%)
Ancestries Reported - Norwegian (%)
Ancestries Reported - Polish (%)
Ancestries Reported - Portuguese (%)
Ancestries Reported - Russian (%)
Ancestries Reported - Scotch-Irish (%)
Ancestries Reported - Scottish (%)
Ancestries Reported - Slovak (%)
Ancestries Reported - Subsaharan African (%)
Ancestries Reported - Swedish (%)
Ancestries Reported - Swiss (%)
Ancestries Reported - Ukrainian (%)
Ancestries Reported - United States (%)
Ancestries Reported - Welsh (%)
Ancestries Reported - West Indian (%)
Ancestries Reported - Other (%)
Geographical mobility - Same house 1 year ago (%)
Geographical mobility - Same house 1 year ago (%) - White
Geographical mobility - Same house 1 year ago (%) - Black or African American
Geographical mobility - Same house 1 year ago (%) - Asian
Geographical mobility - Same house 1 year ago (%) - Hispanic or Latino
Geographical mobility - Same house 1 year ago (%) - American Indian and Alaska Native
Geographical mobility - Same house 1 year ago (%) - Multirace
Geographical mobility - Same house 1 year ago (%) - Other Race
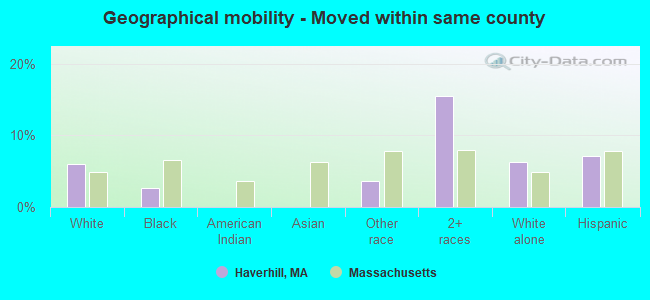
Geographical mobility - Moved within same county (%)
Geographical mobility - Moved within same county (%) - White
Geographical mobility - Moved within same county (%) - Black or African American
Geographical mobility - Moved within same county (%) - Asian
Geographical mobility - Moved within same county (%) - Hispanic or Latino
Geographical mobility - Moved within same county (%) - American Indian and Alaska Native
Geographical mobility - Moved within same county (%) - Multirace
Geographical mobility - Moved within same county (%) - Other Race
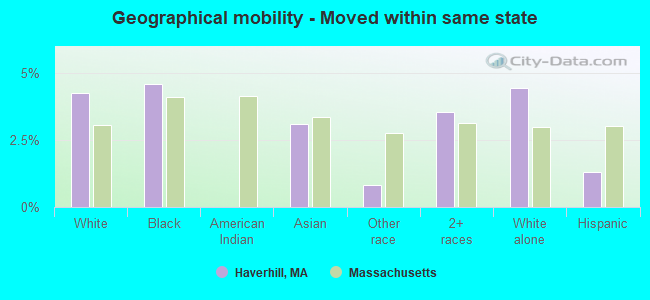
Geographical mobility - Moved from different county within same state (%)
Geographical mobility - Moved from different county within same state (%) - White
Geographical mobility - Moved from different county within same state (%) - Black or African American
Geographical mobility - Moved from different county within same state (%) - Asian
Geographical mobility - Moved from different county within same state (%) - Hispanic or Latino
Geographical mobility - Moved from different county within same state (%) - American Indian and Alaska Native
Geographical mobility - Moved from different county within same state (%) - Multirace
Geographical mobility - Moved from different county within same state (%) - Other Race
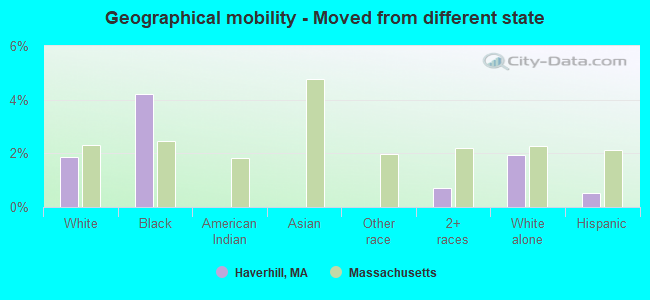
Geographical mobility - Moved from different state (%)
Geographical mobility - Moved from different state (%) - White
Geographical mobility - Moved from different state (%) - Black or African American
Geographical mobility - Moved from different state (%) - Asian
Geographical mobility - Moved from different state (%) - Hispanic or Latino
Geographical mobility - Moved from different state (%) - American Indian and Alaska Native
Geographical mobility - Moved from different state (%) - Multirace
Geographical mobility - Moved from different state (%) - Other Race
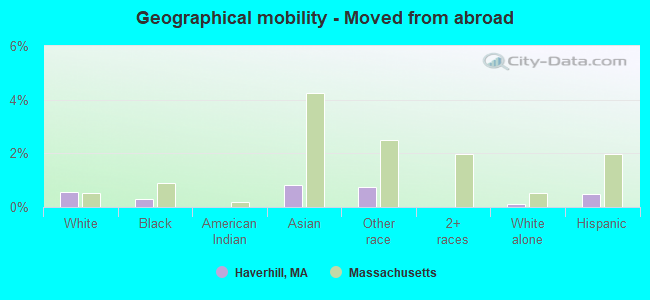
Geographical mobility - Moved from abroad (%)
Geographical mobility - Moved from abroad (%) - White
Geographical mobility - Moved from abroad (%) - Black or African American
Geographical mobility - Moved from abroad (%) - Asian
Geographical mobility - Moved from abroad (%) - Hispanic or Latino
Geographical mobility - Moved from abroad (%) - American Indian and Alaska Native
Geographical mobility - Moved from abroad (%) - Multirace
Geographical mobility - Moved from abroad (%) - Other Race
Place of birth for the foreign-born population - Ireland (%)
Place of birth for the foreign-born population - Denmark (%)
Place of birth for the foreign-born population - Norway (%)
Place of birth for the foreign-born population - Sweden (%)
Place of birth for the foreign-born population - United Kingdom (%)
Place of birth for the foreign-born population - England (%)
Place of birth for the foreign-born population - Scotland (%)
Place of birth for the foreign-born population - Other Northern Europe (%)
Place of birth for the foreign-born population - Austria (%)
Place of birth for the foreign-born population - Belgium (%)
Place of birth for the foreign-born population - France (%)
Place of birth for the foreign-born population - Germany (%)
Place of birth for the foreign-born population - Netherlands (%)
Place of birth for the foreign-born population - Switzerland (%)
Place of birth for the foreign-born population - Other Western Europe (%)
Place of birth for the foreign-born population - Greece (%)
Place of birth for the foreign-born population - Italy (%)
Place of birth for the foreign-born population - Portugal (%)
Place of birth for the foreign-born population - Spain (%)
Place of birth for the foreign-born population - Other Southern Europe (%)
Place of birth for the foreign-born population - Albania (%)
Place of birth for the foreign-born population - Belarus (%)
Place of birth for the foreign-born population - Bosnia and Herzegovina (%)
Place of birth for the foreign-born population - Bulgaria (%)
Place of birth for the foreign-born population - Croatia (%)
Place of birth for the foreign-born population - Czechoslovakia (%)
Place of birth for the foreign-born population - Hungary (%)
Place of birth for the foreign-born population - Latvia (%)
Place of birth for the foreign-born population - Lithuania (%)
Place of birth for the foreign-born population - North Macedonia (Macedonia) (%)
Place of birth for the foreign-born population - Moldova (%)
Place of birth for the foreign-born population - Poland (%)
Place of birth for the foreign-born population - Romania (%)
Place of birth for the foreign-born population - Russia (%)
Place of birth for the foreign-born population - Serbia (%)
Place of birth for the foreign-born population - Ukraine (%)
Place of birth for the foreign-born population - Other Eastern Europe (%)
Place of birth for the foreign-born population - China (%)
Place of birth for the foreign-born population - Hong Kong (%)
Place of birth for the foreign-born population - Taiwan (%)
Place of birth for the foreign-born population - Japan (%)
Place of birth for the foreign-born population - Korea (%)
Place of birth for the foreign-born population - Other Eastern Asia (%)
Place of birth for the foreign-born population - Afghanistan (%)
Place of birth for the foreign-born population - Bangladesh (%)
Place of birth for the foreign-born population - India (%)
Place of birth for the foreign-born population - Iran (%)
Place of birth for the foreign-born population - Kazakhstan (%)
Place of birth for the foreign-born population - Nepal (%)
Place of birth for the foreign-born population - Pakistan (%)
Place of birth for the foreign-born population - Sri Lanka (%)
Place of birth for the foreign-born population - Uzbekistan (%)
Place of birth for the foreign-born population - Other South Central Asia (%)
Place of birth for the foreign-born population - Burma (%)
Place of birth for the foreign-born population - Cambodia (%)
Place of birth for the foreign-born population - Indonesia (%)
Place of birth for the foreign-born population - Laos (%)
Place of birth for the foreign-born population - Malaysia (%)
Place of birth for the foreign-born population - Philippines (%)
Place of birth for the foreign-born population - Singapore (%)
Place of birth for the foreign-born population - Thailand (%)
Place of birth for the foreign-born population - Vietnam (%)
Place of birth for the foreign-born population - Other South Eastern Asia (%)
Place of birth for the foreign-born population - Armenia (%)
Place of birth for the foreign-born population - Iraq (%)
Place of birth for the foreign-born population - Israel (%)
Place of birth for the foreign-born population - Jordan (%)
Place of birth for the foreign-born population - Kuwait (%)
Place of birth for the foreign-born population - Lebanon (%)
Place of birth for the foreign-born population - Saudi Arabia (%)
Place of birth for the foreign-born population - Syria (%)
Place of birth for the foreign-born population - Turkey (%)
Place of birth for the foreign-born population - Yemen (%)
Place of birth for the foreign-born population - Other Western Asia (%)
Place of birth for the foreign-born population - Eritrea (%)
Place of birth for the foreign-born population - Ethiopia (%)
Place of birth for the foreign-born population - Kenya (%)
Place of birth for the foreign-born population - Somalia (%)
Place of birth for the foreign-born population - Uganda (%)
Place of birth for the foreign-born population - Zimbabwe (%)
Place of birth for the foreign-born population - Other Eastern Africa (%)
Place of birth for the foreign-born population - Cameroon (%)
Place of birth for the foreign-born population - Congo (%)
Place of birth for the foreign-born population - Democratic Republic of Congo (Zaire) (%)
Place of birth for the foreign-born population - Other Middle Africa (%)
Place of birth for the foreign-born population - Egypt (%)
Place of birth for the foreign-born population - Morocco (%)
Place of birth for the foreign-born population - Sudan (%)
Place of birth for the foreign-born population - Other Northern Africa (%)
Place of birth for the foreign-born population - South Africa (%)
Place of birth for the foreign-born population - Other Southern Africa (%)
Place of birth for the foreign-born population - Cabo Verde (%)
Place of birth for the foreign-born population - Ghana (%)
Place of birth for the foreign-born population - Liberia (%)
Place of birth for the foreign-born population - Nigeria (%)
Place of birth for the foreign-born population - Senegal (%)
Place of birth for the foreign-born population - Sierra Leone (%)
Place of birth for the foreign-born population - Other Western Africa (%)
Place of birth for the foreign-born population - Australia (%)
Place of birth for the foreign-born population - New Zealand (%)
Place of birth for the foreign-born population - Fiji (%)
Place of birth for the foreign-born population - Micronesia (%)
Place of birth for the foreign-born population - Bahamas (%)
Place of birth for the foreign-born population - Barbados (%)
Place of birth for the foreign-born population - Cuba (%)
Place of birth for the foreign-born population - Dominica (%)
Place of birth for the foreign-born population - Dominican Republic (%)
Place of birth for the foreign-born population - Grenada (%)
Place of birth for the foreign-born population - Haiti (%)
Place of birth for the foreign-born population - Jamaica (%)
Place of birth for the foreign-born population - St. Vincent and the Grenadines (%)
Place of birth for the foreign-born population - Trinidad and Tobago (%)
Place of birth for the foreign-born population - West Indies (%)
Place of birth for the foreign-born population - Other Caribbean (%)
Place of birth for the foreign-born population - Belize (%)
Place of birth for the foreign-born population - Costa Rica (%)
Place of birth for the foreign-born population - El Salvador (%)
Place of birth for the foreign-born population - Guatemala (%)
Place of birth for the foreign-born population - Honduras (%)
Place of birth for the foreign-born population - Mexico (%)
Place of birth for the foreign-born population - Nicaragua (%)
Place of birth for the foreign-born population - Panama (%)
Place of birth for the foreign-born population - Other Central America (%)
Place of birth for the foreign-born population - Argentina (%)
Place of birth for the foreign-born population - Bolivia (%)
Place of birth for the foreign-born population - Brazil (%)
Place of birth for the foreign-born population - Chile (%)
Place of birth for the foreign-born population - Colombia (%)
Place of birth for the foreign-born population - Ecuador (%)
Place of birth for the foreign-born population - Guyana (%)
Place of birth for the foreign-born population - Peru (%)
Place of birth for the foreign-born population - Uruguay (%)
Place of birth for the foreign-born population - Venezuela (%)
Place of birth for the foreign-born population - Other South America (%)
Place of birth for the foreign-born population - Canada (%)
Place of birth for the foreign-born population - Other Northern America (%)
Place of birth for the foreign-born population - Other (%)
Latest news about races in Haverhill, MA collected exclusively by city-data.com from local newspapers, TV, and radio stations
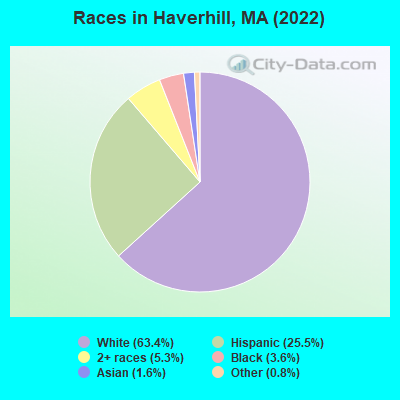
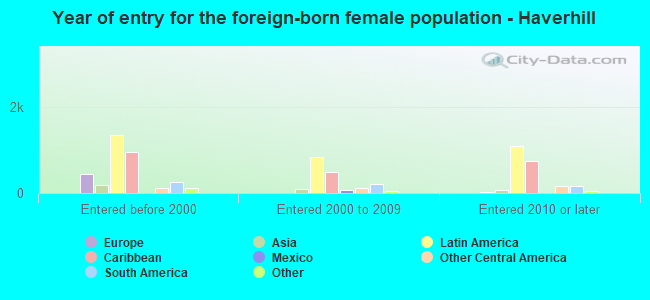
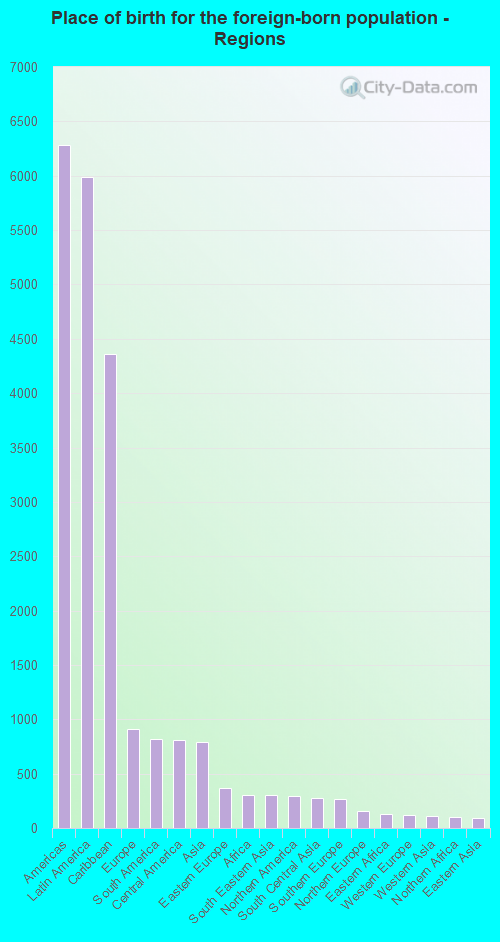
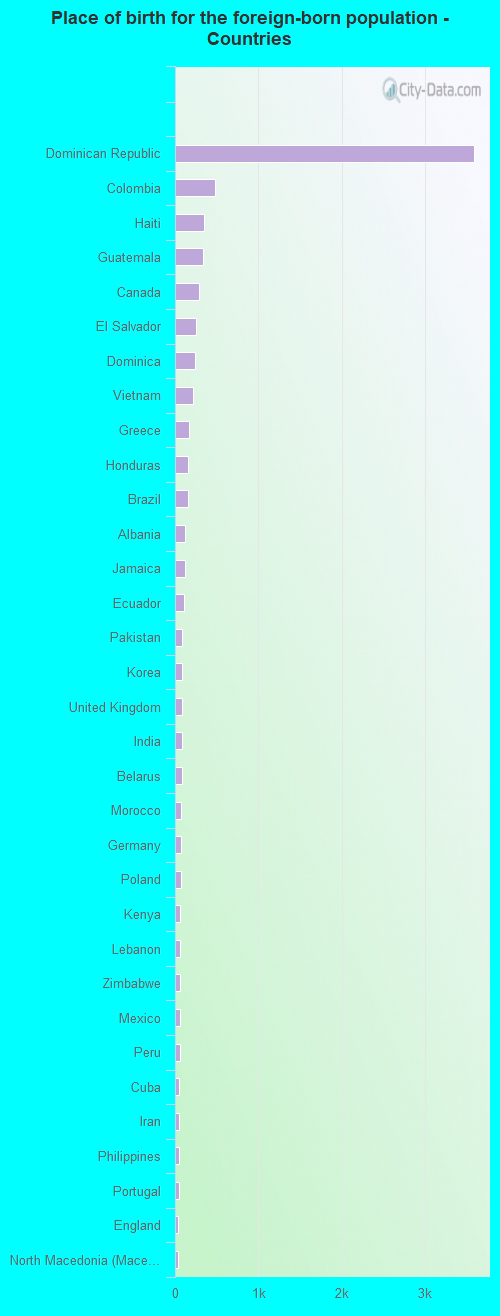
According to 2022 data, the most numerous races in Haverhill, MA are White alone (42,678 residents), Hispanic (17,155 residents), and Asian alone (1,053 residents). 68.5% of Haverhill residents speak English at home. 12.3% of Haverhill, MA residents are foreign-born (8.7% born in Latin America, 1.3% born in Europe), which is 45.9% less than the foreign-born rate of 18.0% across the entire state of Massachusetts.
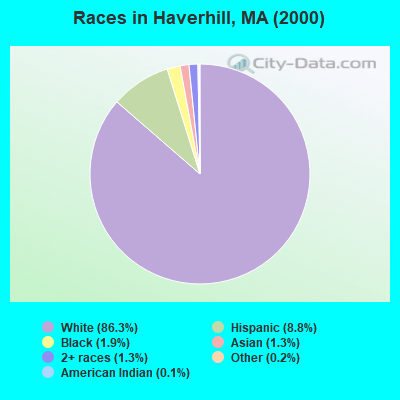
Race distribution in Haverhill
2000 2022
5,198,359 81.9% White alone 428,729 6.8% Hispanic 318,329 5.0% Black alone 236,786 3.7% Asian alone 110,338 1.7% Two or more races 43,586 0.7% Other race alone 11,264 0.2% American Indian alone 1,706 0.03% Native Hawaiian and Other
4,676,627 67.0% White alone 911,038 13.0% Hispanic 501,463 7.2% Asian alone 459,740 6.6% Black alone 341,889 4.9% Two or more races 84,403 1.2% Other race alone 5,838 0.08% American Indian alone 976 0.01% Native Hawaiian and Other
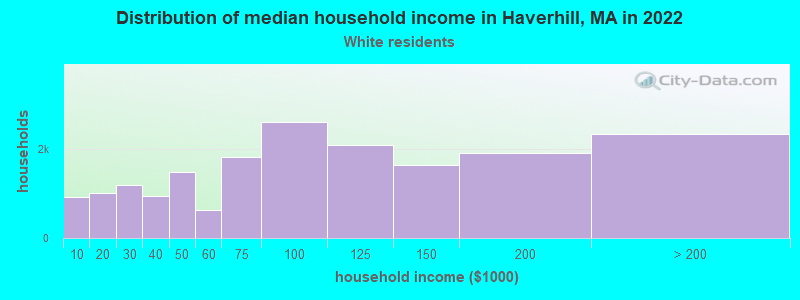
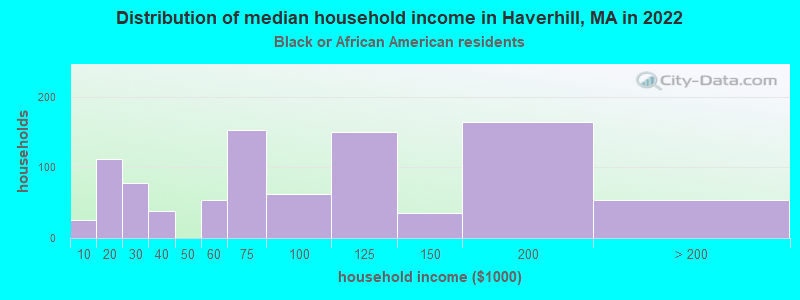
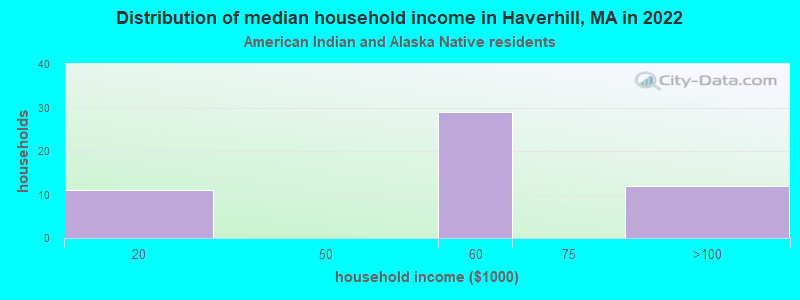
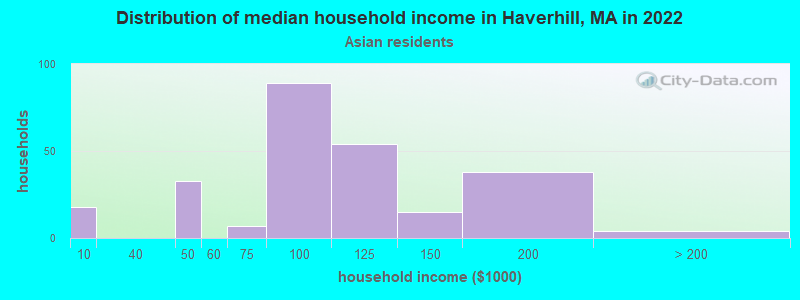
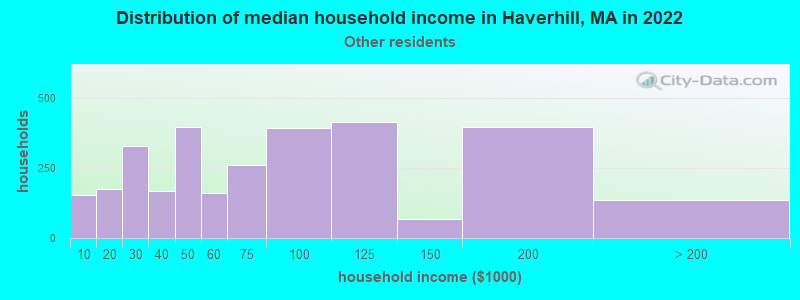
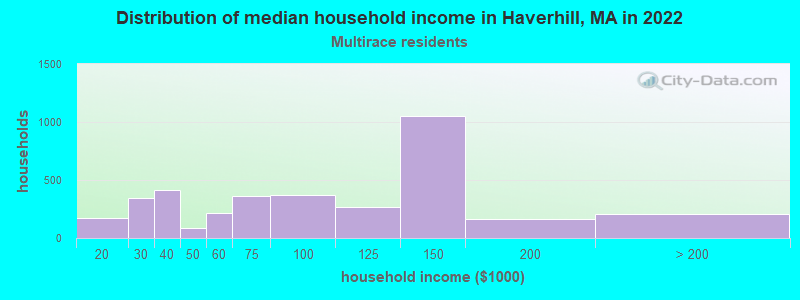
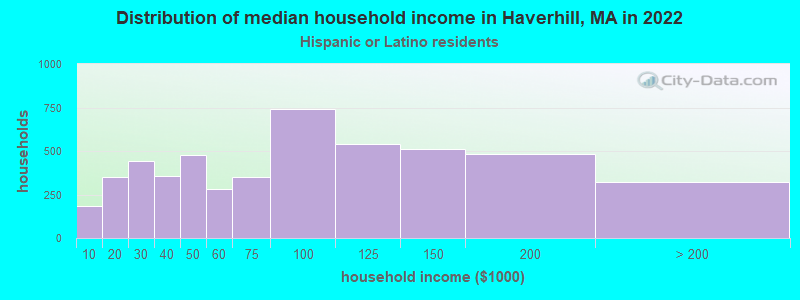
Income and house value in Haverhill Median household income in 2022 $86,481 White non-Hispanic householders$73,077 Black householders$47,733 Some other race householders$121,381 Two or more races householders$85,645 Hispanic or Latino race householdersMedian 2022 house value $476,951 White Non-Hispanic householders$382,812 Black or African American householders$500,188 American Indian or Alaska Native householders $428,392 Asian householders$397,112 Some other race householders$446,862 Two or more races householders$387,281 Hispanic or Latino householders
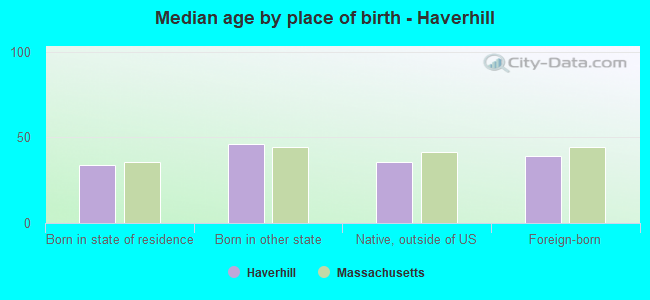
Median age by race in Haverhill
44.3 Median age for White residents39.0 46.7 34.2 Median age for Black or African American residents32.4 43.2 -666,666,666.0 Median age for American Indian / Alaska Native residents-666,666,666.0 -666,666,666.0 41.3 Median age for Asian residents-666,666,666.0 -666,666,666.0 -666,666,666.0 Median age for Native Hawaiian / Pacific Islander residents-666,666,666.0 -666,666,666.0 28.1 Median age for Other race residents28.3 25.7 31.5 Median age for Two or more races residents32.9 26.0 45.6 Median age for White alone residents42.0 49.9 28.2 Median age for Hispanic or Latino residents29.7 25.8
Owner/renter occupied households by race in Haverhill
House owners and renters - White residents 12,393 66.4% Owner occupied6,276 33.6% Renter occupiedHouse owners and renters - Black or African American residents 364 60.3% Owner occupied240 39.7% Renter occupiedHouse owners and renters - American Indian / Alaska Native residents 17 39.0% Owner occupied26 61.0% Renter occupiedHouse owners and renters - Asian residents 212 79.4% Owner occupied55 20.6% Renter occupiedHouse owners and renters - Other race residents 1,093 37.9% Owner occupied1,794 62.1% Renter occupiedHouse owners and renters - Two or more races residents 2,239 70.0% Owner occupied961 30.0% Renter occupiedHouse owners and renters - White alone residents 12,051 66.1% Owner occupied6,188 33.9% Renter occupiedHouse owners and renters - Hispanic or Latino residents 3,321 58.7% Owner occupied2,333 41.3% Renter occupied
Language usage in Haverhill
English speakers - Total 68.5% of residents of Haverhill speak English at home.
27.2% of residents speak Spanish at home 10,320 61.1% Speak English very well6,560 38.9% Speak English less than very well4.3% of residents speak other language at home 2,059 77.4% Speak English very well602 22.6% Speak English less than very well
English speakers - Born in the United States 84.9% of residents of Haverhill speak English at home.
11.3% of residents speak Spanish at home 1,030 96.2% Speak English very well41 3.8% Speak English less than very well3.8% of residents speak other language at home 311 87.1% Speak English very well46 12.9% Speak English less than very well
English speakers - Native, born elsewhere 22.2% of residents of Haverhill speak English at home.
75.7% of residents speak Spanish at home 1,317 83.0% Speak English very well269 17.0% Speak English less than very well2.1% of residents speak other language at home 44 100.0% Speak English very well
English speakers - Foreign-born 7.6% of residents of Haverhill speak English at home.
76.5% of residents speak Spanish at home 3,676 43.2% Speak English very well4,831 56.8% Speak English less than very well16.0% of residents speak other language at home 1,342 75.6% Speak English very well433 24.4% Speak English less than very well
White (Caucasian) - Speak only English Native:
95.8% (37,597)Foreign-born:
29.3% (417)
White (Caucasian) - Speak another language Native:
4.2% (1,664)Foreign-born:
70.7% (1,005)
Black or African American - Speak only English Native:
81.7% (1,320)Foreign-born:
27.6% (198)
Black or African American - Speak another language Native:
18.7% (302)Foreign-born:
72.3% (521)
American Indian / Alaska Native - Speak another language Native:
100.0% (35)Foreign-born:
100.0% (80)
Asian - Speak only English Native:
34.2% (170)Foreign-born:
14.3% (81)
Asian - Speak another language Native:
61.1% (304)Foreign-born:
85.4% (485)
Other race - Speak only English Native:
21.5% (670)Foreign-born:
3.3% (179)
Other race - Speak another language Native:
78.5% (2,441)Foreign-born:
96.7% (5,174)
Two or more races - Speak only English Native:
25.9% (1,735)Foreign-born:
5.8% (218)
Two or more races - Speak another language Native:
74.1% (4,962)Foreign-born:
94.2% (3,537)
White alone - Speak only English Native:
97.2% (36,645)Foreign-born:
29.3% (417)
White alone - Speak another language Native:
2.8% (1,071)Foreign-born:
70.7% (1,005)
Hispanic or Latino - Speak only English Native:
21.4% (2,171)Foreign-born:
4.0% (355)
Hispanic or Latino - Speak another language Native:
78.6% (7,996)Foreign-born:
96.0% (8,507)
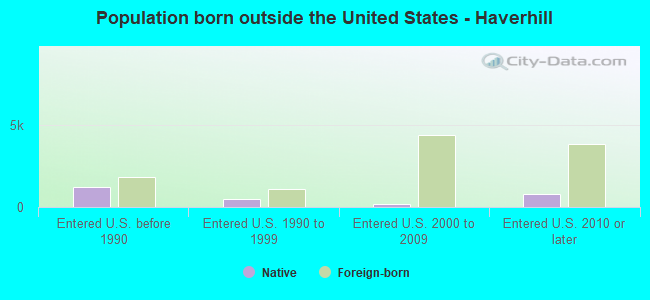
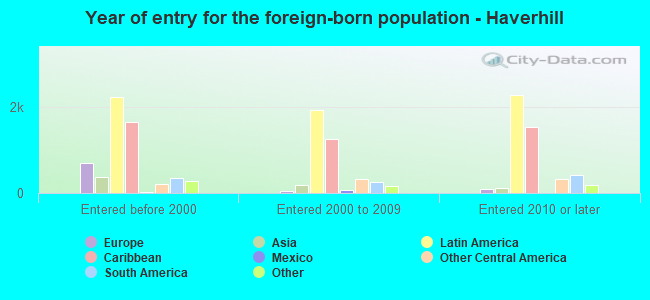
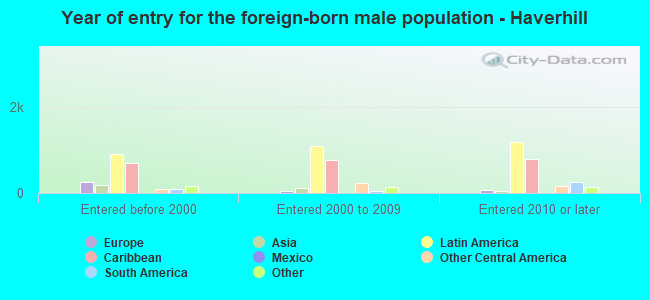
Foreign-born residents in Haverhill 8,304 residents are foreign born (8.7% Latin America , 1.3% Europe ).
This city:
12.3%Massachusetts:
17.6%
Marital status for residents in Haverhill Marital status - White (Caucasian) population 15 years and over
Males 40.0% Never married39.4% Now married1.0% Separated3.7% Widowed16.0% DivorcedFemales 35.7% Never married37.4% Now married2.4% Separated9.1% Widowed15.5% DivorcedWomen who gave birth in the past 12 months Now married:
100.0% (411)Unmarried:
0.0% (0)
Women who did not give birth in the past 12 months Now married:
36.6% (3,232)Unmarried:
63.4% (5,608)
Marital status - Black or African American population 15 years and over
Males 59.7% Never married36.4% Now married0.8% Separated0.0% Widowed3.2% DivorcedFemales 51.7% Never married28.5% Now married3.4% Separated4.6% Widowed11.8% DivorcedWomen who gave birth in the past 12 months Now married:
21.9% (7)Unmarried:
78.1% (23)
Women who did not give birth in the past 12 months Now married:
22.7% (131)Unmarried:
77.3% (445)
Marital status - American Indian / Alaska Native population 15 years and over
Males 0.0% Never married47.6% Now married52.4% Separated0.0% Widowed0.0% DivorcedFemales 81.6% Never married18.4% Now married0.0% Separated0.0% Widowed0.0% DivorcedWomen who did not give birth in the past 12 months Now married:
18.4% (8)Unmarried:
81.6% (37)
Marital status - Asian population 15 years and over
Males 40.0% Never married53.6% Now married2.5% Separated0.0% Widowed3.9% DivorcedFemales 46.7% Never married39.8% Now married2.2% Separated2.2% Widowed9.1% DivorcedWomen who gave birth in the past 12 months Now married:
100.0% (12)Unmarried:
0.0% (0)
Women who did not give birth in the past 12 months Now married:
41.2% (183)Unmarried:
58.8% (261)
Marital status - Other race population 15 years and over
Males 50.5% Never married38.6% Now married4.3% Separated1.1% Widowed5.5% DivorcedFemales 51.1% Never married28.5% Now married4.8% Separated3.8% Widowed11.8% DivorcedWomen who gave birth in the past 12 months Now married:
45.5% (76)Unmarried:
54.5% (92)
Women who did not give birth in the past 12 months Now married:
31.0% (728)Unmarried:
69.0% (1,621)
Marital status - Two or more races population 15 years and over
Males 38.1% Never married54.6% Now married3.6% Separated0.0% Widowed3.7% DivorcedFemales 31.9% Never married44.3% Now married7.4% Separated3.7% Widowed12.6% DivorcedWomen who gave birth in the past 12 months Now married:
60.6% (172)Unmarried:
39.4% (112)
Women who did not give birth in the past 12 months Now married:
35.9% (931)Unmarried:
64.1% (1,665)
Marital status - White alone, not Hispanic / Latino population 15 years and over
Males 39.7% Never married39.0% Now married1.0% Separated3.8% Widowed16.5% DivorcedFemales 35.6% Never married37.0% Now married2.4% Separated9.3% Widowed15.8% DivorcedWomen who gave birth in the past 12 months Now married:
100.0% (333)Unmarried:
0.0% (0)
Women who did not give birth in the past 12 months Now married:
36.6% (3,133)Unmarried:
63.4% (5,420)
Marital status - Hispanic or Latino population 15 years and over
Males 36.8% Never married53.4% Now married2.7% Separated0.0% Widowed7.0% DivorcedFemales 40.3% Never married42.9% Now married7.3% Separated3.8% Widowed5.7% DivorcedWomen who gave birth in the past 12 months Now married:
70.0% (312)Unmarried:
30.0% (134)
Women who did not give birth in the past 12 months Now married:
45.6% (2,101)Unmarried:
54.4% (2,511)
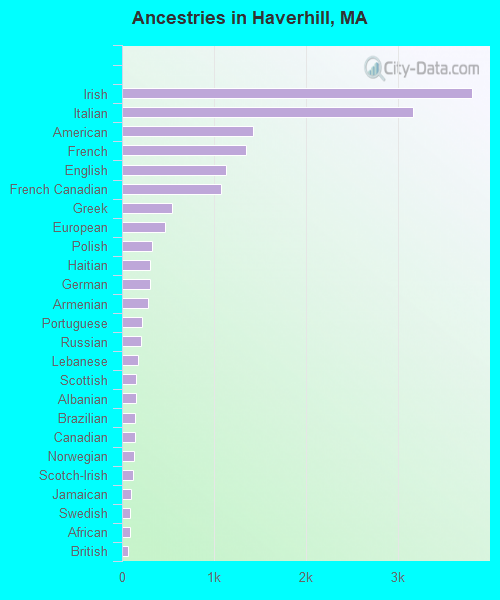
Ancestries in Haverhill
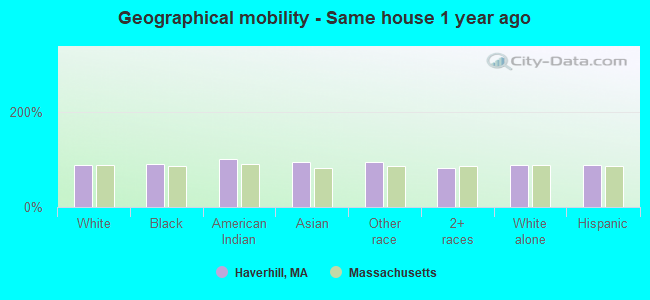
3,804 12.7% Irish3,172 10.6% Italian1,425 4.8% American1,351 4.5% French1,137 3.8% English1,082 3.6% French Canadian541 1.8% Greek469 1.6% European327 1.1% Polish304 1.0% Haitian303 1.0% German283 0.9% Armenian218 0.7% Portuguese211 0.7% Russian169 0.6% Lebanese155 0.5% Scottish150 0.5% Albanian146 0.5% Brazilian145 0.5% Canadian132 0.4% Norwegian117 0.4% Scotch-Irish101 0.3% Jamaican89 0.3% Swedish86 0.3% African65 0.2% British57 0.2% Hungarian49 0.2% Ghanaian49 0.2% Macedonian49 0.2% British West Indian43 0.1% Trinidadian and Tobagonian40 0.1% Scandinavian37 0.1% West Indian34 0.1% Lithuanian34 0.1% Slovak30 0.1% Kenyan25 0.08% Iranian18 0.06% Croatian16 0.05% Jordanian15 0.05% Austrian15 0.05% Basque14 0.05% Welsh13 0.04% Slavic12 0.04% Ethiopian12 0.04% Ukrainian10 0.03% Danish10 0.03% Israeli9 0.03% Eastern European8 0.03% Nigerian8 0.03% Turkish7 0.02% Czech5 0.02% Celtic5 0.02% Finnish4 0.01% Palestinian4 0.01% Liberian
Geographical mobility in Haverhill Same house 1 year ago 37,204 87.3% White (Caucasian)2,260 89.6% Black or African American103 100.0% American Indian / Alaska Native997 93.7% Asian7,636 94.0% Other race9,057 80.6% Two or more races35,662 87.3% White alone, not Hispanic / Latino15,018 89.1% Hispanic or LatinoMoved within same county 2,554 6.0% White / Caucasian66 2.6% Black or African American298 3.7% Other race1,750 15.6% Two or more races2,554 6.3% White alone, not Hispanic / Latino1,191 7.1% Hispanic or LatinoMoved within same state 1,806 4.2% White / Caucasian116 4.6% Black or African American33 3.1% Asian66 0.8% Other race397 3.5% Two or more races1,806 4.4% White alone, not Hispanic / Latino220 1.3% Hispanic or LatinoMoved from different state 792 1.9% White / Caucasian106 4.2% Black or African American79 0.7% Two or more races792 1.9% White alone, not Hispanic / Latino91 0.5% Hispanic or LatinoMoved from abroad 238 0.6% White7 0.3% Black or African American9 0.8% Asian60 0.7% Other race45 0.1% White alone, not Hispanic / Latino80 0.5% Hispanic or Latino
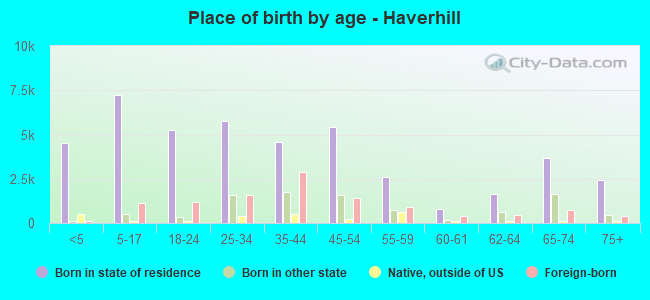
Children Nativity (place of birth) in Haverhill
Children under 6 years - Living with two parents Both parents native 1,650 100.0% NativeBoth parents foreign-born 249 100.0% NativeOne native, one foreign-born parent 579 100.0% NativeChildren under 6 years - Living with one parent Native parent 1,459 100.0% NativeForeign-born parent 417 100.0% NativeChildren 6 to 17 years - Living with two parents Both parents native 3,232 100.0% NativeBoth parents foreign-born 957 92.9% Native73 7.1% Foreign-bornOne native, one foreign-born parent 674 88.1% Native91 11.9% Foreign-bornChildren 6 to 17 years - Living with one parent Native parent 3,233 100.0% NativeForeign-born parent 688 61.5% Native430 38.5% Foreign-born
Grandparents responsible for own grandchildren in Haverhill
Grandparents (30 to 59 years) White / Caucasian 74 32.9% Responsible for grandchildren151 67.1% Not responsible for grandchildrenBlack or African American 38 100.0% Not responsible for grandchildrenOther race 56 85.7% Responsible for grandchildren9 14.3% Not responsible for grandchildrenTwo or more races 124 70.4% Responsible for grandchildren52 29.6% Not responsible for grandchildrenWhite alone, not Hispanic / Latino 52 26.6% Responsible for grandchildren142 73.4% Not responsible for grandchildrenHispanic or Latino 113 59.4% Responsible for grandchildren77 40.6% Not responsible for grandchildrenGrandparents (60 years and over) White / Caucasian 131 26.1% Responsible for grandchildren372 73.9% Not responsible for grandchildrenBlack or African American 13 100.0% Not responsible for grandchildrenOther race 18 10.9% Responsible for grandchildren144 89.1% Not responsible for grandchildrenTwo or more races 19 10.6% Responsible for grandchildren161 89.4% Not responsible for grandchildrenWhite alone, not Hispanic / Latino 106 22.2% Responsible for grandchildren371 77.8% Not responsible for grandchildrenHispanic or Latino 105 28.4% Responsible for grandchildren265 71.6% Not responsible for grandchildren